Measure and Optimize Page Load Time With Selenium
Himanshu Sheth
Posted On: March 11, 2019
![]() 121958 Views
121958 Views
![]() 14 Min Read
14 Min Read
There are a number of metrics that are considered during the development & release of any software product. One such metric is the ‘user-experience’ which is centred on the ease with which your customers can use your product. You may have developed a product that solves a problem at scale, but if your customers experience difficulties in using it, they may start looking out for other options. Website or web application’s which offers better web design, page load speed, usability (ease of use), memory requirements, and more. Today, I will show you how you can measure page load time with Selenium for automated cross browser testing. Before doing that, we ought to understand the relevance of page load time for a website or a web app.
Why Focus On Measuring Page Load Time?
Loading time refers to the period from the browser’s request to the page fully loading and rendering. It includes ‘Time to first byte,’ which is the time between the request and the browser receiving the first data byte
More than 40 percent of the website visitors may leave if the loading time is more than 3 seconds. This is why your software development, design, and product development team should focus on improving the performance of your web product. Don’t believe me? Below, is an image from a study conducted by Google related to page load speed with respect to bounce rate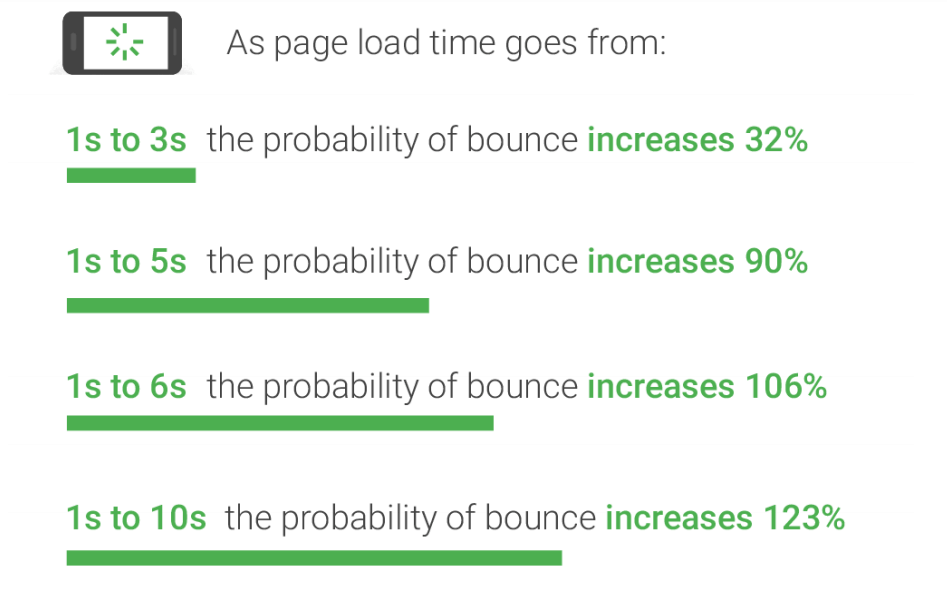
Popular search engines measure the time it takes for the receipt of the first byte in order to determine the site speed/page speed. Hence, slow rendering pages can have a huge hit on the search engine rankings. Slow page speed also means that the search engine crawler can crawl less number of pages within the allocated crawl budget, which would eventually show up in the rankings.
A fact known to most of us is that if a website offers a more mobile-friendly user experience with faster page load time on mobile, Google would value those websites more and rank them on top in mobile search results. For this purpose, Google came up with a new mobile-friendly algorithm on April 21, 2015. Therefore, it is important to test a mobile website for user-friendliness.
It is not just Google but your customers would also won’t prefer your website or web app if the pages on the website don’t load with the lightning fast pace. Even one-second delay in the page load time can result in higher bounce rates and reduced number of page-views. It also has a negative impact on Click Through Rates (CTR) and conversions. In simple terms, measuring page-load time (also referred to as Page Speed) is the amount of time it takes for the content/page to appear on the screen. Lower the page-load time, better is the usability factor of the product, better is your conversion rate.
Watch this video to learn about network interception using bidirectional APIs in Selenium 4.
Metrics To Consider For Measuring Page Load Time
Different pages on the same website/web-app can have different load times, depending on the design being used for the development of the pages. Developers might have used either of the techniques to reduce the page load time.
a. File compression techniques for image optimization.
b. Browser caching.
c. Reduced number of redirects.
d. Reduced usage of non-blocking JavaScript.
e. Images of variable sizes depending on the device being used by the customer
That is from the developers’ end, but how would you go about testing the website by measuring the page load time of every page?
There could be hundreds of webpages on your website. Not to forget, you would have to perform browser compatibility testing to realize the page load time of every page on your website across hundreds of browsers and browser versions.
There is a possibility that your web page load time will differ if accessed from different browsers (including browser versions). It would also depend on the platform (desktop, tablet, mobile, etc.) and the geographical location from where your website/web-app is being accessed. You can’t go about testing every combination(web page + browser + browser version + operating system) manually. This is where Selenium grid comes to the rescue by empowering you to perform automated cross browser testing of your web pages. You can perform automation testing for measuring page load time with Selenium. Before we do that, it is important to have a look at the Navigation Timing.
Using Navigation Timing To Measure Page Load Speed
So, how do you measure page load speed? Navigation Timing is a popular JavaScript API which can be used for accurately measuring the performance on the web. Though there are other libraries available, Navigation Timing is more reliable & accurate.
The Navigation Timing API is available in most of the popular web browsers namely Firefox, Chrome, Internet Explorer, etc. Though there is the number of interfaces available for Navigation Timing, most of the details related to page load time can be accessed using the properties of the window.performance object. The window.performance returns more accurate results since the API makes use of HRT (High-Resolution Time) to calculate the necessary timings related to a web page.
The important properties of the window.performance object are
navigation – Details about how the user navigated to the web page.
timing – Information about the navigation & page load events.
Other interfaces that are available as a part of the Navigation Timing API are PerformanceNavigationTiming, PerformanceTiming, PerformanceNavigation. Performance data is pushed from the client side to server side with the help of an XHR(XMLHttpRequest). Using the Navigation Timing API, you can keep a tab on every request. Time is taken for loading the new page, the time is taken for unloading the previous page, time encountered for looking up the domain name, window. onload total time, response start time, etc. are some of the properties that can be accessed via the window.performance property. Below is an image representing the elements of PerformanceTiming interface.
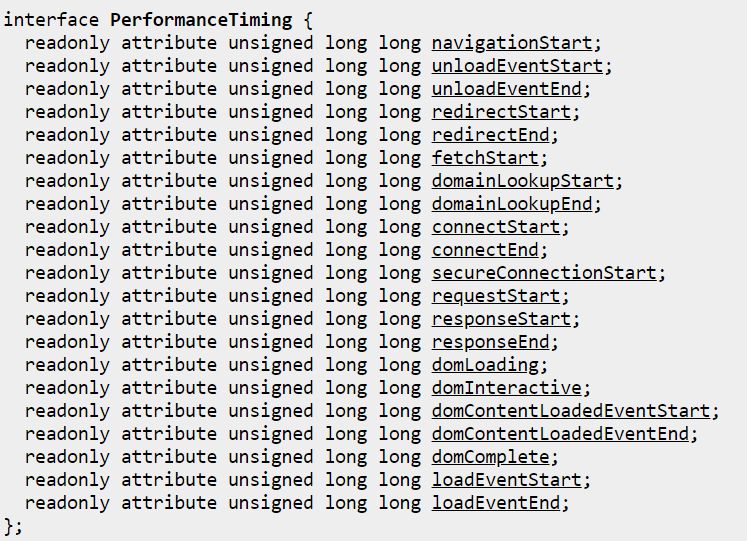
The timing property returns important performance information about the current page/document e.g. details about navigationStart, connectStart, connectEnd, domainLookupStart, domainLookupEnd, and more.
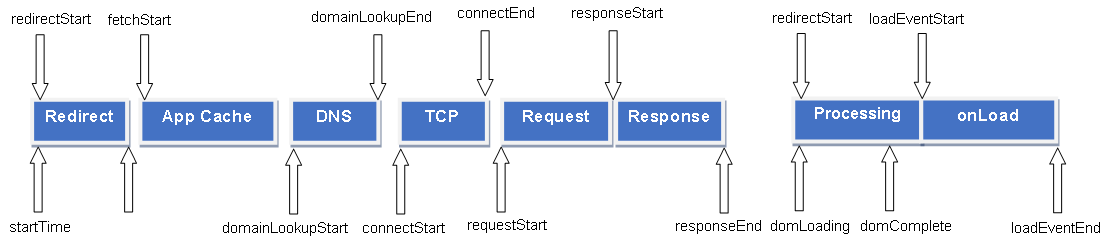
The figure below shows the order of performance of navigation.timing events. Each performance.timing attribute shows the time of the navigation event i.e. when the previous page was unloaded? when the latest page was requested? when the Document Object Model (DOM) began loading the page? and more. The timing is in milliseconds which is calculated since midnight of January 1, 1970 (UTC). You can have a look at the official W3C documentation on PerformanceTiming interface in order to get more information about each event.
Though you can access the window.performance through your source code, in order to see window.performance in action, you can access the option via the debug console of the browser (Firefox, Chrome, etc.). For example, open the LambdaTest website in Firefox/Chrome browser. In our case, we are using the Firefox browser. Now open the Inspect Element option to go to the debug console. Open the console and key in window.performance.timing in the console window. As seen from the output window, window.performance returns the performance object which also contains the timing property. 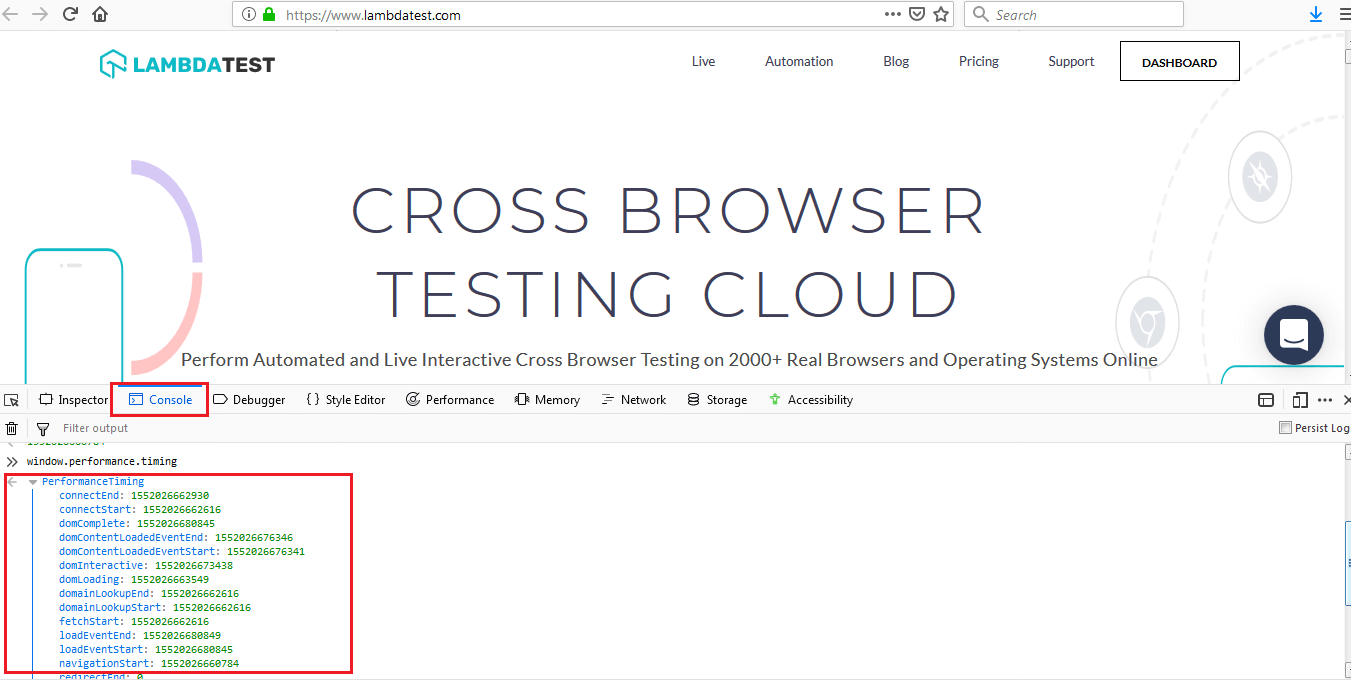
Further details about Navigation Timing API and corresponding browser compatibility can be found here.
Automation Testing To Measure Page Load Time With Selenium
You can make use of Selenium to measure the performance of a web page over a period of time. The results that are obtained from the Navigation Timing API can be further used to improve the page load time with Selenium testing and also benchmark those results against your competitors’ web performance. Though there would be visible differences between the home page & functionalities provided by two websites/web-apps (solving a similar problem), it is still important that the page load speed is equal (if not better) than your competition.
Along with tracking & benchmarking the web-page performance, Selenium can also be used to log the statistics of the page to come up with improvements on the client-side. As far as the server side is concerned, major performance improvement can be obtained by making use of the right kind of infrastructure.
Example 1 – Capturing Statistics Of A Web-Page Timings With Navigation Timing API
Let’s have a look at an example where Python is used along with the Selenium framework to capture important statistics about the web-page (e.g. lambdatest.com). It is an example that you can use to get started to measure page load time in Selenium.
|
1 2 3 4 5 6 7 8 9 10 11 12 13 14 15 16 17 18 19 20 21 22 23 24 25 26 27 28 |
''' Loosely based on the example code in http://www.obeythetestinggoat.com/ how-to-get-selenium-to-wait-for-page-load-after-a-click.html ''' ''' Import the necessary packages required for execution ''' from selenium import webdriver ''' Chrome web driver interface ''' hyperlink = "http://lambdatest.com" driver = webdriver.Chrome() driver.get(hyperlink) ''' Use Navigation Timing API to calculate the timings that matter the most ''' navigationStart = driver.execute_script("return window.performance.timing.navigationStart") responseStart = driver.execute_script("return window.performance.timing.responseStart") domComplete = driver.execute_script("return window.performance.timing.domComplete") ''' Calculate the performance''' backendPerformance_calc = responseStart - navigationStart frontendPerformance_calc = domComplete - responseStart print("Back End: %s" % backendPerformance_calc) print("Front End: %s" % frontendPerformance_calc) driver.quit() |
To start with, an instance of Chrome web-driver is created and the web page under test is opened in the browser. We make use of Performance Timing API to obtain the amount of time spent in each event from the time the request was made from the browser. The execute_script option is used to synchronously execute JavaScript code in current window/frame.
For the demo, we have used the following metrics:
- navigationStart – This attribute returns the time spent after the user agent completes unloading the previous page/document. If there was no document prior to loading the new page, navigationStart returns the same value as fetchStart.
- responseStart – This attribute returns the time as soon as the user-agent receives the first byte from the server or from the local sources/application cache.
- domComplete – This attribute returns the time just before the current document/page readiness is set to ‘complete’. document.readyState status as ‘complete’ indicates that the parsing of the page/document is complete & all the resources required for the page are downloaded. We will have a look an example of domComplete in subsequent section.
window.performance. timing.navigationStart, window.performance.timing.responseStart, and window.performance. timing.domComplete are the Timing Navigation options which are passed as arguments to execute_script() API. The measurement of time is in milliseconds (ms).
We have used Eclipse as the IDE for development & testing of the test code. In order to execute the code, press (CTRL + F9) from your Eclipse IDE. Below is the output once the above code is executed, the output shows the time spent in the front-end & back-end activities of the web-page.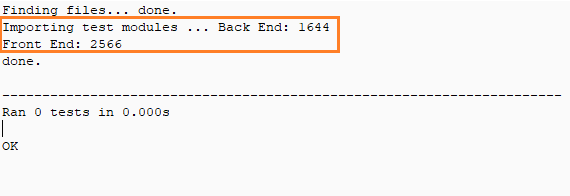

Example 2 – Using WebDriverWait Interface For Element Search On A web-page
We have a look at another example where we load a web-page and search for the presence of an element (div-id) in the page. We search for the div-id for timeout duration of 5 seconds. Once the page is loaded, div-id (in our case: owl-example) is searched for 5 seconds, after which an exception is raised if the owl-example div-id is not present on the web-page. All the necessary modules are imported at the start of the implementation.
|
1 2 3 4 5 6 7 8 9 10 11 12 13 14 15 16 17 18 19 20 21 22 23 24 25 26 27 28 29 30 31 32 33 34 35 36 37 38 39 |
from selenium import webdriver from selenium.common.exceptions import TimeoutException from selenium.webdriver.support.ui import WebDriverWait from selenium.webdriver.support import expected_conditions as EC from selenium.webdriver.common.by import By ''' Create a Chrome webdriver instance''' driver = webdriver.Chrome() #driver = webdriver.Firefox() ''' Open the webpage under test''' driver.get('http://lambdatest.com') timeout = 5 ''''' Test case 1 - The required div-id is not present on the web-page ''''' #while True: try: element_present = EC.presence_of_element_located((By.ID, 'owl-example-1')) WebDriverWait(driver, timeout).until(element_present) print("1 - Element is present on the page") # break except TimeoutException as ex: print("1 - Timed out waiting for page to load " + str(ex)) # break ''''' Test case 2 - The required div-id is not present on the web-page ''''' #while True: try: element_present = EC.presence_of_element_located((By.ID, 'owl-example')) WebDriverWait(driver, timeout).until(element_present) print("2 - Element is present on the page") # break except TimeoutException as ex: print("2 - Timed out waiting for page to load " + str(ex)) # break ''' Free up the resources''' driver.close() driver.quit() |
Like the previous example, we initialize the Chrome webdriver interface. The web-page under test is the LambdaTest homepage – lambdatest.com. The timeout duration is set to 5 seconds. There are two test-cases, details of which are mentioned below
- Test case 1 – The web-page being loaded is checked for the presence of div-id ‘owl-example-1’. Using the WebDriverWait interface, search is performed for 5 seconds. If‘owl-example-1’ is not present on the page, an exception is raised.
- Test case 2 – The test condition is same as Test case 1, except that the div-id under search is ‘owl-example’
Below is the output of the above example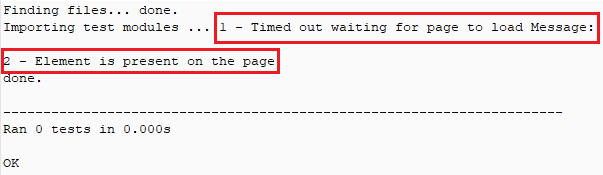
As expected, the first test case fails as the div-id under search is not present on the web-page under test. The search times out after 5 seconds. On the other hand, the second test case passed since the div-id ‘owl-example’ is present on the web-page. For confirmation, please visit the HTML source of LambdaTest. (which is the page being tested) 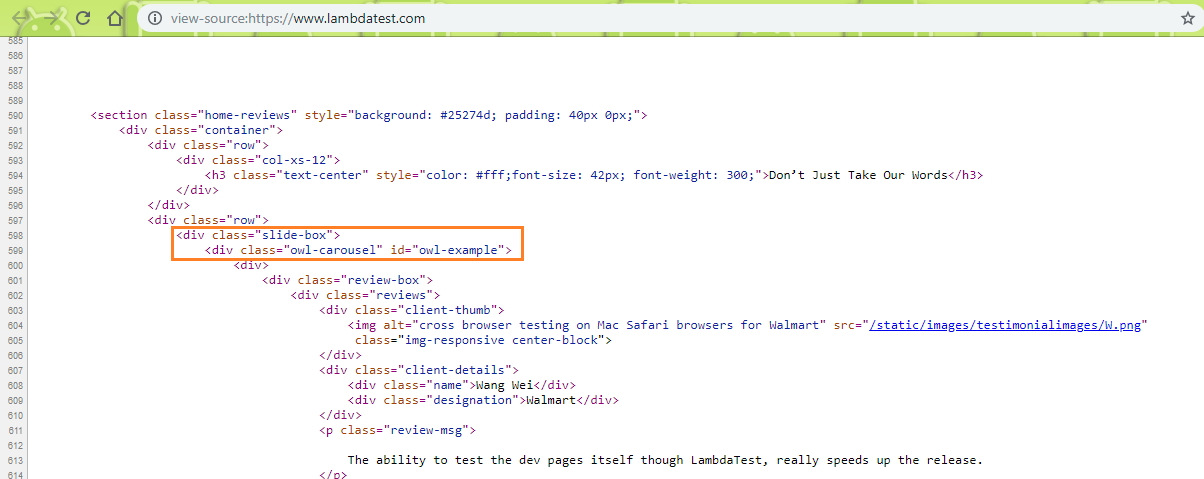
There would be scenarios where you need to perform an operation when a webpage is loaded i.e. document.readyState status as ‘complete’. The operation could either be clicking on a hyper-link or clicking on a button or any other operation. It could be a tricky situation as there might be scenarios where few sections of webpage are loaded asynchronously using AJAX (Asynchronous JavaScript and XML) on the client side. We focus on webpage operations where a new webpage is loaded. In this section of the Selenium testing tutorial, we have a look at the mechanism that Selenium uses to check whether the complete webpage is loaded.

Example 3 – Detection Of Page Load Completion With pytest & Selenium
Selenium has an in-built condition called staleness_of and its own wait_for implementation. staleness_of is the element of the selenium class selenium.webdriver.support.expected_conditions. staleness_of will wait until an element is not attached to the DOM. Below is the implementation of the class
|
1 |
class selenium.webdriver.support.expected_conditions.staleness_of(element) |
element is the actual element on the webpage to wait for. It returns False if the element is attached to the DOM, else it returns True. We will make use of the pytest framework which we have already covered in earlier blogs. In the below example, @contextmanager is used which aids in allocating & releasing necessary resources when required.
|
1 2 3 4 5 6 7 8 9 10 11 12 13 14 15 16 17 18 19 20 21 22 23 24 25 26 27 28 29 30 31 32 33 34 35 36 37 38 39 40 41 42 43 44 |
''' Import the 'modules' that are required for execution ''' ''' In this example, we make use of pytest framework along with Selenium ''' import pytest import pytest_html from selenium import webdriver from selenium.webdriver.chrome.options import Options from selenium.webdriver.common.keys import Keys from time import sleep from contextlib import contextmanager from selenium.webdriver.support.ui import WebDriverWait from selenium.webdriver.support.expected_conditions import \ staleness_of @pytest.fixture(params=["chrome"],scope="class") def driver_init(request): if request.param == "chrome": web_driver = webdriver.Chrome() request.cls.driver = web_driver yield web_driver.close() @pytest.mark.usefixtures("driver_init") class BasicTest: pass class Test_URL(BasicTest): def test_open_url(self): self.driver.get("https://www.lambdatest.com/") print(self.driver.title) sleep(5) @contextmanager def wait_for_page_load(self, timeout=30): #Search for the div-id owl-example old_page = self.driver.find_element_by_id('owl-example') yield WebDriverWait(self.driver, timeout).until( staleness_of(old_page) ) def test_click_operation(self): # Wait for a timeout duration of 10 seconds, after which we perform a CLICK operation with self.wait_for_page_load(timeout=10): self.driver.find_element_by_link_text('FREE SIGN UP').click() print(self.driver.execute_script("return document.readyState")) |
In wait_for_page_load(), search for the div-id owl-example is performed. WebDriverWait is used in combination with ExpectedCondition to achieve Explicit Wait condition. The driver and timeout are passed as arguments. We wait until the element gets stale. In case the element being searched i.e. owl-exampl’ is not present, a TimeoutException is thrown. This is how we check for the staleness of the element.
In test_click_operation(), the webpage lambdatest.com is loaded after which a wait for the maximum duration of 10 seconds is performed. It uses wait_for_page_load() to check whether the element owl-example on the webpage is not stale. Once the webpage is loaded within the timeout, we check if there is an element which has link text FREE SIGN UP which is a button that is hyperlinked to the registration page. Finally, we check the status of web page/document using the Document.readyState property. When the value of this particular property changes, a readystatechange event is fired on the document object.
The three possible states are loading, interactive, and complete. Document.readyState achieves the state as complete if the webpage/document & its dependent resources have finished loading. In our example, if the page is loaded completely, a button click is performed which eventually takes us to the LambdaTest registration page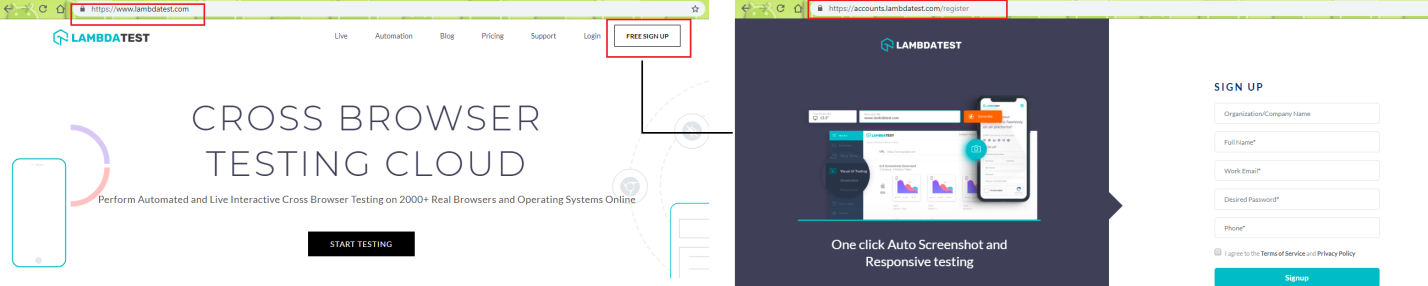
For execution, py.test command is used with verbose enabled and –capture set to no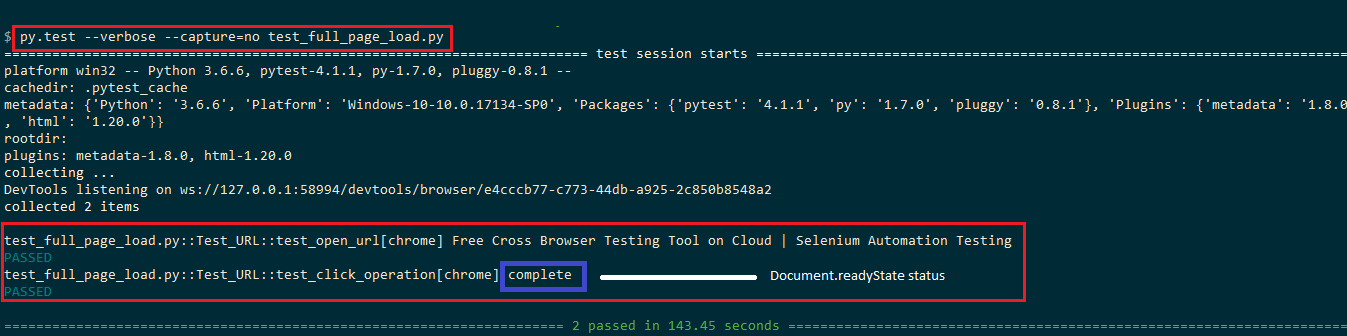
Depending on the target market and the browser that is responsible for bringing you the most traffic, you should create a cross browser testing matrix to perform cross browser testing in an organized manner. Cross browser testing of your product would help you with the findings of valuable test cases which can further be used for improving the page-load times. Rather than creating a local infrastructure to do these tests, you can make use of LambdaTest which offers scalable cross browser testing tool on the Cloud.
Conclusion
Measuring page load time is very important for web-based products since it has a direct impact on the user-experience. Along with optimizing the overall design of your product, it is important to design web pages in a manner that the page load times are kept to the minimum. This would improve the conversions expected out of the product.
Navigation Timing APIs are instrumental in keeping a measure of page load times. You can use the output generated by these APIs for optimization purpose. window. performance returns the performance object which gives important information about the current document/page. It can be used along with the Selenium framework. Measuring page load time with Selenium is critical as a web page can vary across different types & versions of browsers, hence it is important to focus on optimizing the page speed of your product on browsers & platforms for superior customer experience.
Enhance your Selenium interview proficiency with our meticulously curated compilation of questions and answers. Explore the comprehensive list of Selenium Interview Questions and Answers for valuable insights.


Author’s Profile
Himanshu Sheth
Himanshu Sheth is a seasoned technologist and blogger with more than 15+ years of diverse working experience. He currently works as the 'Lead Developer Evangelist' and 'Senior Manager [Technical Content Marketing]' at LambdaTest. He is very active with the startup community in Bengaluru (and down South) and loves interacting with passionate founders on his personal blog (which he has been maintaining since last 15+ years).
Blogs: 132
Got Questions? Drop them on LambdaTest Community. Visit now