Playwright Tutorial: Getting Started With Playwright Framework
Gary Parker
Posted On: June 21, 2022
![]() 45197 Views
45197 Views
![]() 21 Min Read
21 Min Read
Playwright is a framework that I’ve always heard great things about but never had a chance to pick up until earlier this year. And since then, it’s become one of my favorite test automation frameworks to use when building a new automation project. It’s easy to set up, feature-packed, and one of the fastest, most reliable frameworks I’ve worked with.
I’m going to get you through this Playwright tutorial, which will enable you to write end-to-end tests for your future projects. We will also dig into the extensive features it offers, how we can prepare tests for execution on the LambdaTest cloud grid, and an overview of other popular integrations.
In this Playwright testing tutorial, I’ll be stepping through each part of the process so you can follow along, from the initial installation of the Playwright framework until the full execution of a test suite.
If you are preparing for an interview you can learn more through Playwright interview questions.
So, let’s get started!
TABLE OF CONTENTS
What is the Playwright framework?
Built by the Microsoft team, Playwright is a framework for end-to-end testing and automation, which has slowly been building up popularity. You will see it at the top of most people’s favorite frameworks to work with.
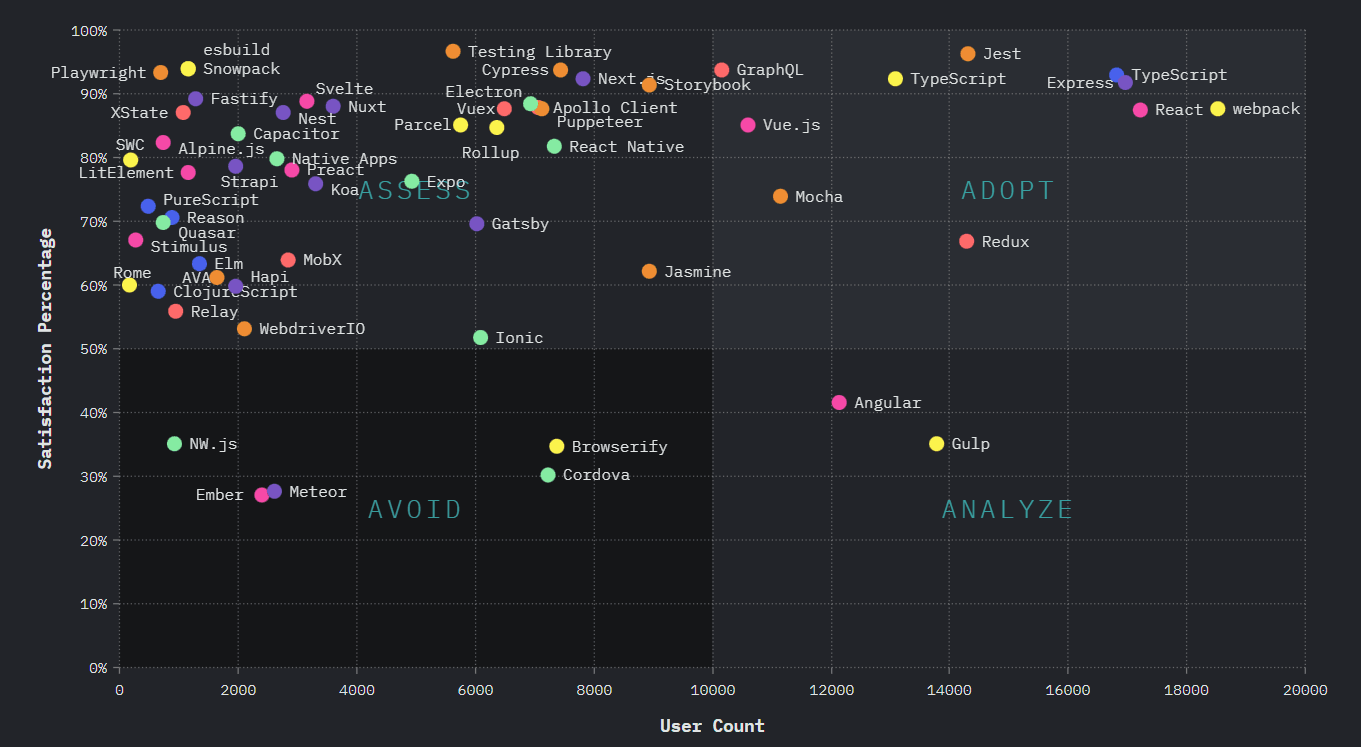
The 2020 State of JavaScript survey among developers reveals that while Cypress adoption is on the upswing, Playwrights adoption remains very much in the early stages of development. However, the current trend of Playwright on GitHub shows the growing popularity of the Playwright framework (39.3k Star, 1.8k Fork, and 12.2k Active Users).
Not only is it versatile and easy to work with, but it has lightning-fast execution speeds and some great features that are unique to the Playwright framework, such as Trace Viewer and Test Generator.
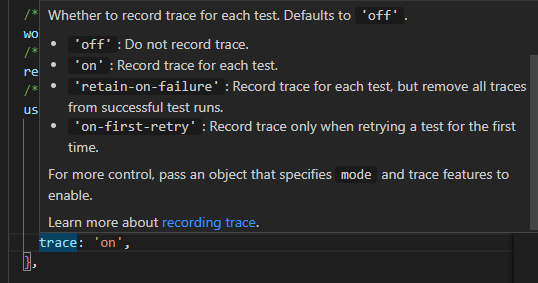
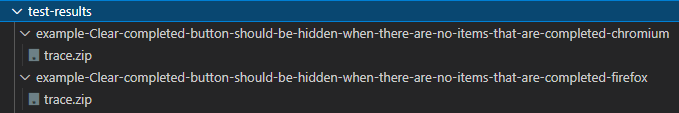
- Trace Viewer is a GUI tool that can be used to review Playwright traces after tests have been executed. If you want to experiment with it, you can set ‘trace’ to ‘on’ in your playwright.config.js:
After the test executions have been completed, there will be trace.zip files generated in your test-results folder:
There are a few different ways these reports can be viewed.
- In your web browser through https://trace.playwright.dev/, where you can drag and drop the trace files.
- By executing the following command in your CLI:
|
1 |
npx playwright show-trace trace.zip |
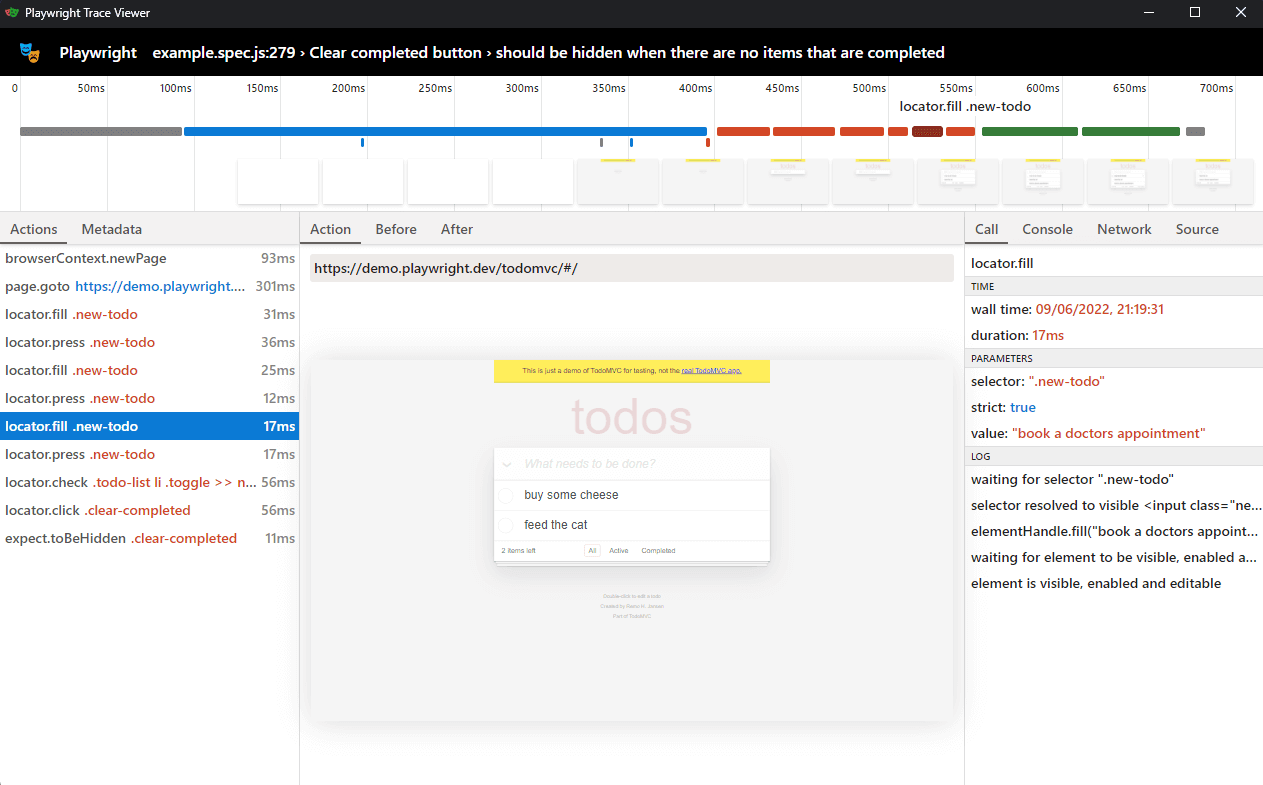
After following either of these processes, you will be presented with the Playwright Trace Viewer. Here you can dig deeper into the actions performed, how long they took to execute, parameters passed, network calls made, and any logs generated during execution.
You can also hover over the trace film strip at the top of the page to see a magnified image of each stage in the execution.
- Test Generator is a browser tool that Playwright provides, which records the actions performed in the browser and generates the equivalent code. This is useful if you want to quickly draft some tests or upskill members of your team who are not so familiar with writing code.
Let’s run through a quick example. We are going to execute the below command, which launches Playwright codegen with the LambdaTest’s Selenium Playground.
|
1 |
npx playwright codegen lambdatest.com/selenium-playground |
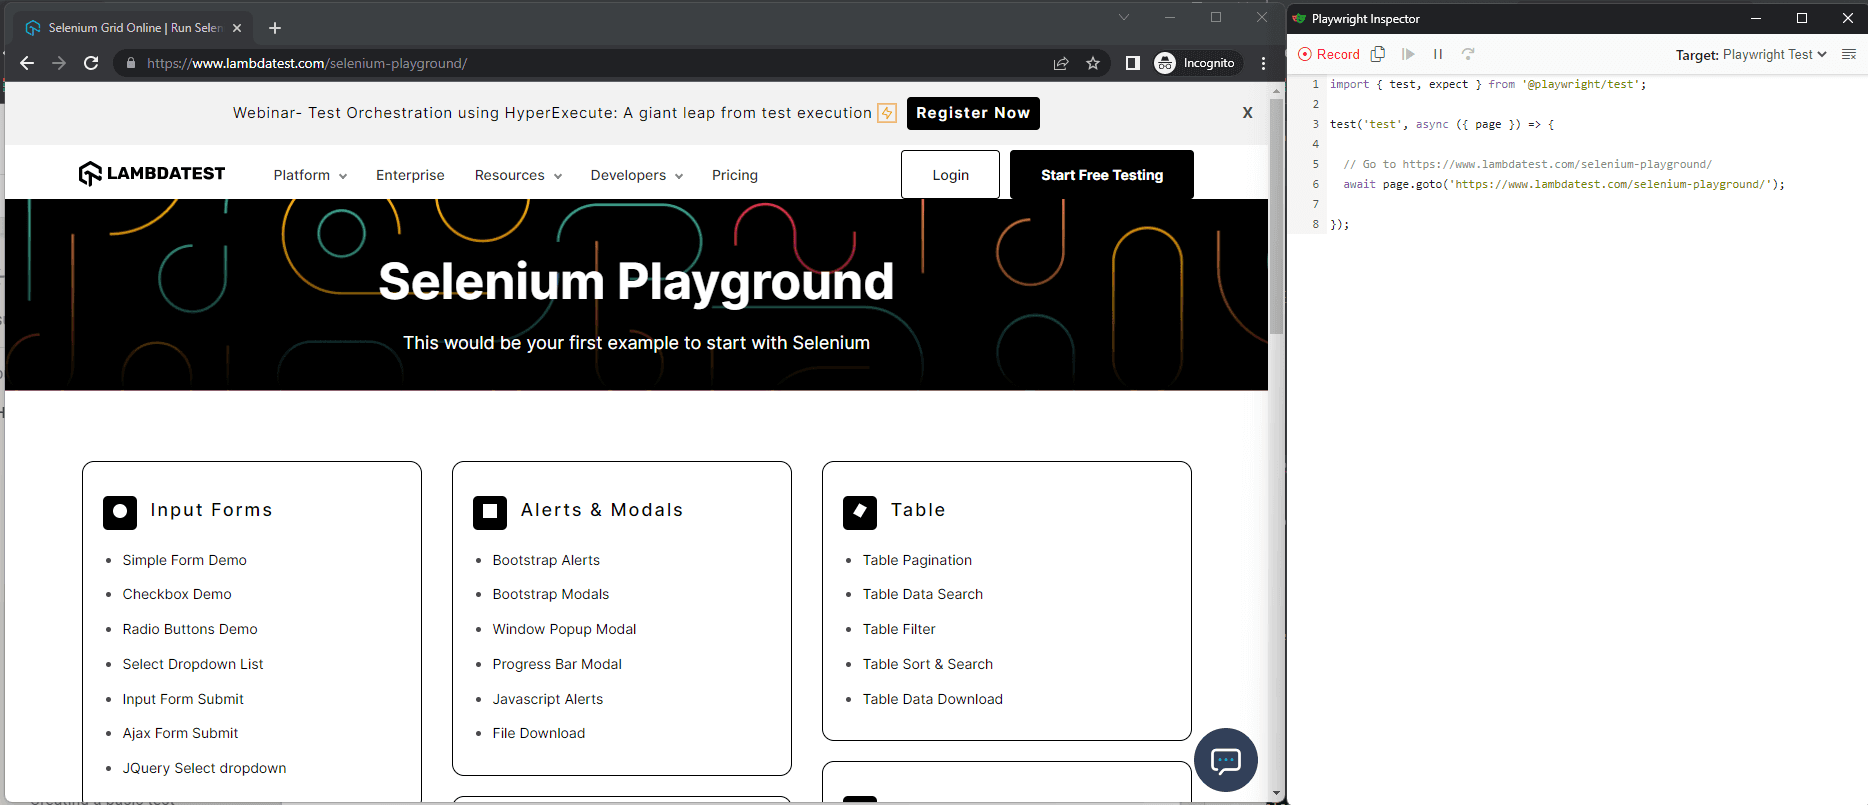
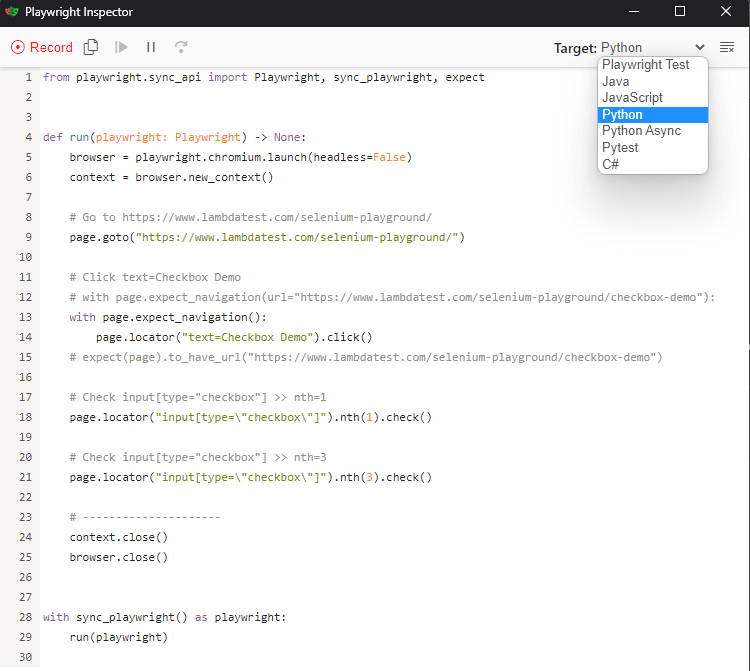
When this is executed, two windows will launch. The first is your website which we can interact with, performing clicks, navigating, and entering data. The second is the Playwright Inspector, where our code will be generated dynamically.
On the first launch, you’ll see that the basic goto method for navigating the website has been generated.
|
1 |
page.goto("https://www.lambdatest.com/selenium-playground/") |
If we interact with the page by selecting some of the checkboxes from the checkbox-demo example, you’ll see code gets generated dynamically.
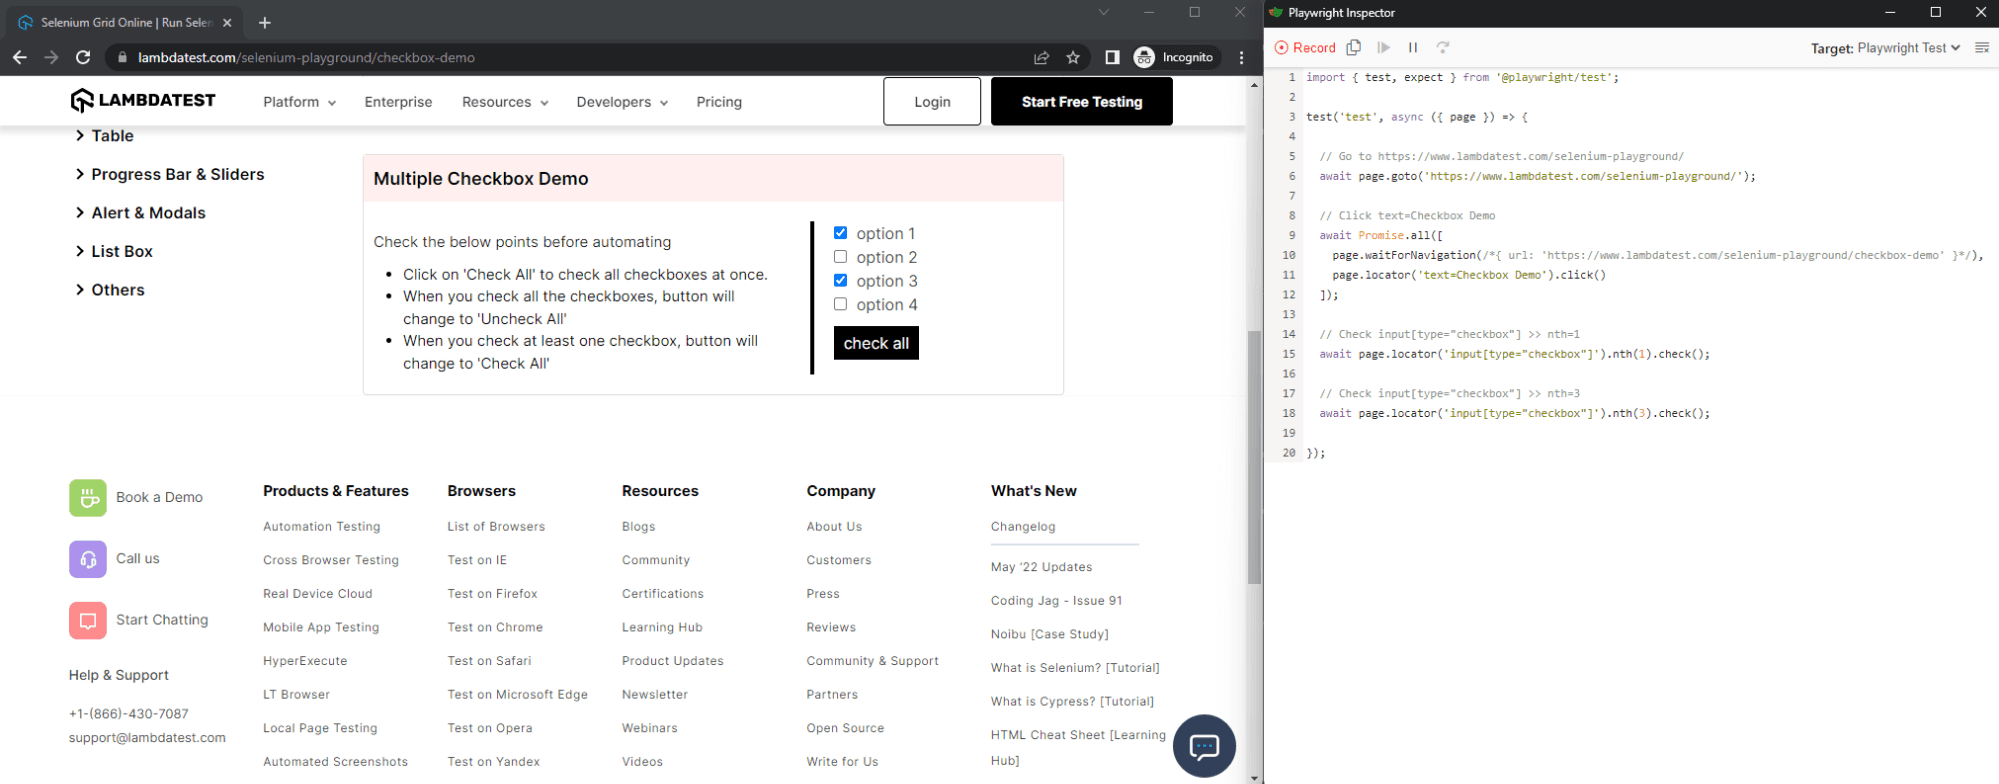
One last thing worth mentioning is the ‘Target’ dropdown in the upper right of the Playwright Inspector. You can select from a list of different languages and export the code in whichever you require:
Watch this Playwright tutorial covers everything you need to get you up and running with the Microsoft Playwright framework with TypeScript.
Why use the Playwright framework?
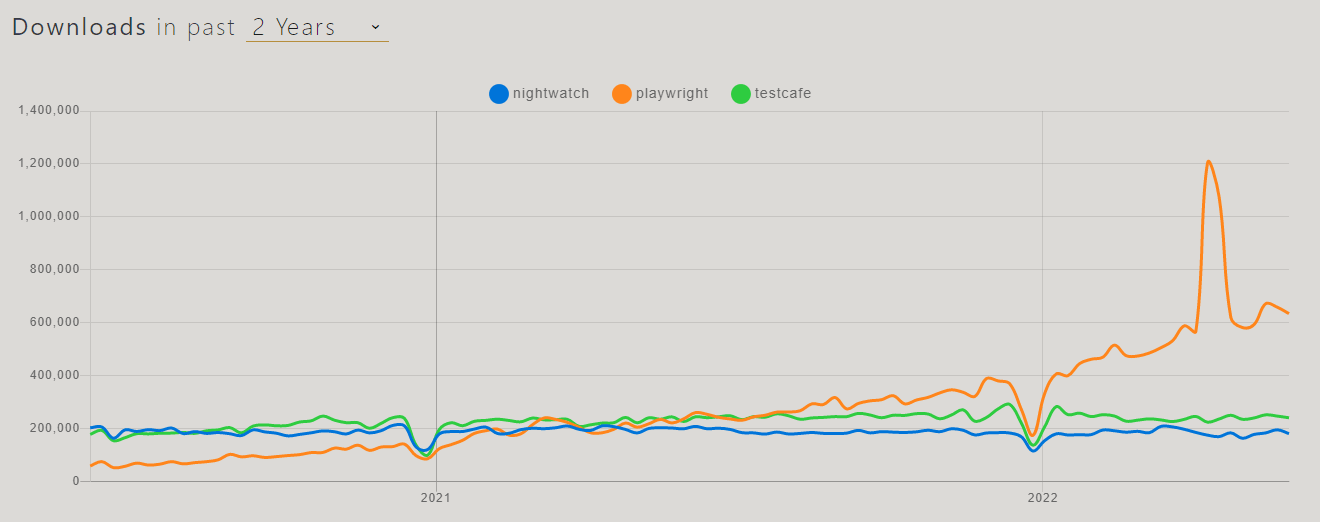
It’s an open-source framework relatively new to the market but is building up popularity fast. Microsoft maintains it and, as a result, receives regular updates and improvements. If we look at the number of downloads for similar frameworks which have been on the market for a while, you can see Playwright has burst onto the scene.
Releases
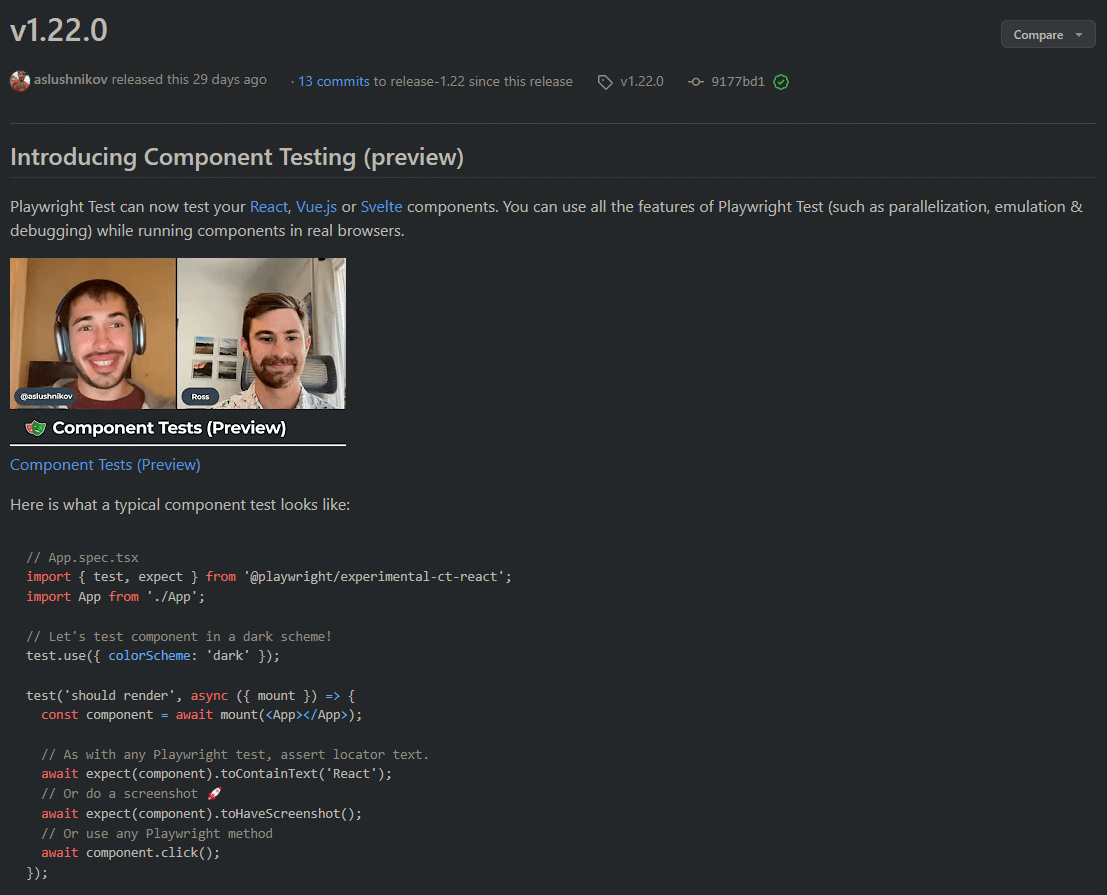
The Playwright team also provides their release notes in the form of video walkthroughs in addition to their standard release notes. This is something I haven’t seen from any of the other major frameworks and is a nice touch for gaining insight from the team building the product.
Here is a small snapshot from their most recent release, where they discuss their new implementation for Component testing.
Competitors
You may be trying to decide to migrate away from a well-established framework such as Selenium or on to Cypress test automation framework, which is also gaining popularity in the community.
My main reason for picking Playwright over others is how intuitive it is and the flexibility with which it can interact with the browser across multiple pages and domains. And lastly, execution speed. Speed is everything. If you can’t run your tests quickly and speed up your test cycle, you can’t deliver your product quickly. If you can’t deliver your product quickly, you’ll have a lot of unhappy stakeholders and customers.
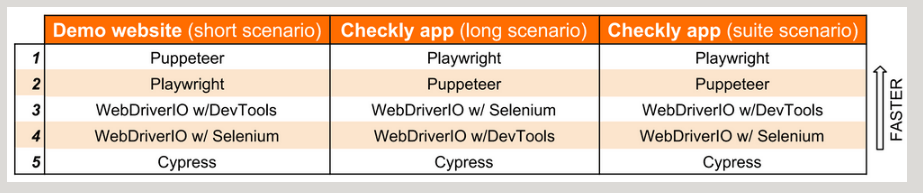
This is a benchmark report that the ChecklyHQ team produced after performing in-depth execution speed monitoring on the major automation tools. As you can see, it pretty much speaks for itself. Playwright tops 2 out of 3 of the scenarios, closely followed by Puppeteer.
Integrations
This is personally one of the most important factors for me when selecting a new tool or framework. Does it integrate well with our current architecture? The worst feeling is implementing something, only to realize later that it doesn’t have native integration, and we have to start building custom webhooks or plugins.
Thankfully the Playwright team has this covered. There are Docker images, so you can quickly execute tests in an isolated and controlled environment. And native CI tool integrations for the popular and top CI/CD tools, including GitHub Actions, Azure Pipelines, CircleCI, Jenkins, and GitLab.
They also provide support for your existing JavaScript test runners, such as Jest/Jasmine, AVA, and Mocha, which is useful if you are porting from an existing code base.
Lastly, there is direct integration with Selenium Grid. This is vital if you plan on running larger suites of tests at scale and require a grid environment to manage parallel execution.
Run your Playwright tests with AWS marketplace directly on cloud.
Key features of the Playwright framework
Here are a few of the key features of Playwright and why you should check it out!
- Support for cross-browser platforms built on Chromium, WebKit, and Firefox – which includes Chrome, Edge, Firefox, Opera, and Safari.
- Support for cross-platform execution on Windows, Linux, and macOS.
- Support for cross-language, including JavaScript, TypeScript, Python, Java, and .NET – write tests in the environment that suits you while still covering all areas and formats.
- Auto-wait built-in, smart assertions that retry until the element is found, and test data tracing – keep track of logs, videos and screenshots easily.
- Built with modern architecture and no restrictions – interact with multi-page, multi-tab websites like a real user, and tackle frames and browser events with ease.
Run Automated Playwright Tests Online. Try LambdaTest Now!
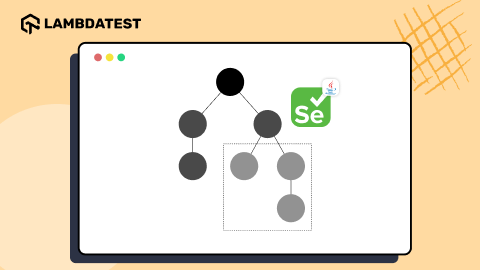
Architecture: Playwright framework
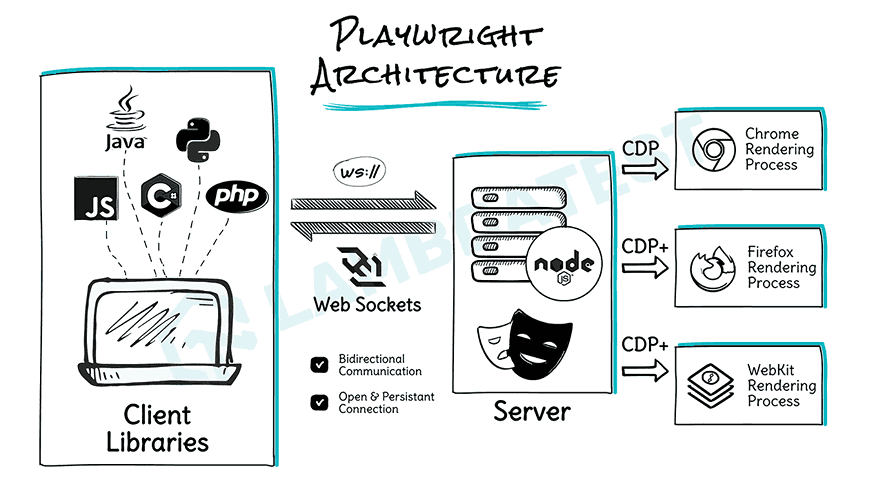
We’ve covered some of the reasons why Playwright is great to work with on a feature and implementation level, but what is going on internally? What makes the test execution more stable and faster to execute?
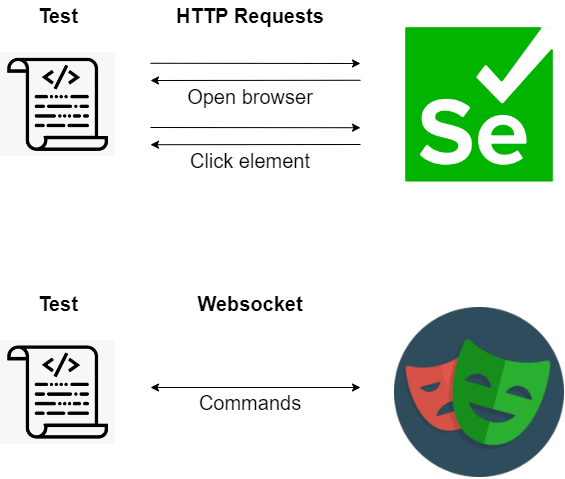
So a good way to understand this is to compare it with Selenium – Selenium sends each command as a separate HTTP request and receives JSON responses. So every interaction, such as opening the browser, clicking an element, or sending keys in Selenium, is sent as a separate HTTP request.
As you can imagine, this results in slower execution as we wait for responses and introduces a layer of potential flakiness.
Playwright, on the other hand, communicates all requests through a single WebSocket connection, which stays in place until test execution is completed. This reduces the points of failure and allows commands to be sent quickly on a single connection.
Getting started with the Playwright Tutorial
Let’s cover some of the basic prerequisites that are needed before we get deeper into installation and setup.
- Ensure you have NodeJS installed.
- Install a code editor. We will be using Visual Studio Code.
Creating your first Playwright project
I’m going to cover a full introduction in this Playwright tutorial, starting with the initial commands all the way up to having a fully functioning automation project. There are a few different ways we can install Playwright.
Watch this video to learn how to run multiple projects in Playwright and execute them on the LambdaTest platform.
Installing Playwright using the VS Code extension
Follow the below steps to install Playwright using the VS Code extension:
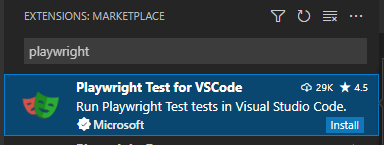
- Install VS Studio from the Visual Studio Marketplace.
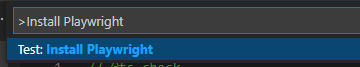
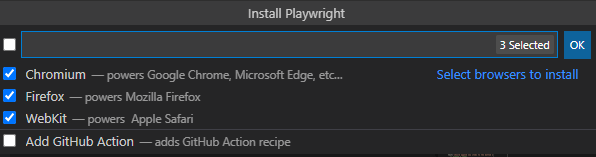
- Once this is installed, open the ‘Command palette’ under the ‘View’ tab, and type ‘install Playwright.’ Ensure you have created a folder for your project, which is currently open in VS Code, as this is where the new Playwright files will be generated.
- After selecting this, you’ll be presented with the following dropdown options, where you can choose which browsers to install. You can also add GitHub Actions, which will generate a YAML build file for you.
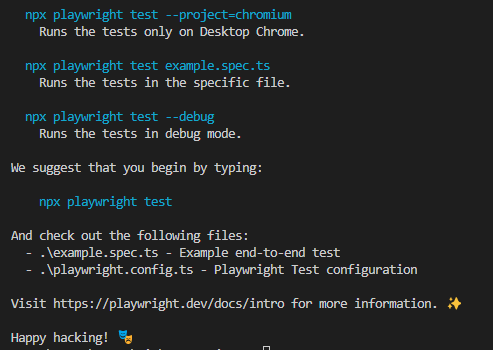
- When this is successfully installed, you should see the following message in the command line, which presents you with a few commands you can execute to get started:
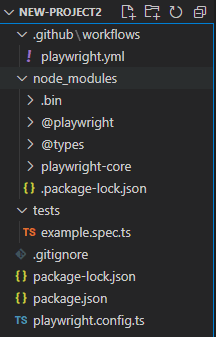
And you’ll have the project created that looks something like this:
Watch this video to learn more about setting up the Playwright test automation framework:
Installing the Playwright NPM package from the command line
This is fairly simple, and I’ll run through it step-by-step to explain what we are executing and what it is doing.
- Run this command to install Playwright.
The ‘new-project’ parameter is the folder that will be created, containing all your project files. This can be anything, so feel free to use a name that suits your project type.1npm init playwright@latest new-project
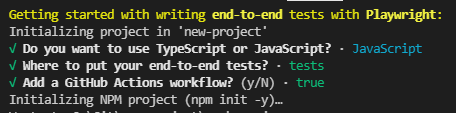
- Once this is executed, you will be presented with multiple prompts which outline how you would like to configure the project. These can be selected with the arrow keys or keyboard selections. Once you have selected all options, the project will be initialized.
- After following these steps, you’ll have a similar project structure as the VS Code extension workflow. The only difference is that the command line installation offers slightly more customization in choosing between JavaScript and TypeScript, and test folder location.
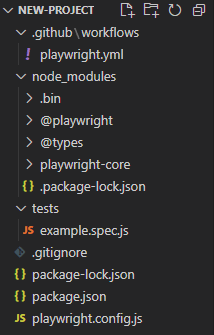
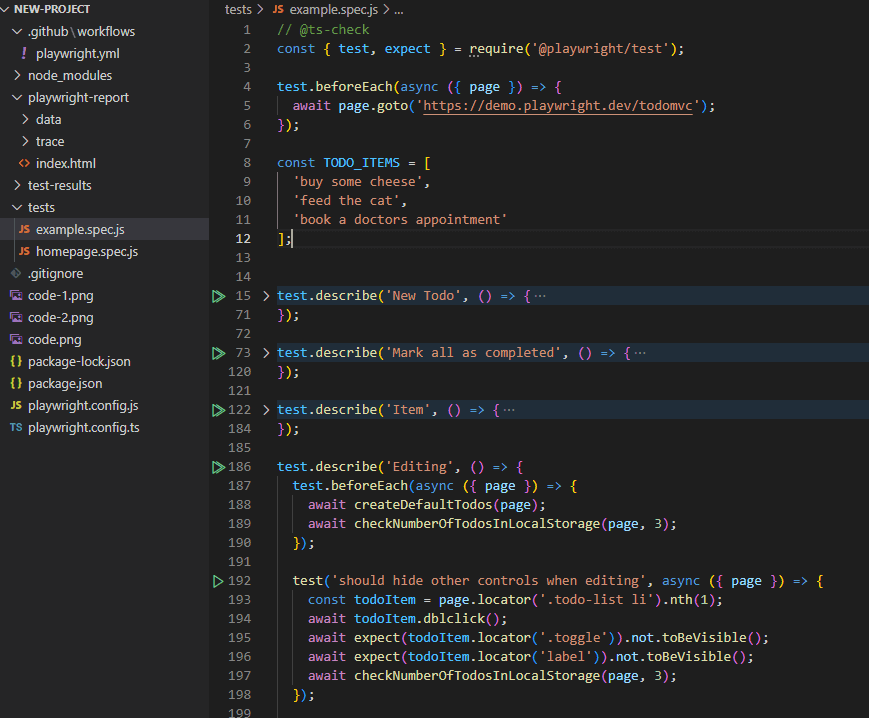
Some of the files and folder names may vary based on your selections during initialization, but here is a quick run-through of what we have.
- workflows/playwright.yml: This is the GitHub Actions workflow yaml file. It is what will build and execute your tests from the GitHub platform.
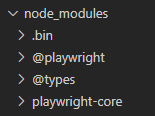
- node_modules: If you’ve worked with JavaScript before you’re probably very familiar with these, they are additional libraries which we can install in the project. In our case, you can see Playwright modules, which allow us to access additional functions from the Playwright library.
- tests/example.spec.js: This is the example spec file that is generated when initializing Playwright. There are 75 tests in total covering various different scenarios. This is ideal for understanding the syntax and general approach to writing tests.
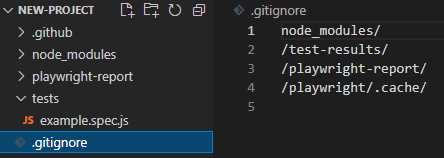
- .gitignore: This is a common Git file, which will exclude folders that we do not want to commit to our remote repository. They will be generated dynamically during the build and test execution.
- package-lock.json/package.json: The package.json file is generated during the initialization of the project and contains information regarding your project, entry points for test execution, custom scripts, and package dependencies. The package-lock.json plays a slightly different role. It tracks the exact version of every package installed. For more detailed information on why these files are important, refer to the official NPM package.json and package-lock.json docs.
- Playwright.config.js: This file contains all the configuration required for your Playwright project. You can configure timeouts, parallelism, retries, reporters, and browsers, just as a brief example! It is open to tons of customization and adjustment to meet your test suite’s requirements. You can find the full configuration docs here: https://playwright.dev/docs/test-configuration.
Now, for a quick run-through of what it’s actually doing – In simple terms, ‘on’ any code push or merged pull request to the main/master branch, a build will be triggered. This build will run on a ubuntu-latest agent, it will checkout your code, install node and your npm dependencies. Then it will install Playwright framework, begin test execution, and upload a test execution report at the end.
|
1 2 3 4 5 6 7 8 9 10 11 12 13 14 15 16 17 18 19 20 21 22 23 24 |
// @ts-check const { test, expect } = require('@playwright/test'); test.beforeEach(async ({ page }) => { await page.goto('https://demo.playwright.dev/todomvc'); }); const TODO_ITEMS = [ 'buy some cheese', 'feed the cat', 'book a doctors appointment' ]; test.describe('New Todo', () => { test('should allow me to add todo items', async ({ page }) => { // Create 1st todo. await page.locator('.new-todo').fill(TODO_ITEMS[0]); await page.locator('.new-todo').press('Enter'); // Make sure the list only has one todo item. await expect(page.locator('.view label')).toHaveText([ TODO_ITEMS[0] ]); |
Subscribe to the LambdaTest YouTube Channel and stay updated with the latest playwright tutorial also discover tutorials around topics like automated browser testing, Cypress E2E testing, mobile app testing, and more.
Running your first Playwright test
Let’s run some tests to make sure everything is working. Execute the following in the terminal:
|
1 |
npx playwright test |
This will run headless, so you should see activity in the terminal as tests are executed:
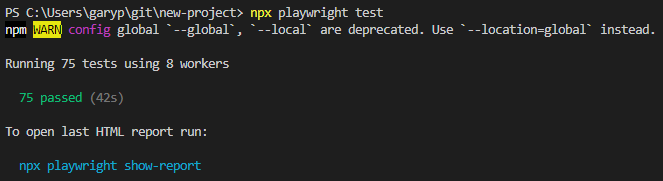
We have 75 passing tests, executed in 42 seconds. Good stuff!
If you want to look into the tests which were just run, you can open the example.spec.js. The test cases are marked by the syntax ‘test.describe’, and at the top of the file, you can see required packages, steps executed before each test, and some list data used within the tests.
Workers
There are a few things also to note – we have 8 workers being used. This means 8 different processes running in parallel to execute our tests. Refer to the Playwright’s official docs for more detailed information on parallelism and sharding.
By default, the number of workers being used will always be 8 (undefined), and when running in a CI environment, it will be 1. You can change these values in your playwright.config.js to run more or fewer tests in parallel, depending on your hardware capabilities. This is worth experimenting with in small increments to get a feel of what best suits your needs while maintaining a fast test execution time.

Reports
Another thing you may have noticed after your test execution is this snippet:
|
1 2 3 |
//To open last HTML report run: npx playwright show-report |
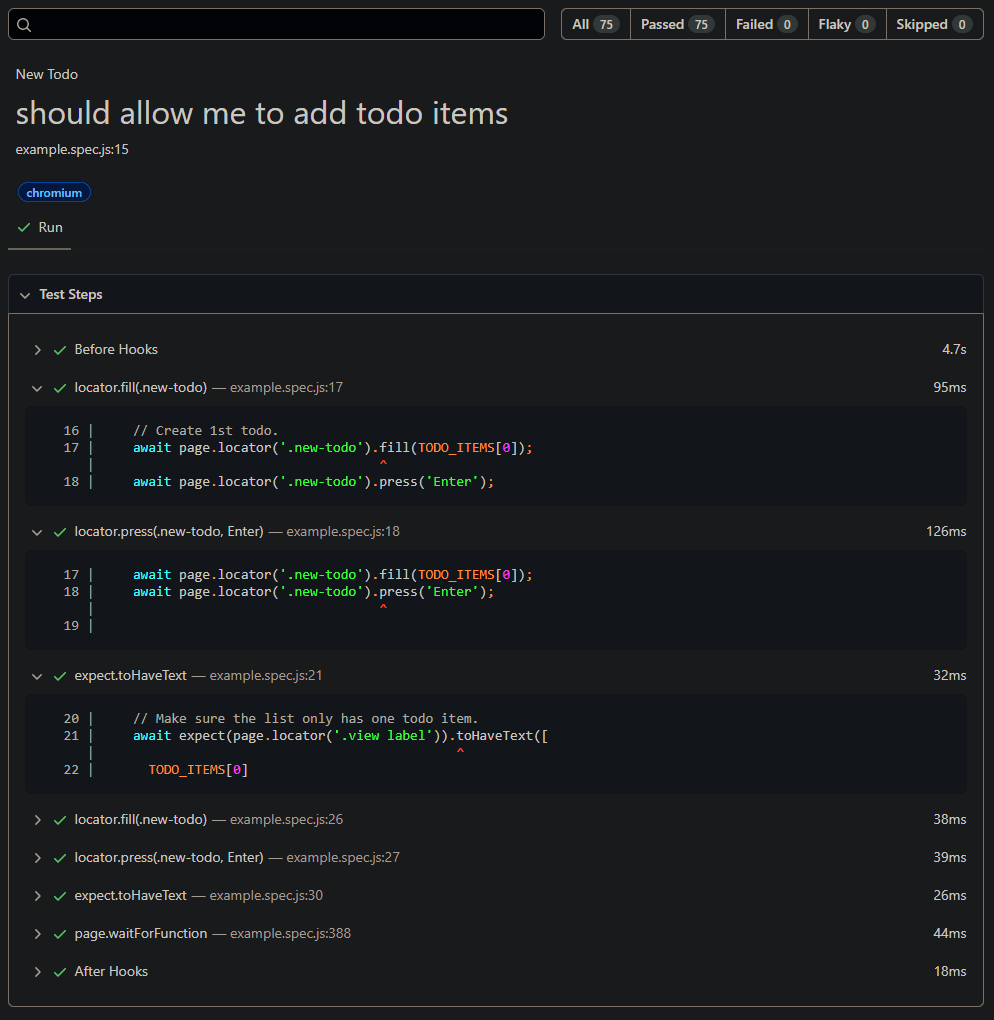
If you execute that command, a browser window will launch on localhost, which looks something like this:

It gives you a nice report of your most recent test execution, with information regarding test outcomes, test cases, browsers executed on and test execution times.
Run your Playwright test scripts instantly on 50+ browser and OS combinations. Try LambdaTest Now!
Creating a basic Playwright test
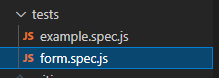
Now that we’ve executed some basic tests let’s try adding some of our own! Add a file to your tests folder called ‘form.spec.js’
We need to add a line to the start of the file to access the Playwright module and test functions. From there, we define our test case ‘input form data’.
We are creating an instance of ‘page’ to access the most common Playwright methods. The first one we will be using is ‘goto’, which will navigate us to the defining url.
|
1 2 3 4 5 |
const { test } = require('@playwright/test'); test('input form data', async ({ page }) => { await page.goto('https://www.lambdatest.com/selenium-playground/input-form-demo'); }); |
In the terminal, navigate to the tests folder and execute the below command.
|
1 |
npx playwright test form.spec.js |
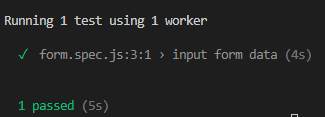
The output should look something like this:
Now we know that our new test can execute successfully, let’s add a bit more complexity and an assertion, to ensure our test will catch actual issues.
This is what the page looks like on LambdaTest’s Selenium Playground:
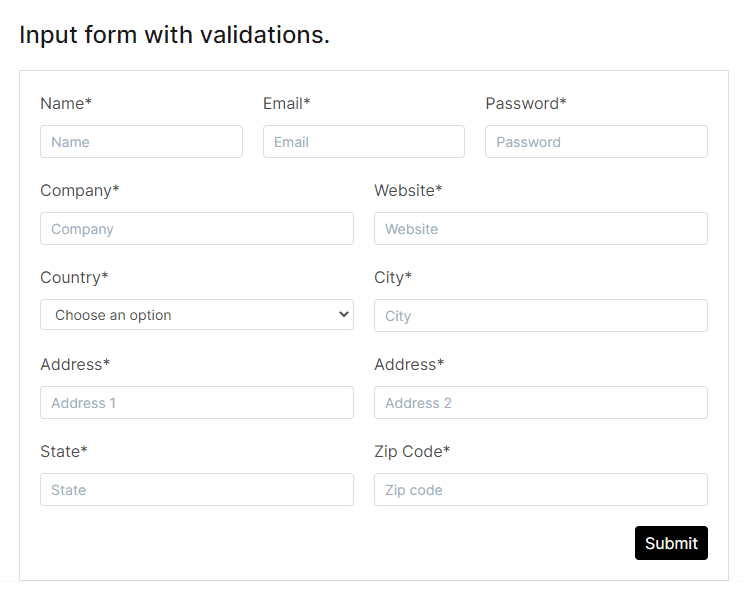
We are going to enter data into all of the fields. The code will look something like this:
|
1 2 3 4 5 6 7 8 9 10 11 12 |
await page.locator('[placeholder="Name"]').fill('Mr Test'); await page.locator('[placeholder="Email"]').fill('randomemail@test.com'); await page.locator('[placeholder="Password"]').fill('Abc123'); await page.locator('[placeholder="Company"]').fill('Fake company'); await page.locator('[placeholder="Website"]').fill('Fake website'); await page.locator('select[name="country"]').selectOption('GB'); await page.locator('[placeholder="City"]').fill('London'); await page.locator('[placeholder="Address 1"]').fill('123 New road'); await page.locator('[placeholder="Address 2"]').fill('New street'); await page.locator('[placeholder="State"]').fill('New state'); await page.locator('[placeholder="Zip code"]').fill('abc123'); await page.locator('button:has-text("Submit")').click(); |
As you can see, we are using the page.locator method, followed by the element locator, and we are using this to fill the empty fields and click the submit button.
If we execute this test as it is, it will still pass. We need an assertion of some kind to verify the success criteria of the test, which will fail if it is not met.
Following submission of the form, the following page is displayed with a confirmation message:
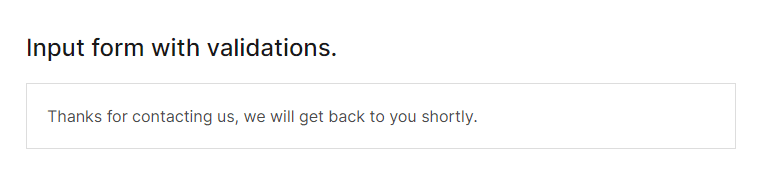
We will assert that the confirmation message element is visible to the user, with the following code:
|
1 2 |
const locator = page.locator('text=Thanks for contacting us, we will get back to you shortly.'); await expect(locator).toBeVisible(); |
You can execute this test, and we will once again see it passes successfully. Let’s change the assertion to something different and make sure it’s a valid test.
|
1 2 |
const locator = page.locator('text=Welcome back'); await expect(locator).toBeVisible(); |
As we can see after running this test again, it is now failing at line 20, where the expected locator is not displayed:
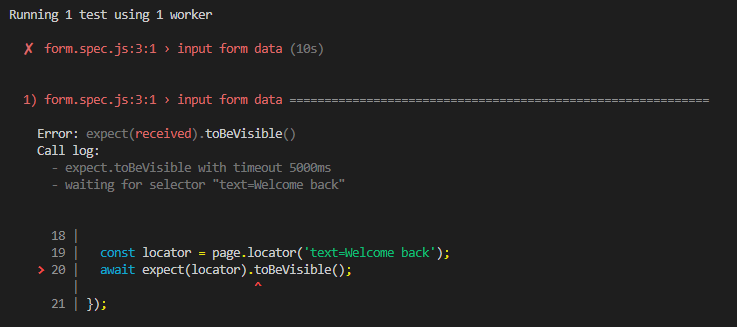
This terminal logging is very helpful for quickly finding out where and why the test is failing. Let’s revert the change and run the full test.
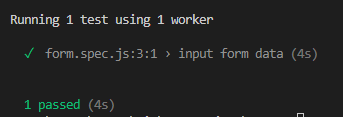
Nice! Full form submission and an assertion in 4 seconds.
Let’s run the same test across 3 different browsers and take a look at the report. Add –browser=all to the end of your command in the terminal.
|
1 |
npx playwright test form.spec.js --browser=all |
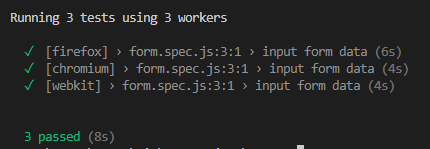
And if we use the command we learned earlier, we can view the html report:
|
1 |
npx playwright show-report |
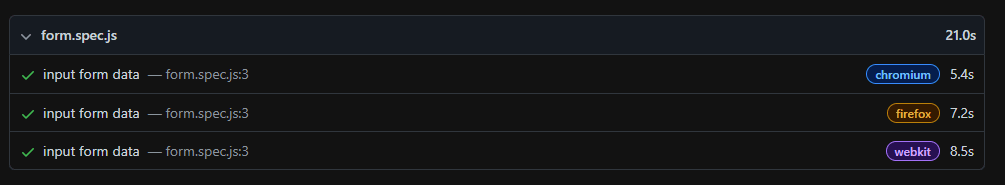
In this article of the Playwright tutorial series, we have seen how to set up the Playwright framework for the end-to-end test automation. So far, we have learned how to execute a simple test using the Playwright test automation framework.
Though Playwright comes with a lot of features to leverage, its true potential can be evaluated only over a cloud-based grid. In the upcoming blogs of this Playwright tutorial series, we will learn to run Playwright tests on a cloud grid like LambdaTest.
Cloud testing platforms like LambdaTest allow you to perform cross browser testing on an online browser farm of 50+ browsers and browser versions of Chrome, Chromium, Microsoft Edge, Mozilla Firefox, and even Webkit. You can even run your Playwright test scripts in parallel and cut down your test execution time by multiple folds.
Watch this video to learn more about handle user inputs, buttons, checkboxes, and other UI elements in Playwright with the help of live examples:
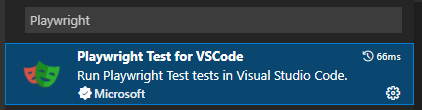
VS Code extensions for Playwright
Now, before we wrap up, I’d like to run through some of the awesome functionality you get from installing the Playwright test extension in VS Code. As a reminder, you can find that here, after opening the extensions tab:
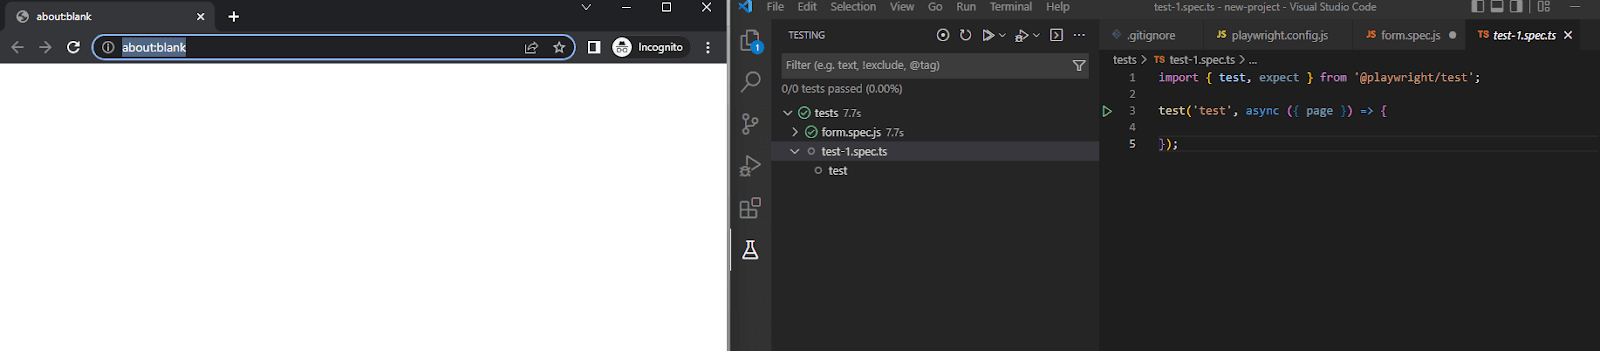
Now, you’ll notice we have a Testing icon on the lower left of the screenshot below:
![]()
From here, we can see all the tests in the project. Not only that, but it also opens up some very nicely integrated functionality for us to use:
- Test Execution
We can execute tests by selecting the ‘Run test’ icon, and as the test progresses, the line of code being executed is highlighted.
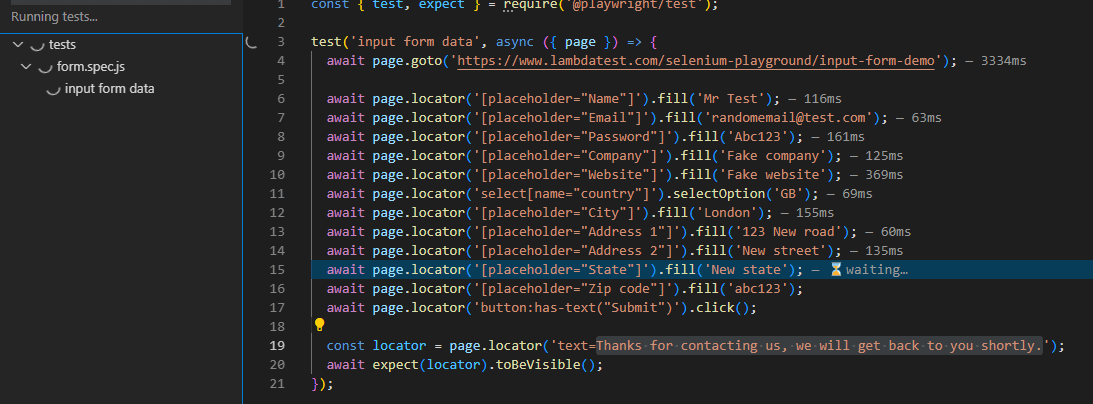
In addition to that, you will also notice at the end of each line is the execution time in milliseconds. I personally love this kind of data, as it allows you to tweak and optimize your code based on the information you can easily access. - Debug Tests
If we set a breakpoint in our test by selecting to the left of the line numbers and run the test in debug mode, the test execution will stop at this point. - Real-Time Code Editing
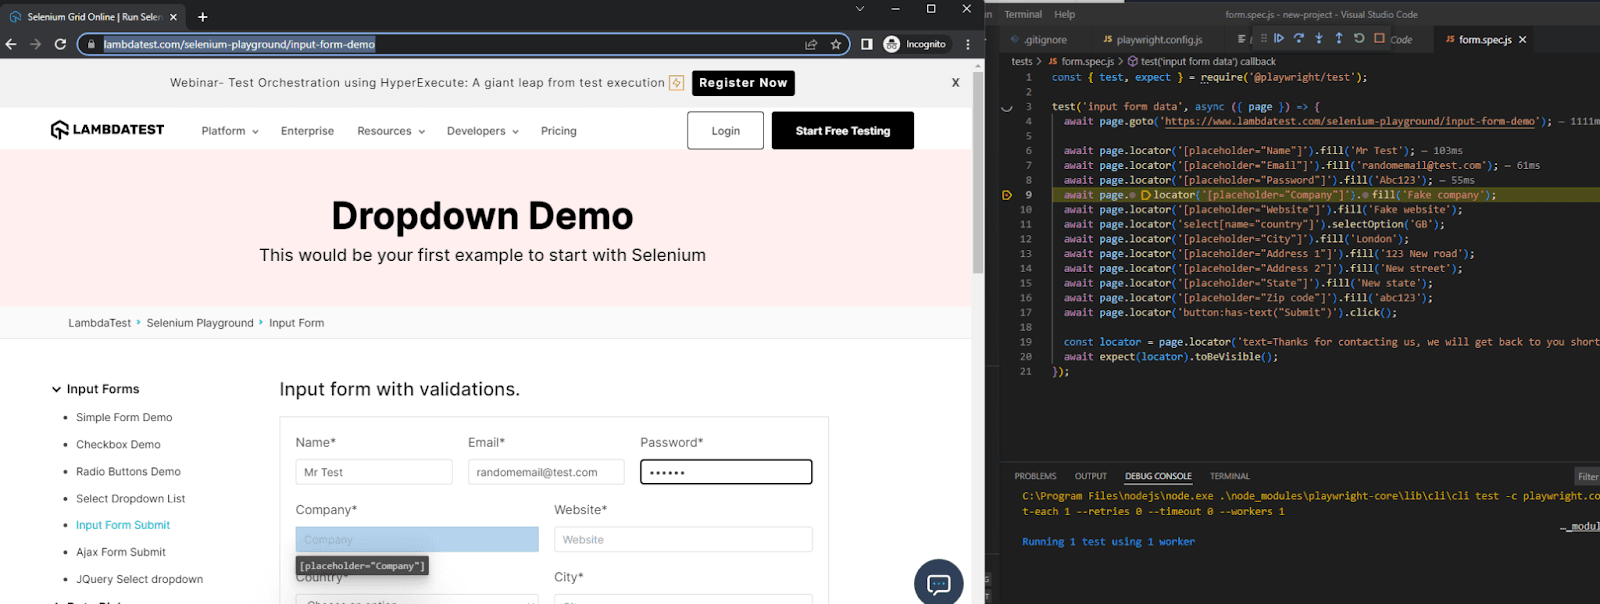
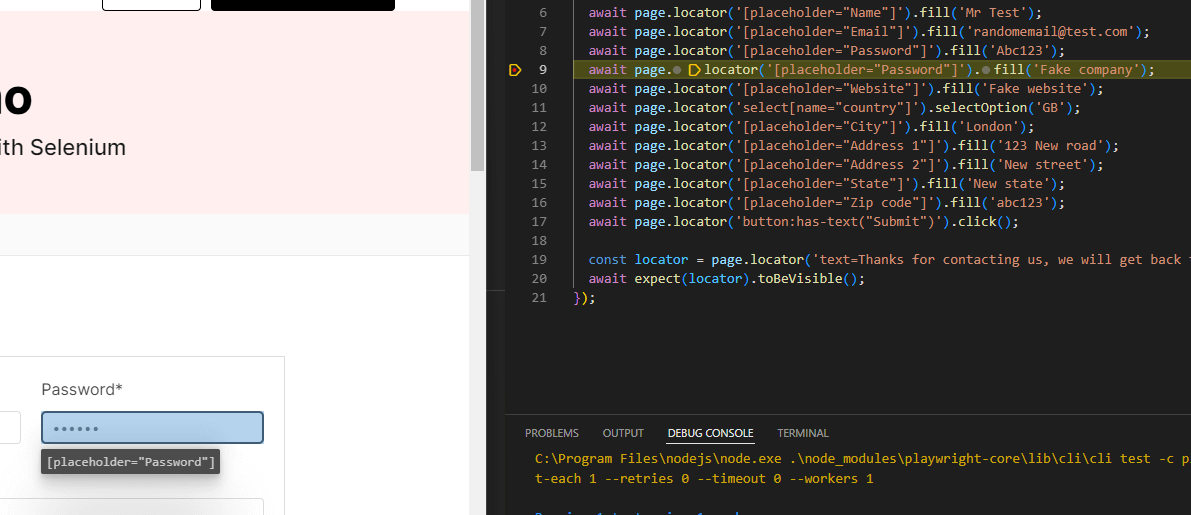
Now, here is an additional feature I find amazing, mostly due to how it’s embedded in the test execution. We can edit the element in the code in real-time, and it will update in the browser window. For example, I’ve changed the locator from ‘Company’ to ‘Password,’ and we can see it’s moved the highlighted locator: - Record
Lastly is the ‘Record’ option. This behaves similar to ‘codegen,’ which we experimented with earlier in this blog. When you select ‘Record,’ a window will be launched, and a spec file will be generated:
In this example, I’ve set a breakpoint at the company field, so we can pause here and see exactly what the test is doing.
On a side note, to make your life of testing easy and fuss-free while debugging, you can try the LT Debug Chrome extension.
As we start to navigate and interact with the page, code will be generated in real-time:
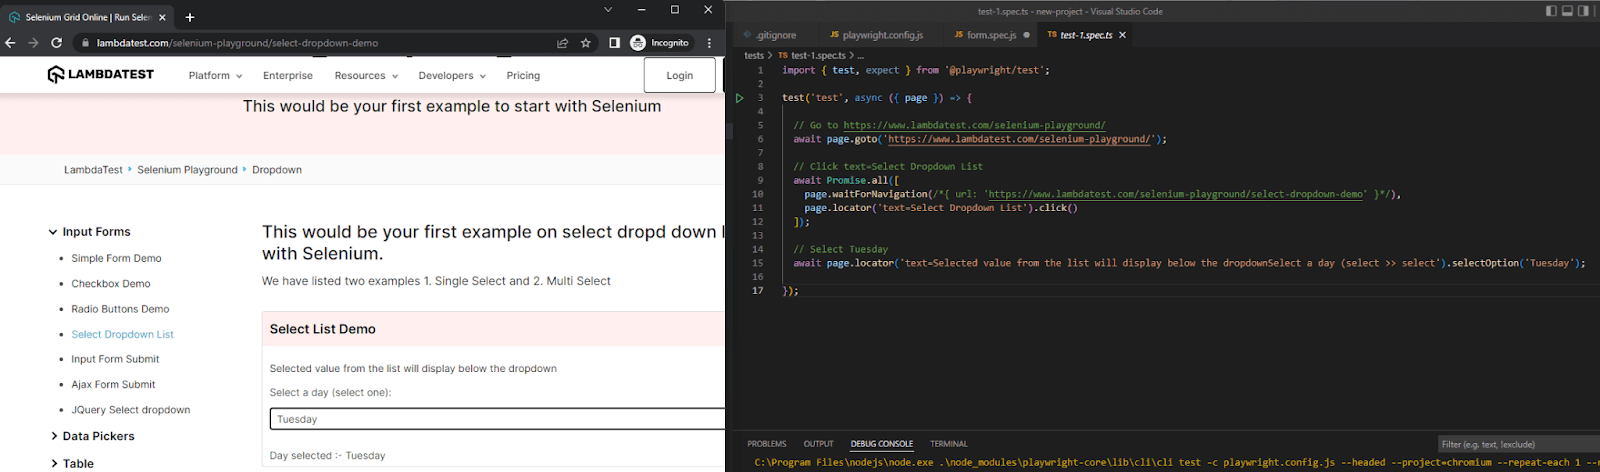
As mentioned previously, this is great for quickly structuring a test or training more junior members of your team, they can piece together how interactions with the page align with the written code.
Watch this video to learn about some exciting features offered by Playwright, like recording tests, taking screenshots of tests, auto-wait mechanism, and much more.
Conclusion
Playwright is an incredibly versatile framework with features that are just plain enjoyable to use, which is something special when put side-by-side with other frameworks in the industry, which can sometimes be more of a chore.
It makes writing automation tests very simple, and you’ll be building up large suites of tests in a fraction of the time you would with others. Also, the entry bar is kept low, so it won’t be intimidating if you introduce it to a new team.
I hope you gained some insight from this Playwright tutorial, and may it be top of your favorite automation frameworks to use in the future.
Frequently Asked Questions (FAQs)
Is Playwright better than selenium?
Selenium has been around since the start of the web and has a vast range of browser support. Playwright is an up-and-comer. Playwright, however, supports all major browsers, and I don’t think that if something works in the browsers it supports, it would be an issue in others.
Is Playwright similar to selenium?
Playwright and selenium seem to be comparable in the browser testing space. Playwright has 39.3K GitHub stars and 1.8K GitHub forks. Selenium, which was created a lot earlier than Playwright, has 23.9K GitHub stars and 7K GitHub forks. It looks like Selenium has more adoption than Playwright.
Does playwright have a UI?
Playwright launches headless browsers by default. They do not display a browser GUI. Instead, you will have to run your scripts via the command line. However, you can configure Playwright to launch full web driver browsers.


Author’s Profile
Gary Parker
Currently working as a Senior QA Architect, responsible for QA Architecture, tooling, frameworks and processes. Specializing in front-end web and mobile technologies. With almost 10 years of experience in the QA industry across many different domains, products, and environments. I enjoy writing technical blogs as a way to keep myself up-to-date with the industry and ensure a deeper understanding of the topics at hand.
Blogs: 2
Got Questions? Drop them on LambdaTest Community. Visit now