Unleashing Cypress Performance Testing using Lighthouse
Narayanan Palani
Posted On: August 13, 2021
![]() 57620 Views
57620 Views
![]() 11 Min Read
11 Min Read
“Your most unhappy customers are your greatest source of learning.”
Bill Gates
Since the time the pandemic struck the world, mobile applications and websites have become the go-to source for fulfilling all the major requirements (e.g., grocery shopping, bill payments, etc.). It would be catastrophic if the website or app takes ages to load:( In such cases, tables might turn against you, and your customers might jump ship to embrace your competitors’ services!
As performance and user experience go hand-in-hand, it is imperative to consider web performance testing on high priority. Google Lighthouse is one of the widely used tools for realizing client-side performance testing. Like me, if you are also an ardent user of the Cypress automation testing, you might know that you can run Lighthouse audits from your Cypress tests.
In this blog Cypress Tutorial, I deep dive into how you can leverage the potential of Cypress and Google Lighthouse for web performance testing.
Starting your journey with Cypress Testing? Check out how you can test your Cypress test scripts on LambdaTest’s online cloud.
Before we get started with Cypress performance testing using Lighthouse, let’s look at the ‘what’ and ‘why’ of performance tests.
What are performance metrics KPIs for websites
The standard load time of any NodeJS-based web application is 2 seconds which also includes loading of interactive content present on the website. Needless to mention that you need to fix it in case the load time exceeds more than 2 seconds! The story is not over yet!
Even when the page loads the content, the entire page should get loaded in not more than 3 seconds.
The Lighthouse plugin from Google Chrome is one of the powerful tools to get a performance score similar to the performance tab of Chrome Dev Tools. In addition, Lighthouse CLI can also be used for performing audits right from the command line! Though there are six performance metrics in Lighthouse 6.0, FCP (First Contentful Paint) and Time to Interactive (TTI) are the major ones that should be considered as a top priority.
Here are the ideal values for the important Lighthouse performance metrics that should be considered for websites (or web applications):
|
Metrics Type |
Best Score/Minimum Standards |
Location of the tool |
|
Performance Metrics Score |
95 percent |
Lighthouse plugin (from Google Chrome → More Tools → Developer Tools) |
|
First Contentful Paint |
Maximum 1-2 seconds |
|
|
Time to Interactive |
Maximum 2-3 seconds |
For more accurate results, it is recommended to disable cache from the network tab (inside Developer Tools of Google Chrome). Post that, you should retry to get the metrics from Google Lighthouse. Lighthouse v6 is available from Google Chrome v84 onwards. Since Lighthouse is available as a plugin for Cypress, it is recommended to use Cypress and Google Lighthouse combination for web performance testing.
Scripting is a key metric calculated to determine how fast the web pages are getting loaded for the end-user. On similar lines, rendering and painting give the CSS load time depending on the type and category of React apps.

What is Cypress?
For starters, Cypress is a JavaScript-based front-end testing tool that is primarily suited for testing modern web applications. Unlike other test automation frameworks like Selenium, Cypress operates directly inside the web browser and comes with a unique DOM manipulation technique. Check out our Cypress vs Selenium comparison if you want to check out the best of both the test automation frameworks.
Getting started with Cypress is easy in case you are coming from a JavaScript background. Cypress is one of the few test automation frameworks ideal for E2E (End-to-End) testing, integration testing, unit testing, and more.
Check out the video from the LambdaTest YouTube channel that deep dives into how to get started with Cypress automation testing:
QA engineers prefer Cypress automation testing since there are minimal chances of witnessing flakiness in Cypress tests. Recently, Cypress has come up with a retry mechanism in which you can set the retry value as 2 in cypress.json to get the same test retried twice if it had earlier failed due to issues like delayed load time.
Getting performance metrics for each page based on its load time can be extremely time-consuming if the project has close to 40 to 200 web pages. The number of pages depends on the user journey. Now that we have covered the essentials of What is Cypress, let’s look at how to implement web performance testing to automate those web pages using Cypress and Google Lighthouse in Jenkins.
The cypress-audit plugin is used for Cypress performance testing since it integrates Lighthouse into the Cypress tests.
Get the best out of your Cypress tests with LambdaTest’s online Cypress automation tool. Check out how you can test your Cypress test scripts using LambdaTest’s online cloud.
How to use cypress-audit plugin for Cypress performance testing
Before installing the cypress-audit plugin, you need to make sure that you have Cypress installed on your machine. If not, please follow the below-mentioned steps for setting up the Cypress framework:
- npm install
- npm link
- npm link cypress-cucumber-preprocessor
- npm install through
Now that Cypress is installed on your machine, it’s time to install the cypress-audit plugin for taking the first step towards web performance testing.
|
1 |
npm install --save-dev cypress-audit |
Yarn users can install cypress-audit by triggering the following command on the terminal:
yarn add -D cypress-audit
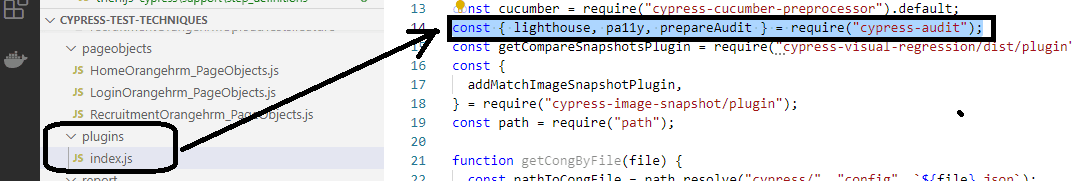
Add the following constant in index.js that is present inside the plugins folder:
|
1 |
const { lighthouse, pa11y, prepareAudit } = require("cypress-audit"); |
After updating index.js, the next step is to write the feature file for verifying the web audit results, including the performance metrics pertaining to your area of interest. Our test scenario involves logging on to the OrangeHRM website and checking the web audit results once successfully logged in.
|
1 2 3 4 5 6 7 8 |
Feature: Login Page Verification on OrangeHRM website Scenario: check web page health through lighthouse audit and pa11y audit on valid login page display with login fields Given I open OrangeHRM homepage Then I should see title "OrangeHRM" Then I should see "LOGIN Panel" text displayed And I should see "Alternative Login" text displayed And I should see web audit results |
Now that we have the feature file ready, we write the step definition in a shared js file for common usage across the framework as below:
|
1 2 3 |
Then('I should see web audit results', function () { cy.lighthouse(); }) |
Now that the test is partially ready, we can measure the website’s performance against the standards we are interested in. For example, when using Cypress and Google Lighthouse, it is required to set the test threshold based on which the tests would be declared pass/fail.
Watch this video to learn how Cypress can be used to automate accessibility testing.
Setting Thresholds For Cypress Performance Testing
Thresholds for performance testing using Cypress and Google Lighthouse can be set in two different ways. The first option is by adding the threshold within the step definition file.
Adding Threshold in step definition file
|
1 2 3 4 5 6 7 8 9 10 |
Then('I should see web audit results', function () { cy.lighthouse({ performance: 95, accessibility: 100, "best-practices": 95, seo: 85, pwa: 100, } ); }) |
Now that the thresholds are set, it’s time to run the tests. Since the tests are using Cypress installed on the local machine, trigger the following command on the terminal to run the Cypress test:
npx cypress open
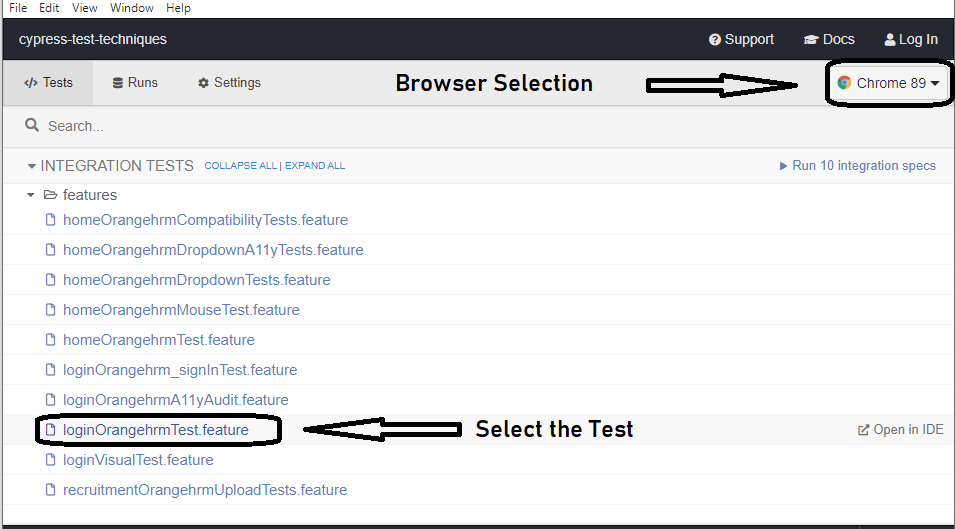
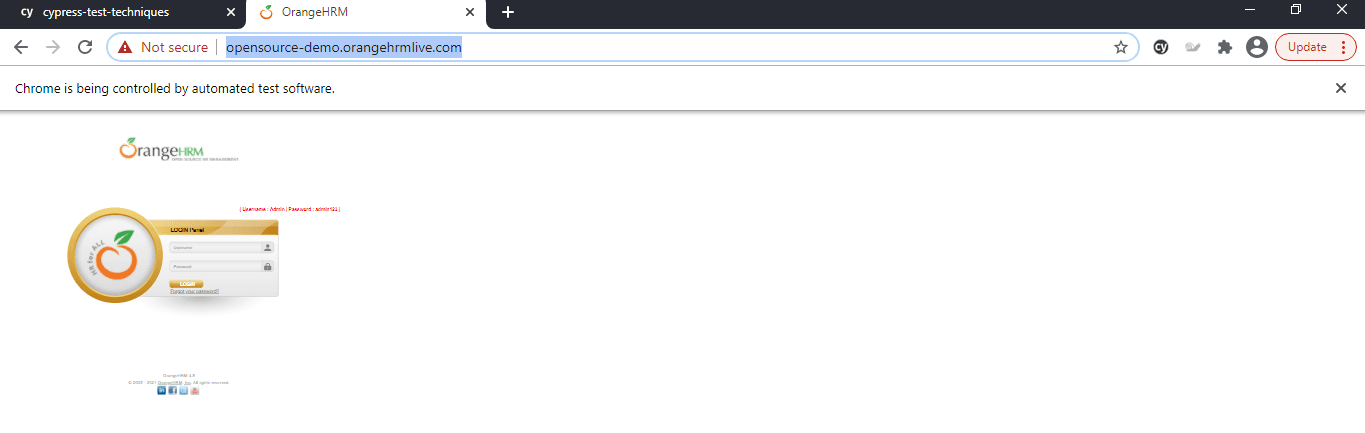
Choose the right browser and launch the test on the corresponding browser:
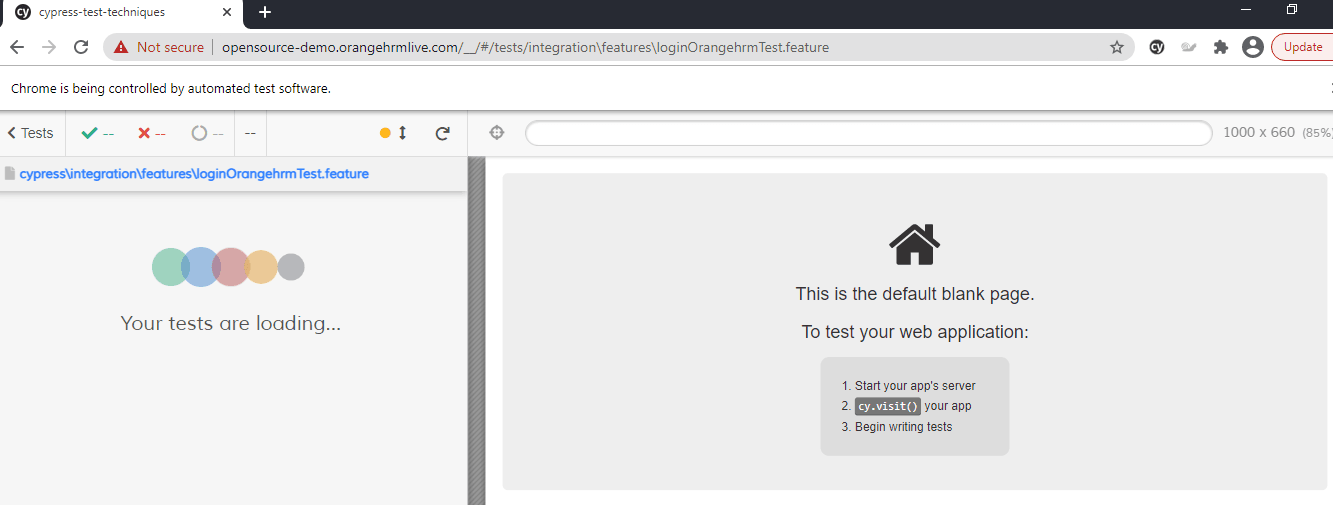
Here is the snapshot that indicates the progress of the test execution:
On a different note, I was running the same site in a different open-source tool to check the speed of the webpage, and the automation tool itself timed out, waiting for the page to load most of the time. As a laugh or cry moment, I dropped the plan of continuing the script in that tool 🙂
A major benefit of Cypress automation testing is that it provides an interactive playback on each step and provides options to pause & re-run the test at any moment in time.
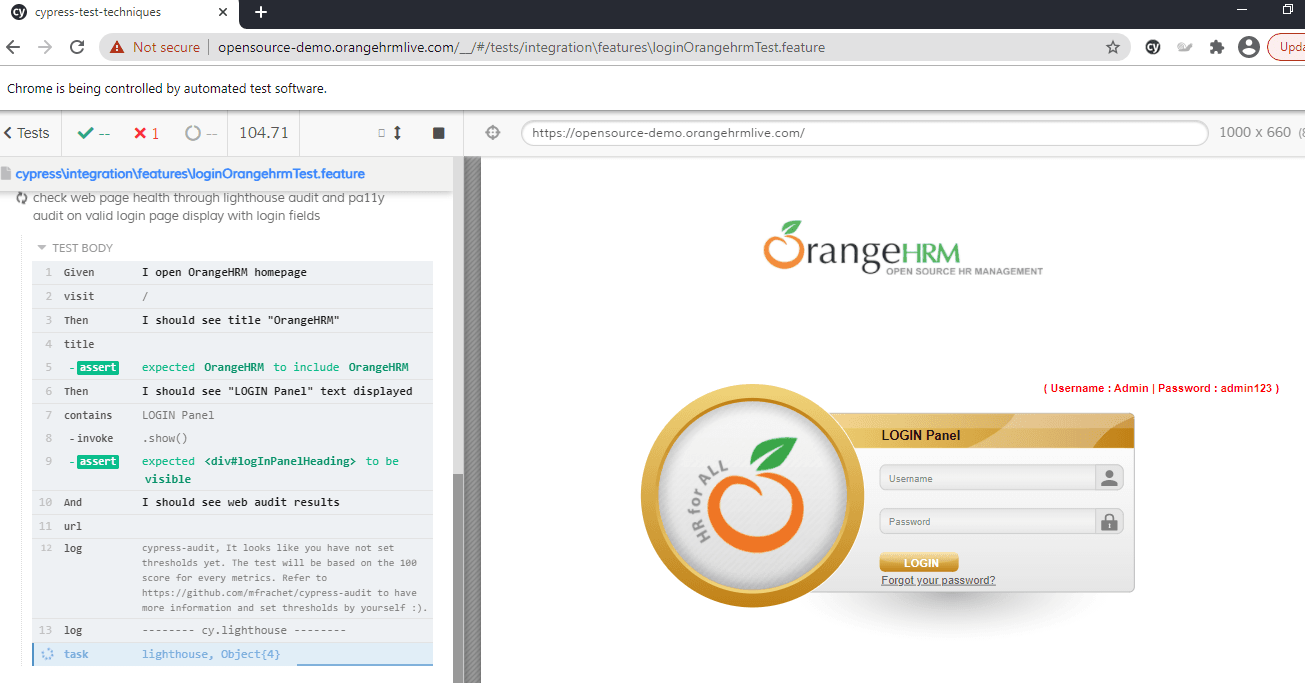
When Cypress runs the tests for cy.lighthouse command, it loads the same page in a new tab of the browser for collecting the required metrics.
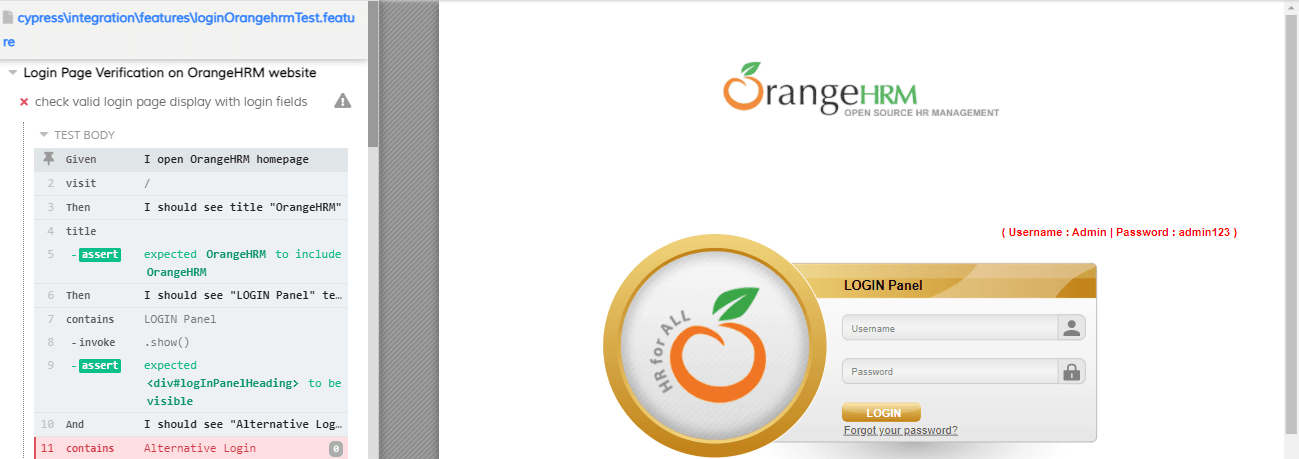
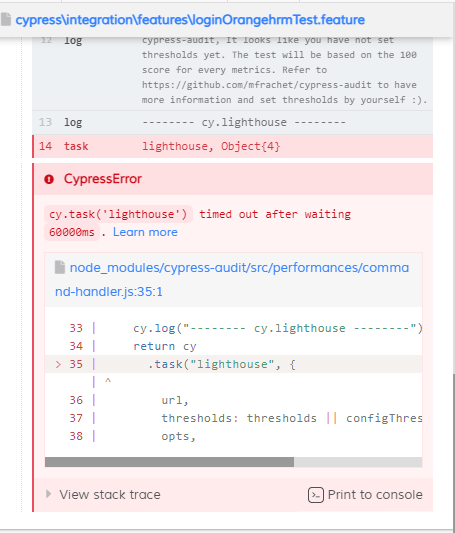
Note that I have not used any thresholds inside my cy.lighthouse command; hence the tests show a log indicating that it is appropriate to add thresholds and rerun the tests:
In few milliseconds, my tests failed due to the same reason of not having a threshold to my test:
This is where we can switch to the other option for adding the required thresholds.
Adding Threshold in a constant
In this option, we add the thresholds in a constant and call the same inside the requisite step definitions.
|
1 2 3 4 5 6 7 8 9 10 11 |
const lighthousemetrics = { performance: 95, accessibility: 100, "best-practices": 95, seo: 85, pwa: 100, }; Then('I should see web audit results', function () { cy.lighthouse(lighthousemetrics); }) |
The cypress-audit plugin will run the tests based on the score of 100 for every metric, and the options highlighted in this section helps in adjusting the metrics as per the specific requirements. We have run the tests on Cypress that is installed on my local machine, but the approach might pose scalability challenges.
Cypress testing on cloud like LambdaTest lets you perform Cypress automation testing on a range of browser and OS combinations at an expedited pace. It is the best way to leverage the benefits offered by cloud testing.
Now Run your free Cypress parallel testing online.
Test Execution using Lighthouse Threshold
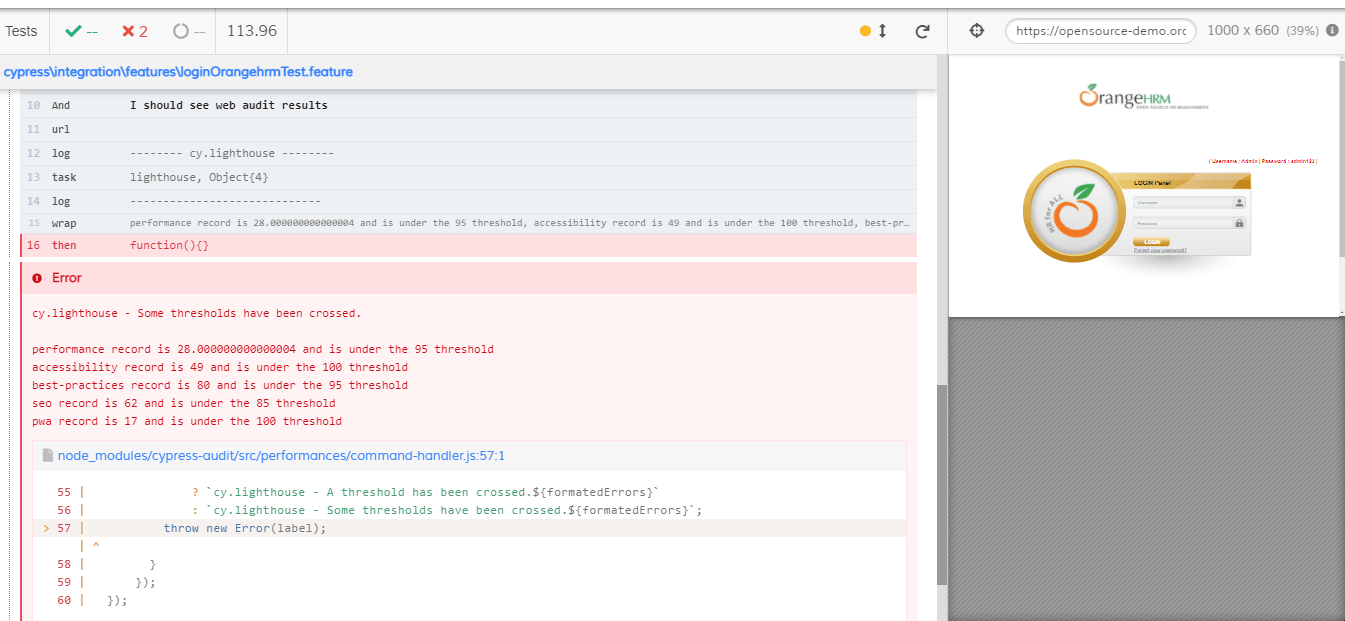
When rerunning the tests through the ‘npx cypress open’ command, it shows the metrics after loading the page in a new tab that immediately closes after the metrics are shown. However, it shows the path of the code and the specific location in the code that has failed due to poor performance.
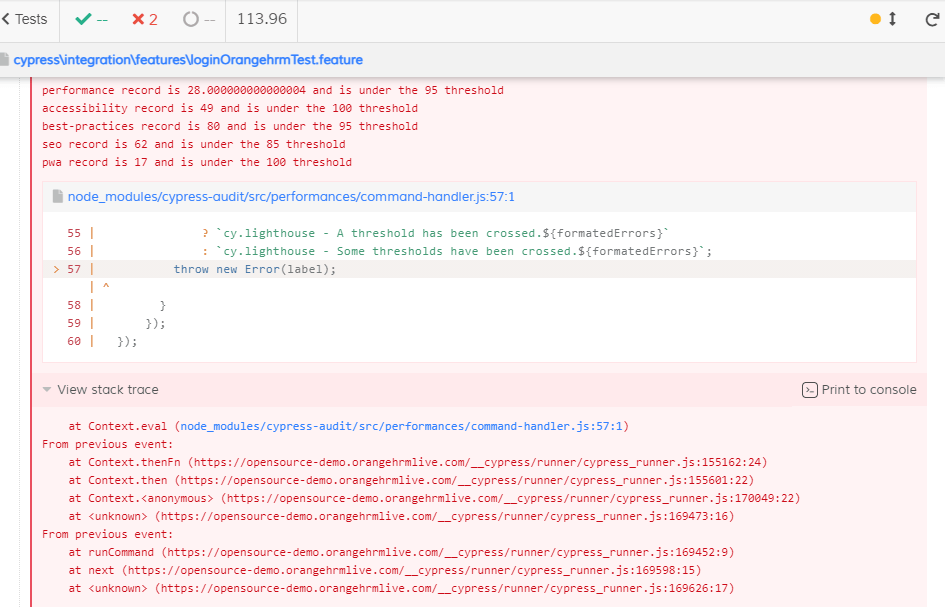
I was more interested in checking how Cypress evaluates the metrics on any web page in a more dynamic manner. This will also give a clear indication of the components involved in generating the required metrics.
This is possible through the ‘view trace’ option that displays the metrics of the stack trace:
When running performance metrics tests using cypress-audit based Lighthouse, it is possible to get timeouts during the test run. Hence, it is recommended to adjust the retry configuration in cypress.json while running performance tests using Cypress and Google Lighthouse.
On encountering a timeout, test execution is retried if the test has failed the first time. Alternatively, it is advisable to install the latest Cypress version, such as v7 to run the tests.
Take this certification to showcase your expertise with end-to-end testing using Cypress automation framework and stay one step ahead.
Here’s a short glimpse of the Cypress 101 certification from LambdaTest:
Cypress-Lighthouse – Alternate Plugin for Cypress Performance Testing
Cypress comes with a best-in-class plugin called cypress-lighthouse that adds the cy.lighthouse command for auditing the website against lighthouse performance metrics.
Cypress Lighthouse plugin can be installed by triggering the following command on the terminal:
|
1 |
npm install cypress-lighthouse |
Add the following lines in command.js to use the Lighthouse plugin for performance testing with Cypress.
|
1 |
import 'cypress-lighthouse'; |
Use the commands such as .lighthouse to verify your results.
|
1 |
cy.lighthouse(‘https://www.orangehrm.com/’).as('results') |
Starting your journey with Cypress End-to-End Testing? Check out how you can test your Cypress test scripts on LambdaTest’s online cloud.
Conclusion
Improving the website performance is extremely important for meeting the core web vitals. Cypress and Google Lighthouse are an ideal combination for running performance tests on modern websites (or web applications). Lighthouse plugins on Cypress make it easy to perform Cypress performance testing by adding a couple of changes to the existing codebase.
A well-optimized website eventually helps build an everlasting user experience and positively impacts search engine rankings. So, if you are a user of the Cypress framework, it’s time you leverage the benefits of Cypress and Google Lighthouse for building a top-performing website (or web application).
Happy Optimization!


Author’s Profile
Narayanan Palani
Chief QA to major financial institution by leading 100+ engineers, best selling author of four parts book series 'Software Automation Testing Secrets Revealed' and receiver of 'Exceptional Talent of UK' endorsement from TechCity UK and first few to get 'Tier 1 Exceptional Talent' work permit in the United Kingdom. He has trained more than 35K students worldwide through Career Development Programs and he is also an official title winner of 'European Testing Awards' on 'Best Test Manager' category.
Blogs: 2
Got Questions? Drop them on LambdaTest Community. Visit now