View Lighthouse Performance Metrics Using Playwright
LambdaTest now integrates Lighthouse to view the performance metrics (Lighthouse Audits) while running Playwright tests on the LambdaTest cloud. You can now view the scores of:
- Performance,
- Accessibility,
- Best Practices,
- SEO
- Progressive Web App
metrics with the help of LambdaTest.
The code sample for generating the Lighthouse Performance Metrics in the Playwright test can be found on LambdaTest's GitHub Repository. You can either download or clone the repository to quickly run your tests.  View on GitHub
Prerequisites
You will need a LambdaTest account to run your Playwright tests. Use your:
- LambdaTest Username
- LambdaTest Access Key
to run your tests on LambdaTest and view the Lighthouse Performance Metrics. You can obtain these credentials from the LambdaTest Automation Dashboard or through LambdaTest Profile.
How to Include Lighthouse Performance Metrics in Playwright Automation?
You can easily add the Lighthouse Performance Metrics of the website you want to test by executing the lighthouseReport action via the test.
As of now, LambdaTest supports Lighthouse on Chrome, MicrosoftEdge and Chromium browsers.
Following is the code snippet for generating Lighthouse report from the Playwright if you are using JavaScript:
await page.evaluate(_ => {}, `lambdatest_action: ${JSON.stringify({
  action: 'lighthouseReport',
  arguments: { url: 'https://www.example.com' }
})}`)
Note: Generating lighthouse report within the test might increase the test duration. It is advisable to generate the lighthouse reports only in the required tests.
How to View Lighthouse Performance Metrics on LambdaTest?
Once you have run your Playwright automation tests on LambdaTest platform, you can view the Lighthouse Performance Metrics on the website under test.
Follow the below steps to view the Lighthouse Performance Metrics on LambdaTest platform:
1. Go to the Automation Dashboard. Here you can see your recently executed Playwright automation tests. For this demo purpose, we have used a sample Playwright JS script, from this GitHub repository.
2. Open the test where you executed the lighthouse command and click on the Performance tab.
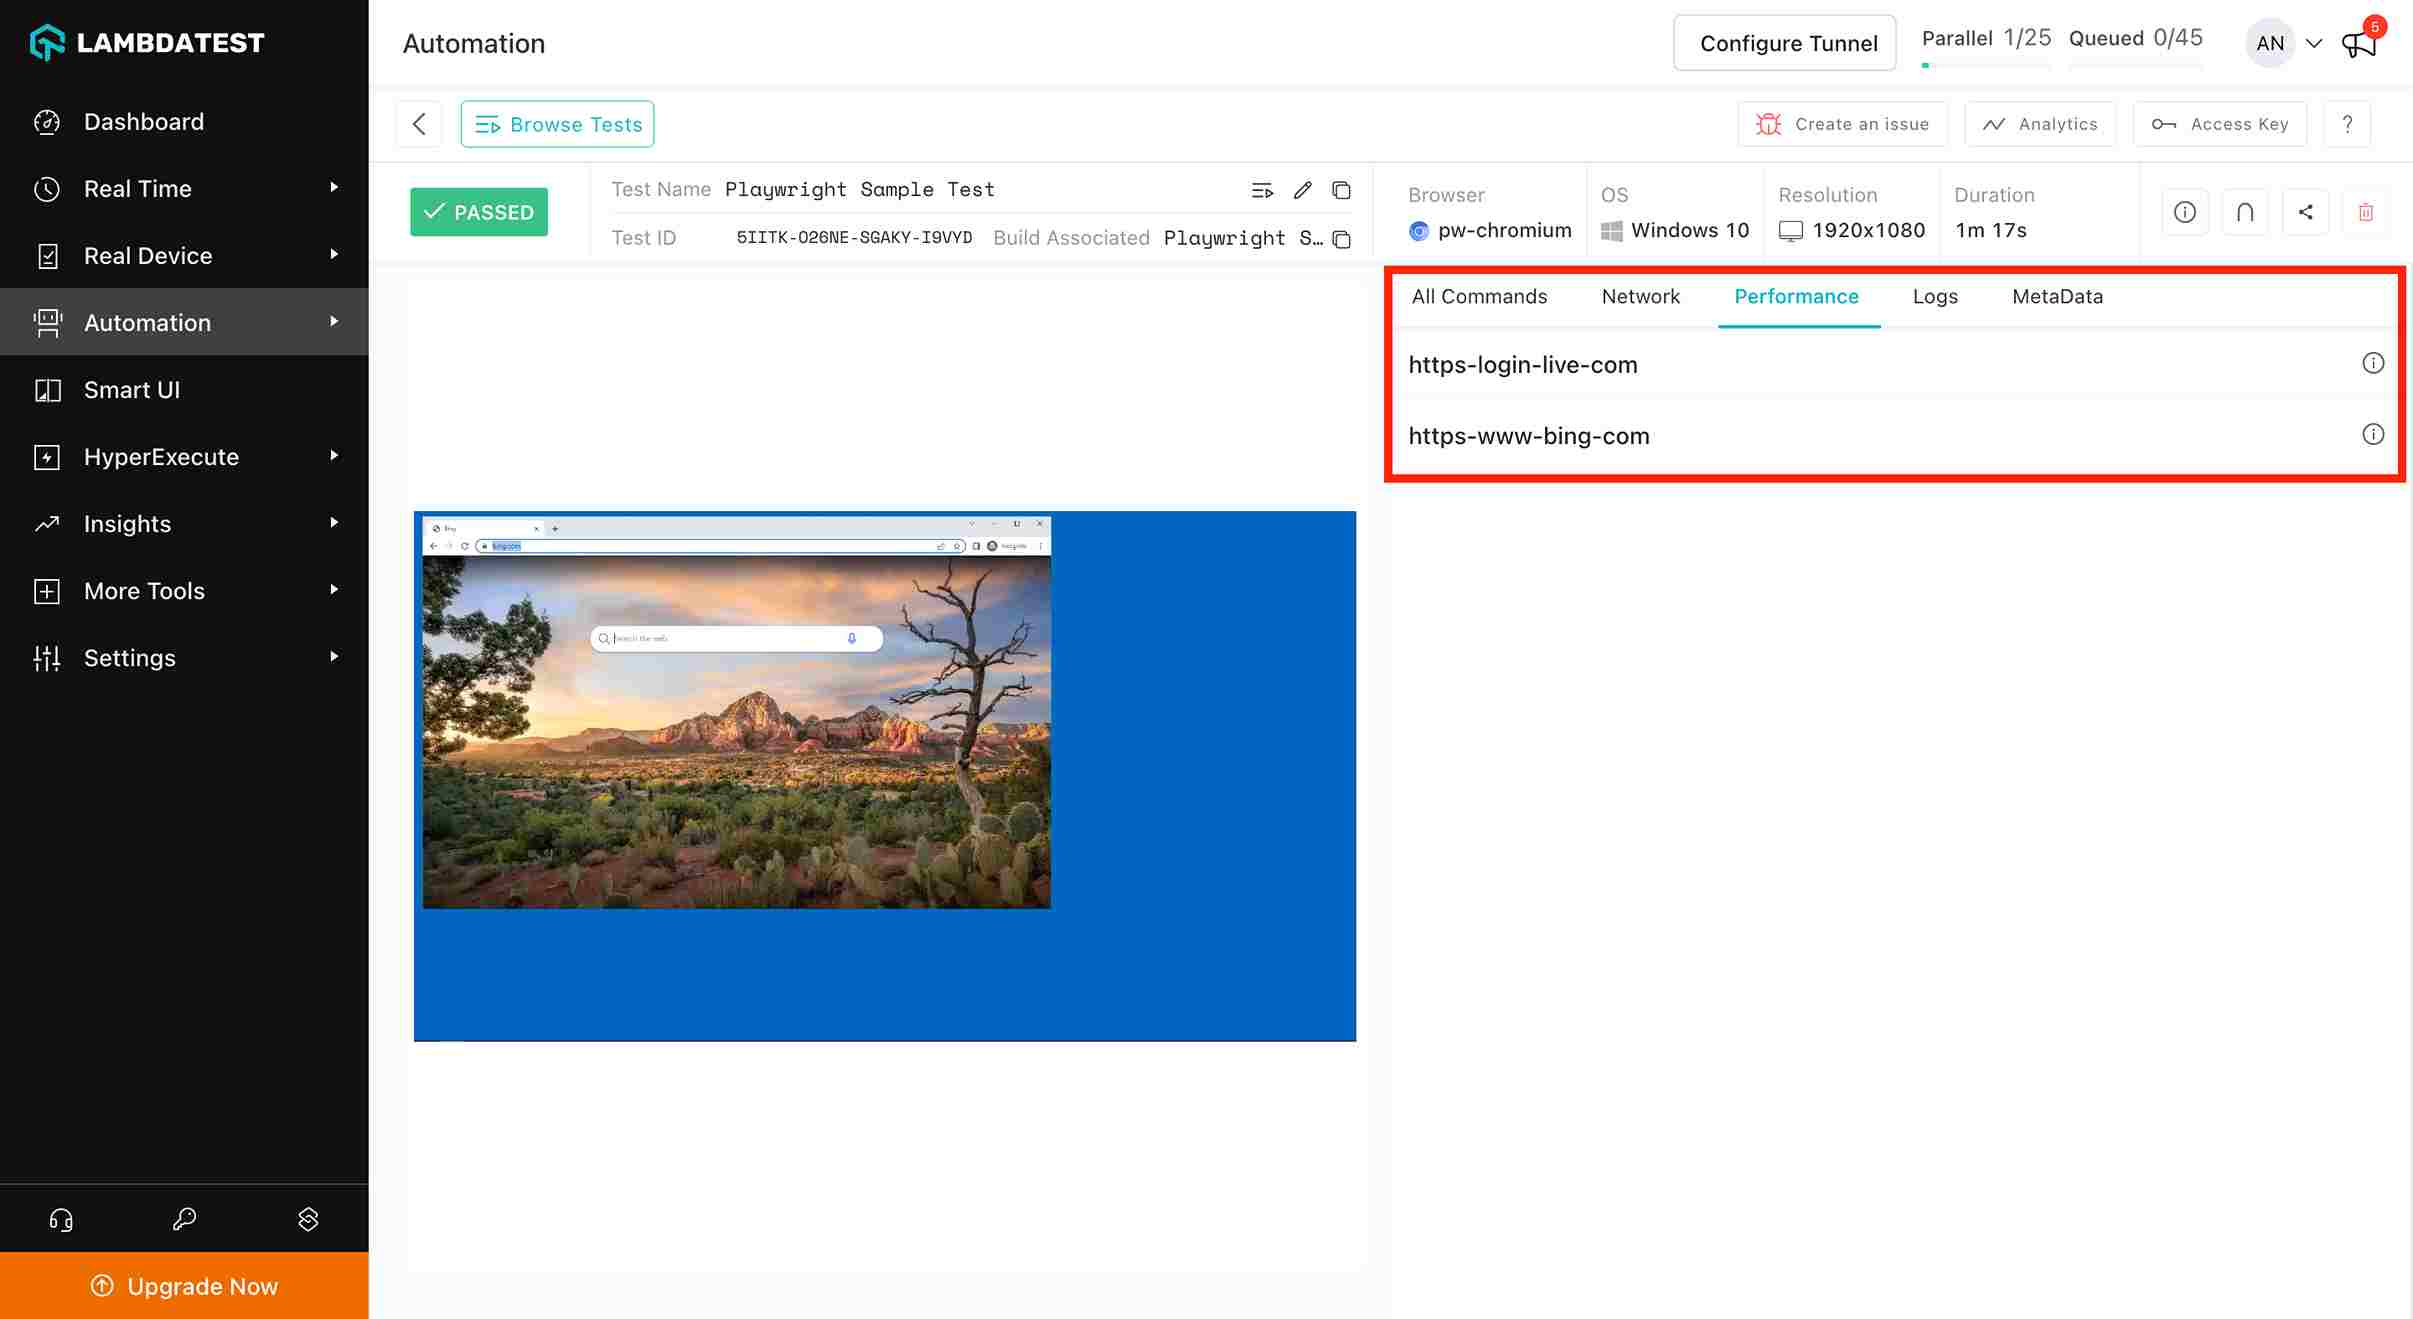
3. You can see the Lighthouse Performance Metrics on your screen now, for the URL requested. For example, in the below image, the lighthouse report is generated for https://login.live.com.
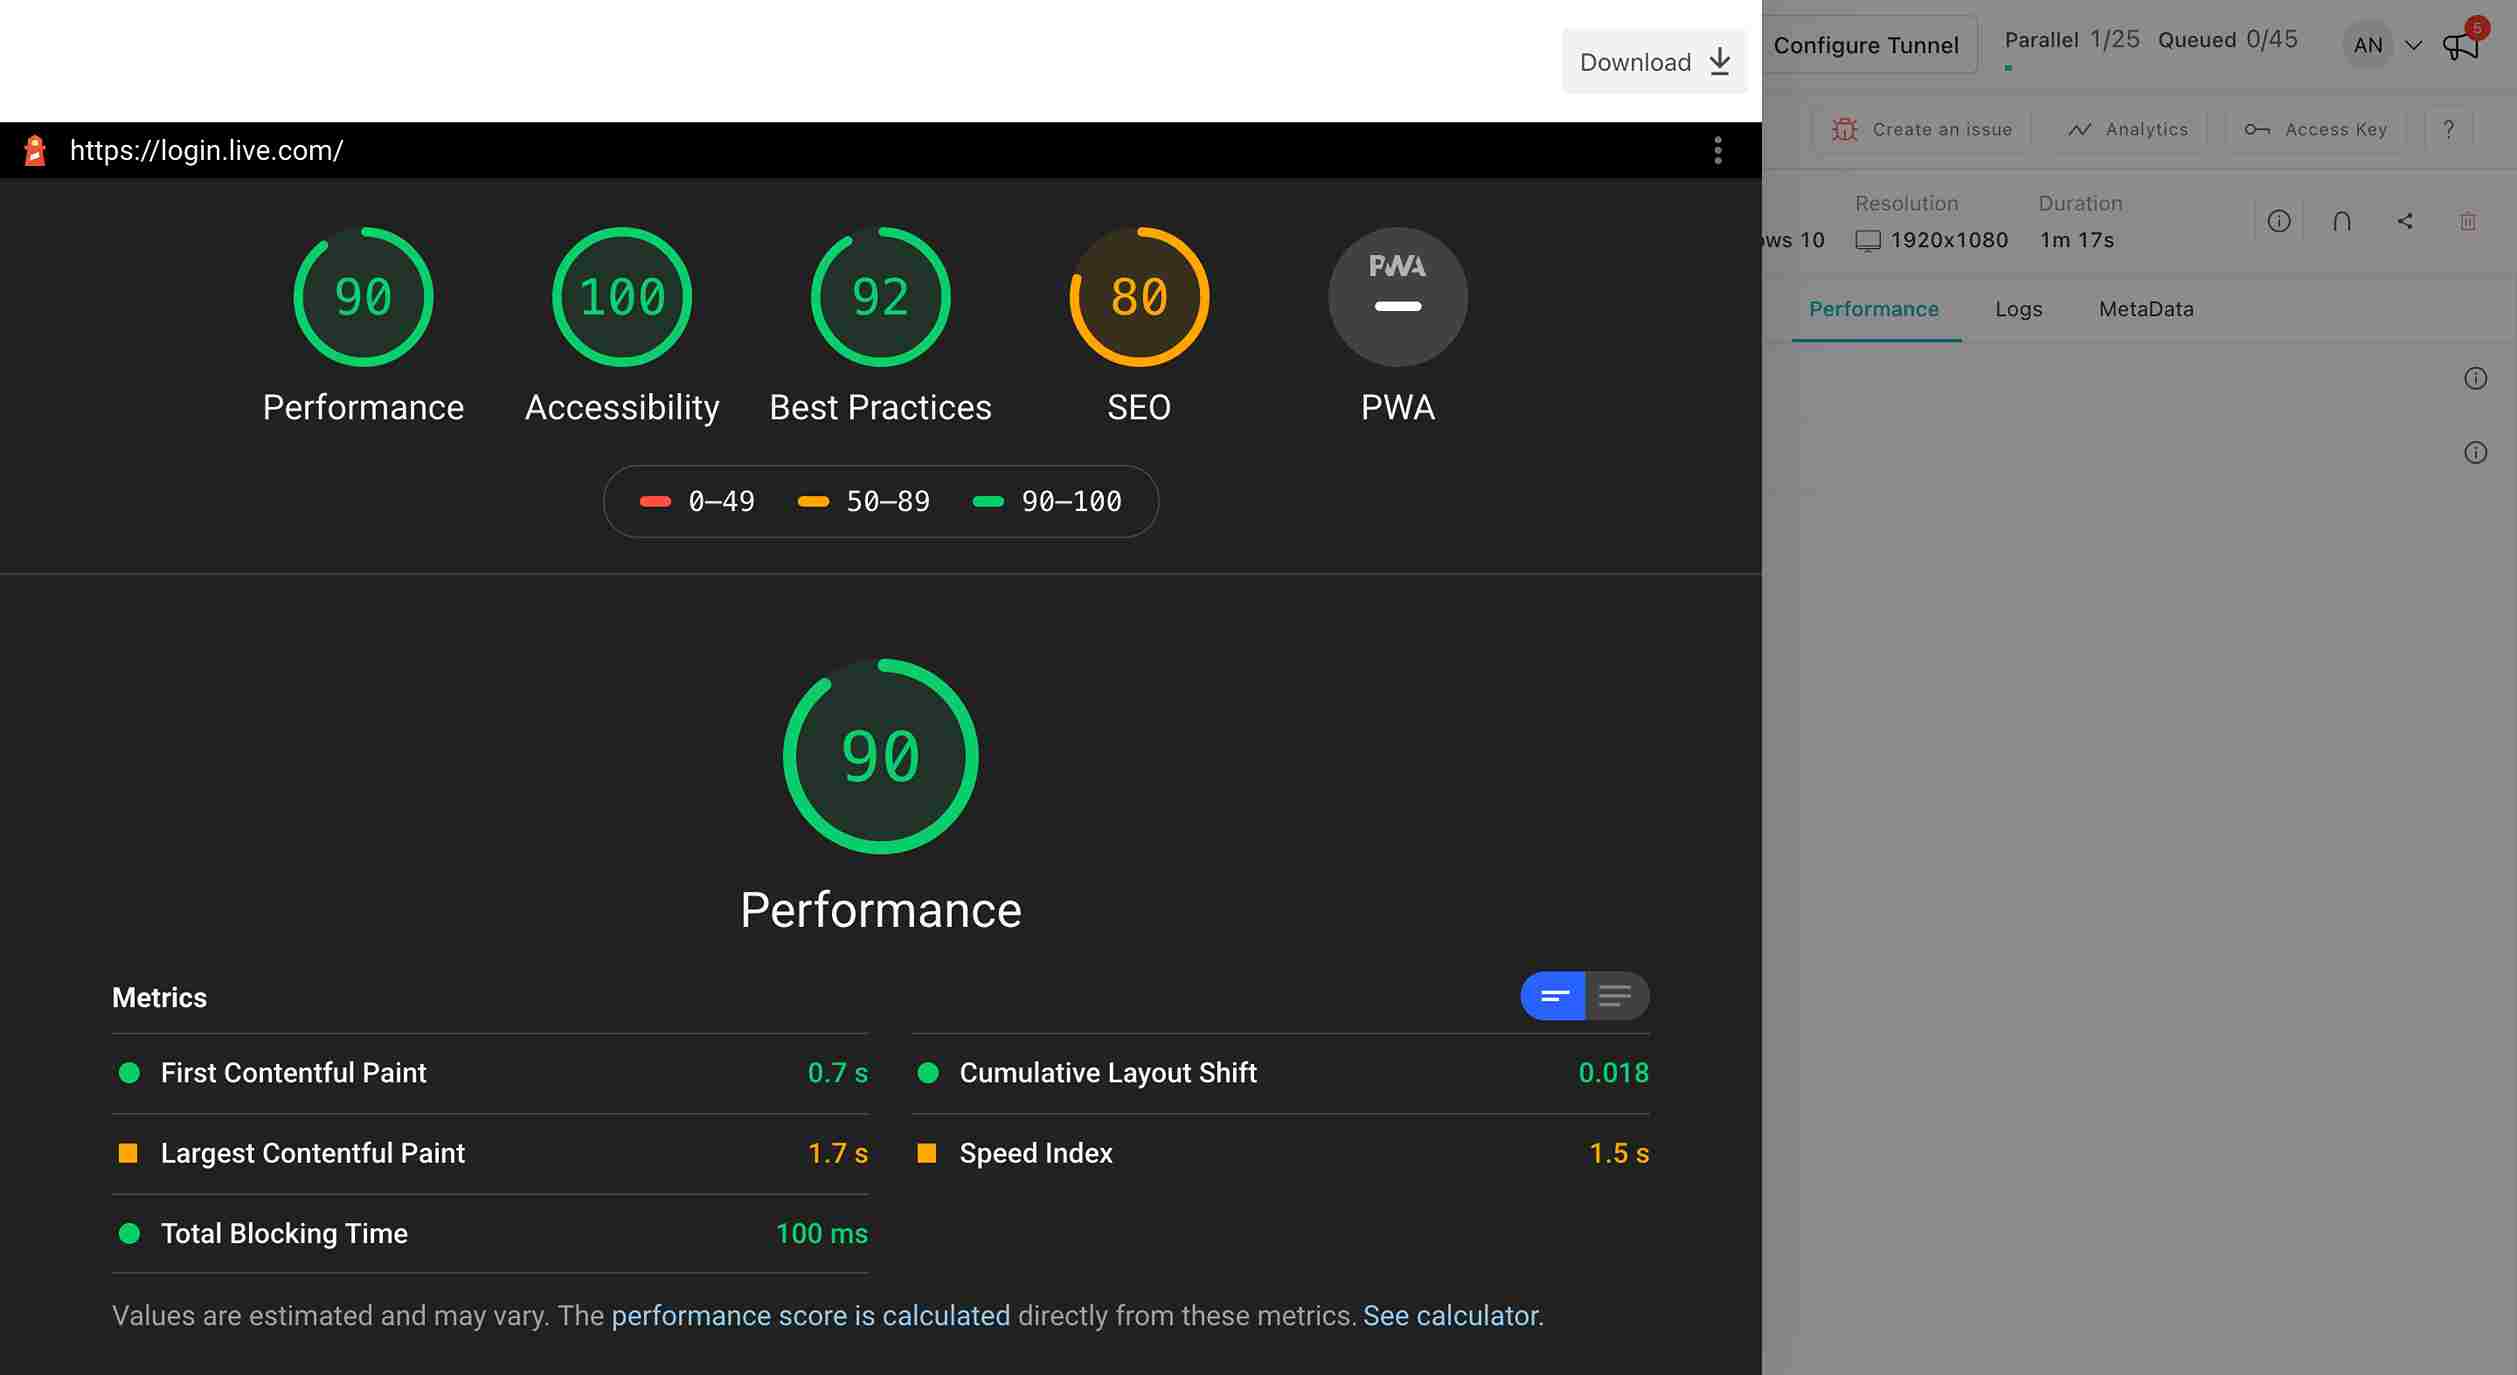
Similarly, you can click on any of the performance reports to view it in detail. Performance reports can also be downloaded in various formats. Not only this, but LambdaTest also helps you view the Passed Audits, individual metrics, detailed diagnosis, and improvement opportunities about that particular Lighthouse Audit.
That's it folks! That's all about the Lighthouse Performance Metrics with LambdaTest. You can read more about the Lighthouse Audits and Performance Metrics from web.dev page. If you have any doubt or questions, feel free to contact our experts at 24/7 chat support or mail us at support@lambdatest.com. Happy testing! :)