Build Insights - Analyze your test builds and get build level insights
Overview
Build Insights is your build-level health dashboard. It shows how stable each build is, how long it took, and which tests are causing problems so you can decide quickly whether a build is safe to promote or needs more work.
With Build Insights, you can view all your unique builds in a centralized list, then drill down into individual build details to explore comprehensive metrics and test-level insights. The feature is designed to be intuitive and accessible, whether you're a QA engineer analyzing test results or a team lead tracking overall build health.
Build Insights also supports Unique Instances view, which consolidates retry runs by grouping tests by name and environment (browser + OS + device + resolution), showing only the final run result for cleaner, more accurate reporting. For a comprehensive guide on how unique instances and retry attempts are detected, see Unique Test Instances and Intelligent Retry Detection.
Build Insights Flow
Build Insights organizes your test data into two main views:
- Build Insights Page – scan all builds and spot risky ones using high-level metrics.
- Build Details Page – open a specific build to understand why it looks good or bad, using detailed charts and test-level data.
Page 1: Build Insights - List of All Unique Builds
Use this page to monitor all builds at a glance and decide which ones need attention.
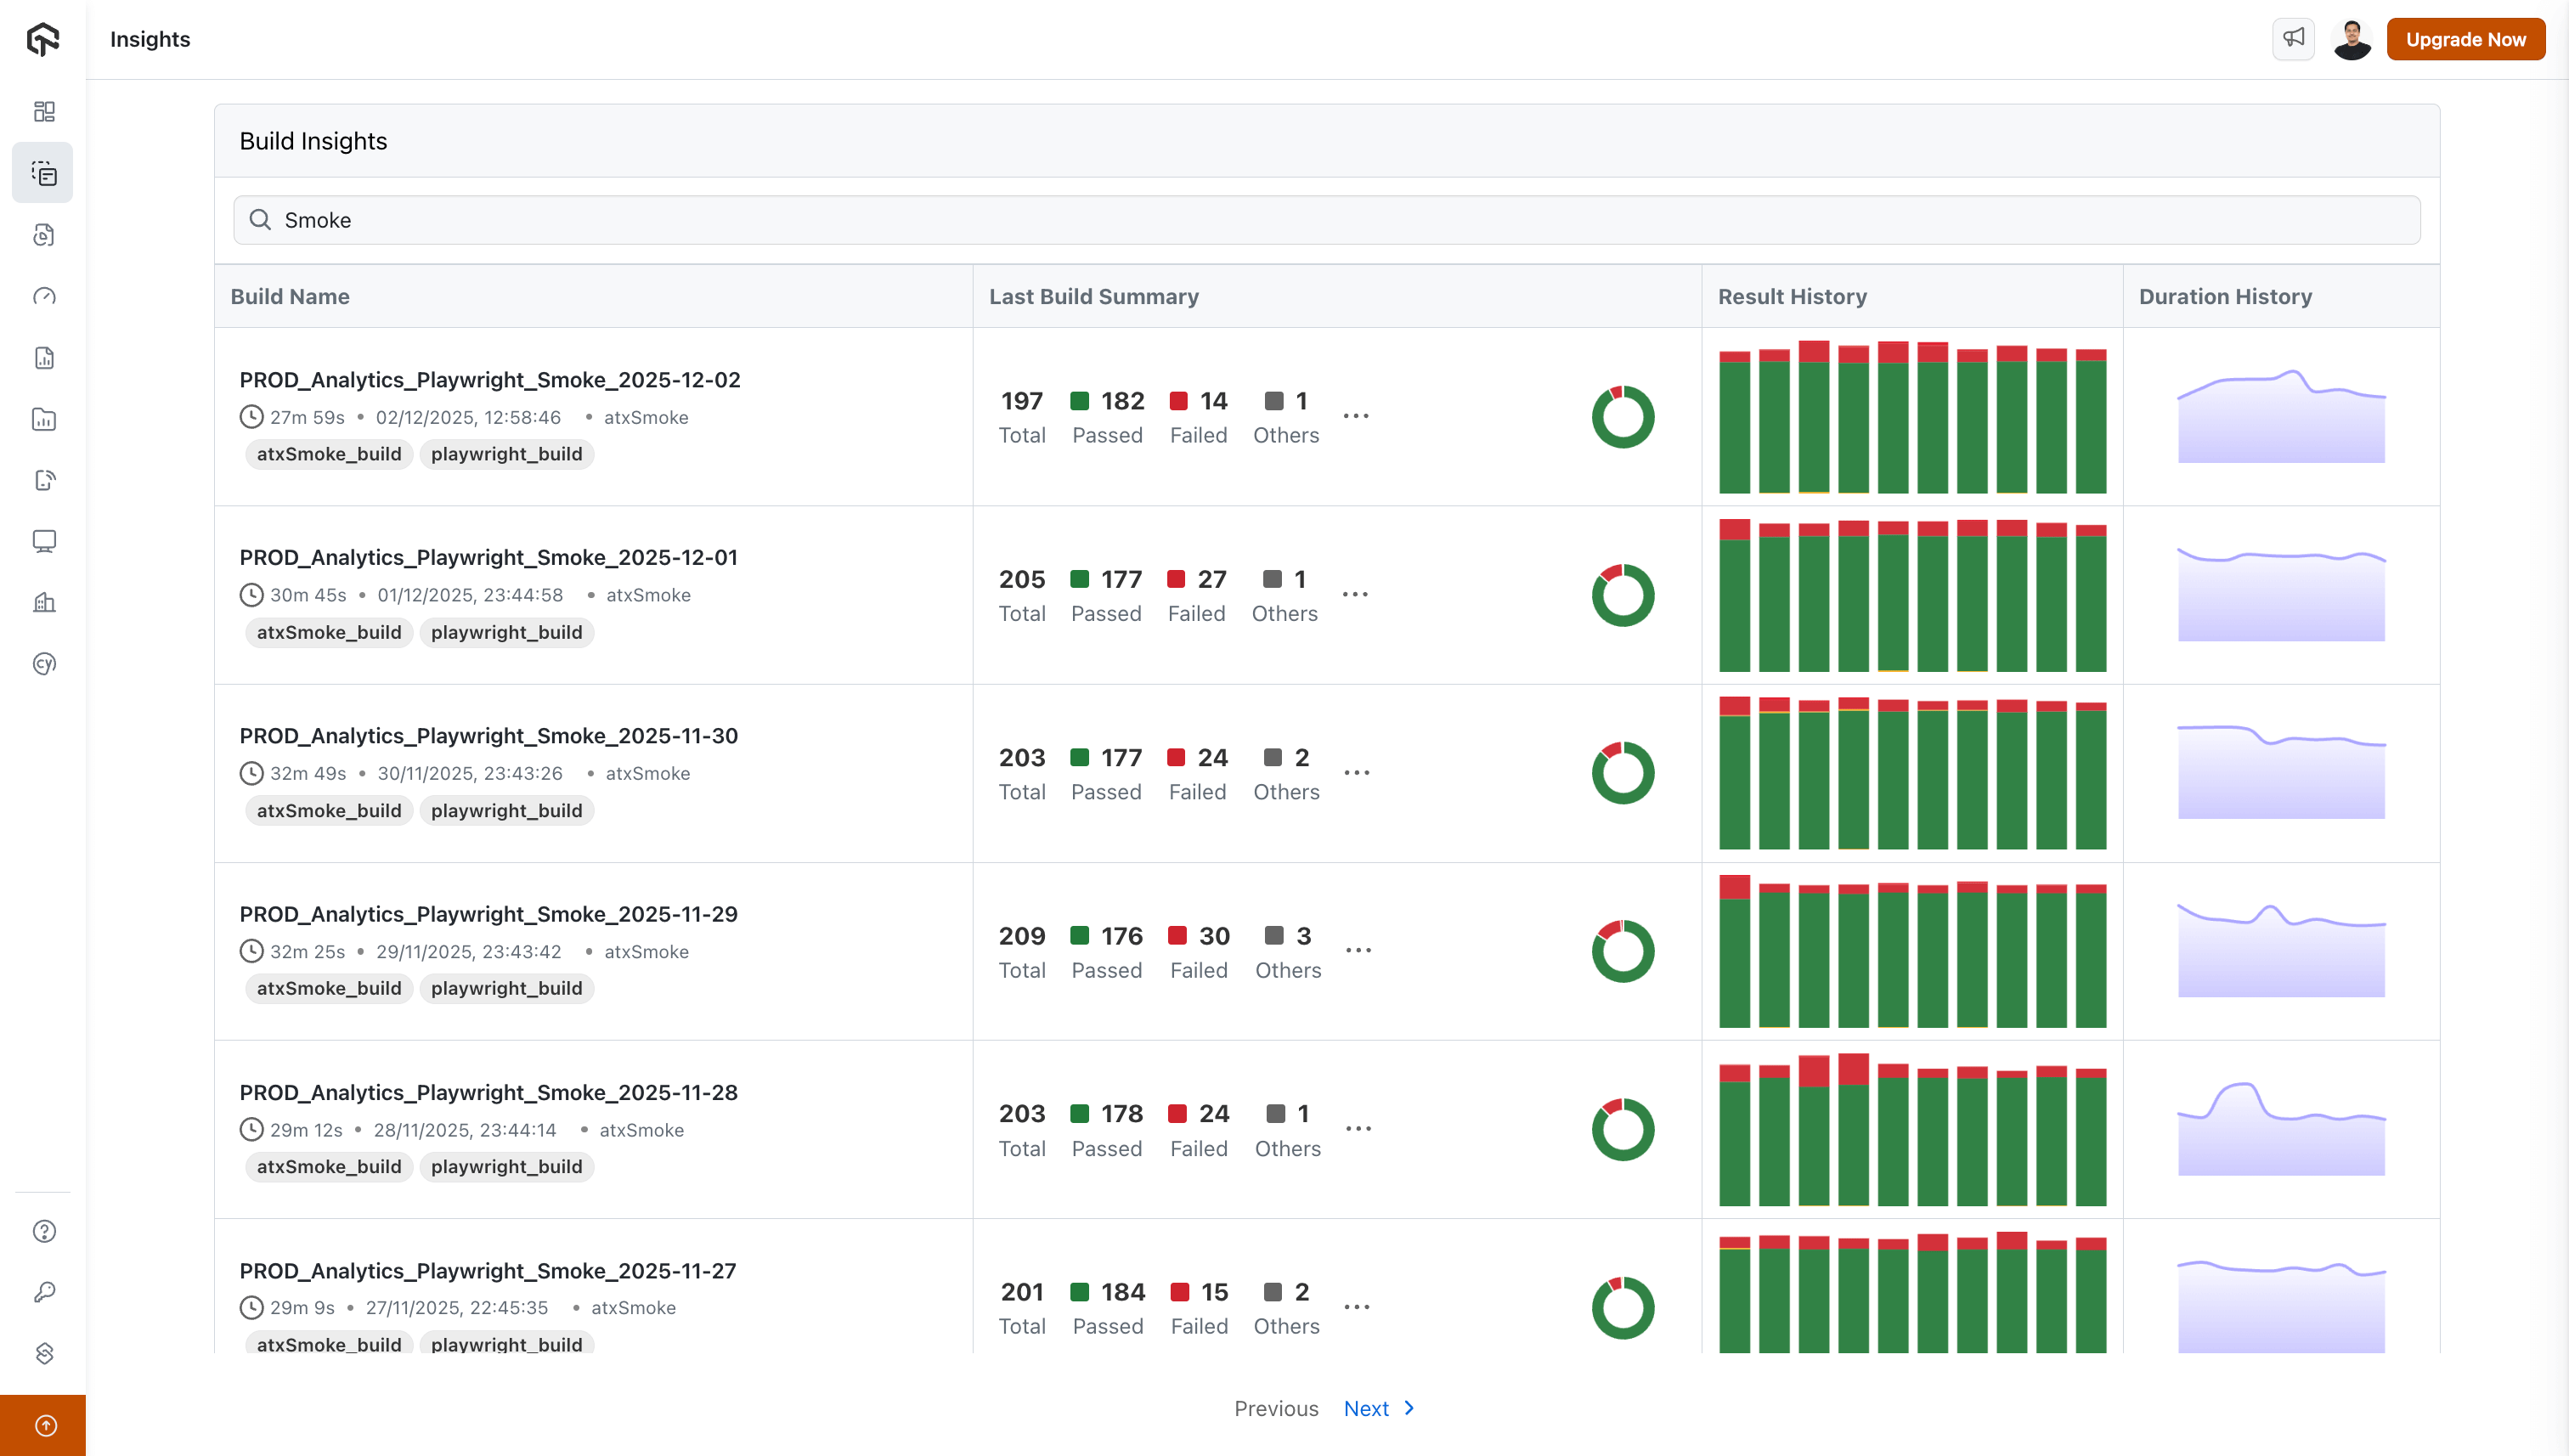
Search Functionality
Use the search bar to quickly find a specific build (for example, by suite name like Smoke, Regression, or Nightly) instead of scrolling through the full list.
Build Information Table
The main table displays your builds with the following columns:
Build Name Column
Each build entry shows:
- Build Name: The full name of the build (e.g.,
PROD_Analytics_Playwright_Smoke_2025-12-02) - Duration: How long the build took to execute, displayed in a readable format (e.g., "27m 59s", "2h 15m")
- Execution Timestamp: The date and time when the build was executed (e.g., "02/12/2025, 12:58:46")
- Project/Tag: The associated project or tag name (e.g., "atxSmoke")
- Build Tags: Visual tags associated with the build (e.g., "atxSmoke_build", "playwright_build")
Last Build Summary Column
Use this column to quickly judge the latest run of a build:
- Total: Total number of tests executed
- Passed: Number of tests that passed (displayed in green)
- Failed: Number of tests that failed (displayed in red)
- Others: Number of tests in other statuses like blocked, skipped, etc. (displayed in grey)
Result History Column
Use this to understand how reliable a build has been over time (not just in the last run):
- Donut Chart: A circular chart showing the overall pass/fail ratio for the build
- Bar Chart: A series of 10 vertical bars representing the last 10 build executions, with:
- Green segments indicating successful runs
- Red segments indicating failed runs
- The height of colored segments showing the proportion of pass/fail results
Duration History Column
A line graph showing how build duration has changed over time for the last 10 builds. Use it to:
- Spot builds that are gradually getting slower.
- Detect sudden spikes that may indicate performance regressions or environment issues.
- Compare duration trends between builds when optimizing your pipeline.
Navigation
Use the pagination controls at the bottom of the table to navigate through multiple pages of builds. Click "Previous" or "Next >" to browse through your build history.
Page 2: Build Details - Individual Build Analysis
Open this page when you want to understand why a build looks healthy or unhealthy. The page is split into two tabs: Insights (build-level metrics) and Tests (test-level details).
Navigation and Breadcrumbs
At the top of the page, you'll see:
- A back arrow to return to the Build Insights list
- The build name as a breadcrumb path (e.g.,
PROD_Analytics_Playwright_Smoke_2025-12-02)
Filters and Sharing Options
Use filters to narrow analysis to exactly the slice you care about (for example, only Chrome failures on macOS). You can also share the build details page with your team.
Available Filters:
- Browser: Filter by browser type (Chrome, Firefox, Safari, Edge, etc.)
- Status: Filter by test status (Passed, Failed, Error, etc.)
- OS: Filter by operating system (Windows, macOS, Linux, etc.)
- Project: Filter by project name
- Build Tags: Filter by build-specific tags
- Test Tags: Filter by test-specific tags
- Choose Custom Tags: Select from your custom tag definitions
Sharing Options:
- Click the share icon next to the filters to share the current view with your team
- Generate shareable links to the build details page (note: filter settings are not preserved in shared links)
Unique Test Instances
The Show Unique Instances toggle consolidates retry runs to give you a cleaner, more accurate view of your test results. This feature applies to both the Insights and Tests tabs.
How it works:
-
When ON: Within the current build, tests are grouped by test name + environment (browser + OS + device + resolution) as a single instance. Only the final run of each instance is considered in reporting, eliminating noise from intermediate retry attempts. This affects:
- Insights tab: Key metrics, charts, and Smart Tags reflect deduplicated counts based on final run results
- Tests tab: The test list shows only the final execution per unique test-environment combination
-
When OFF: All individual test executions are shown, including every retry attempt.
The grouping is scoped to the individual build ID, meaning each build's metrics reflect only the deduplicated results within that specific build run.
Your Settings Are Remembered: Your Show Unique Instances preference is automatically saved, so you don't need to re-enable it each time you visit. Build Insights and Test Insights remember their settings independently, allowing you to configure each page to suit your workflow.
Retry run consolidation requires a small amount of processing time after test execution completes. If you've just finished a build, wait a moment before toggling on Unique Instances to ensure all data is consolidated.
Want to understand exactly how unique instances and retry attempts are detected? See our comprehensive guide on Unique Test Instances and Intelligent Retry Detection for step-by-step examples and best practices.
Tab 1: Insights
Use the Insights tab to understand the overall health and performance of the selected build before you dive into individual tests.
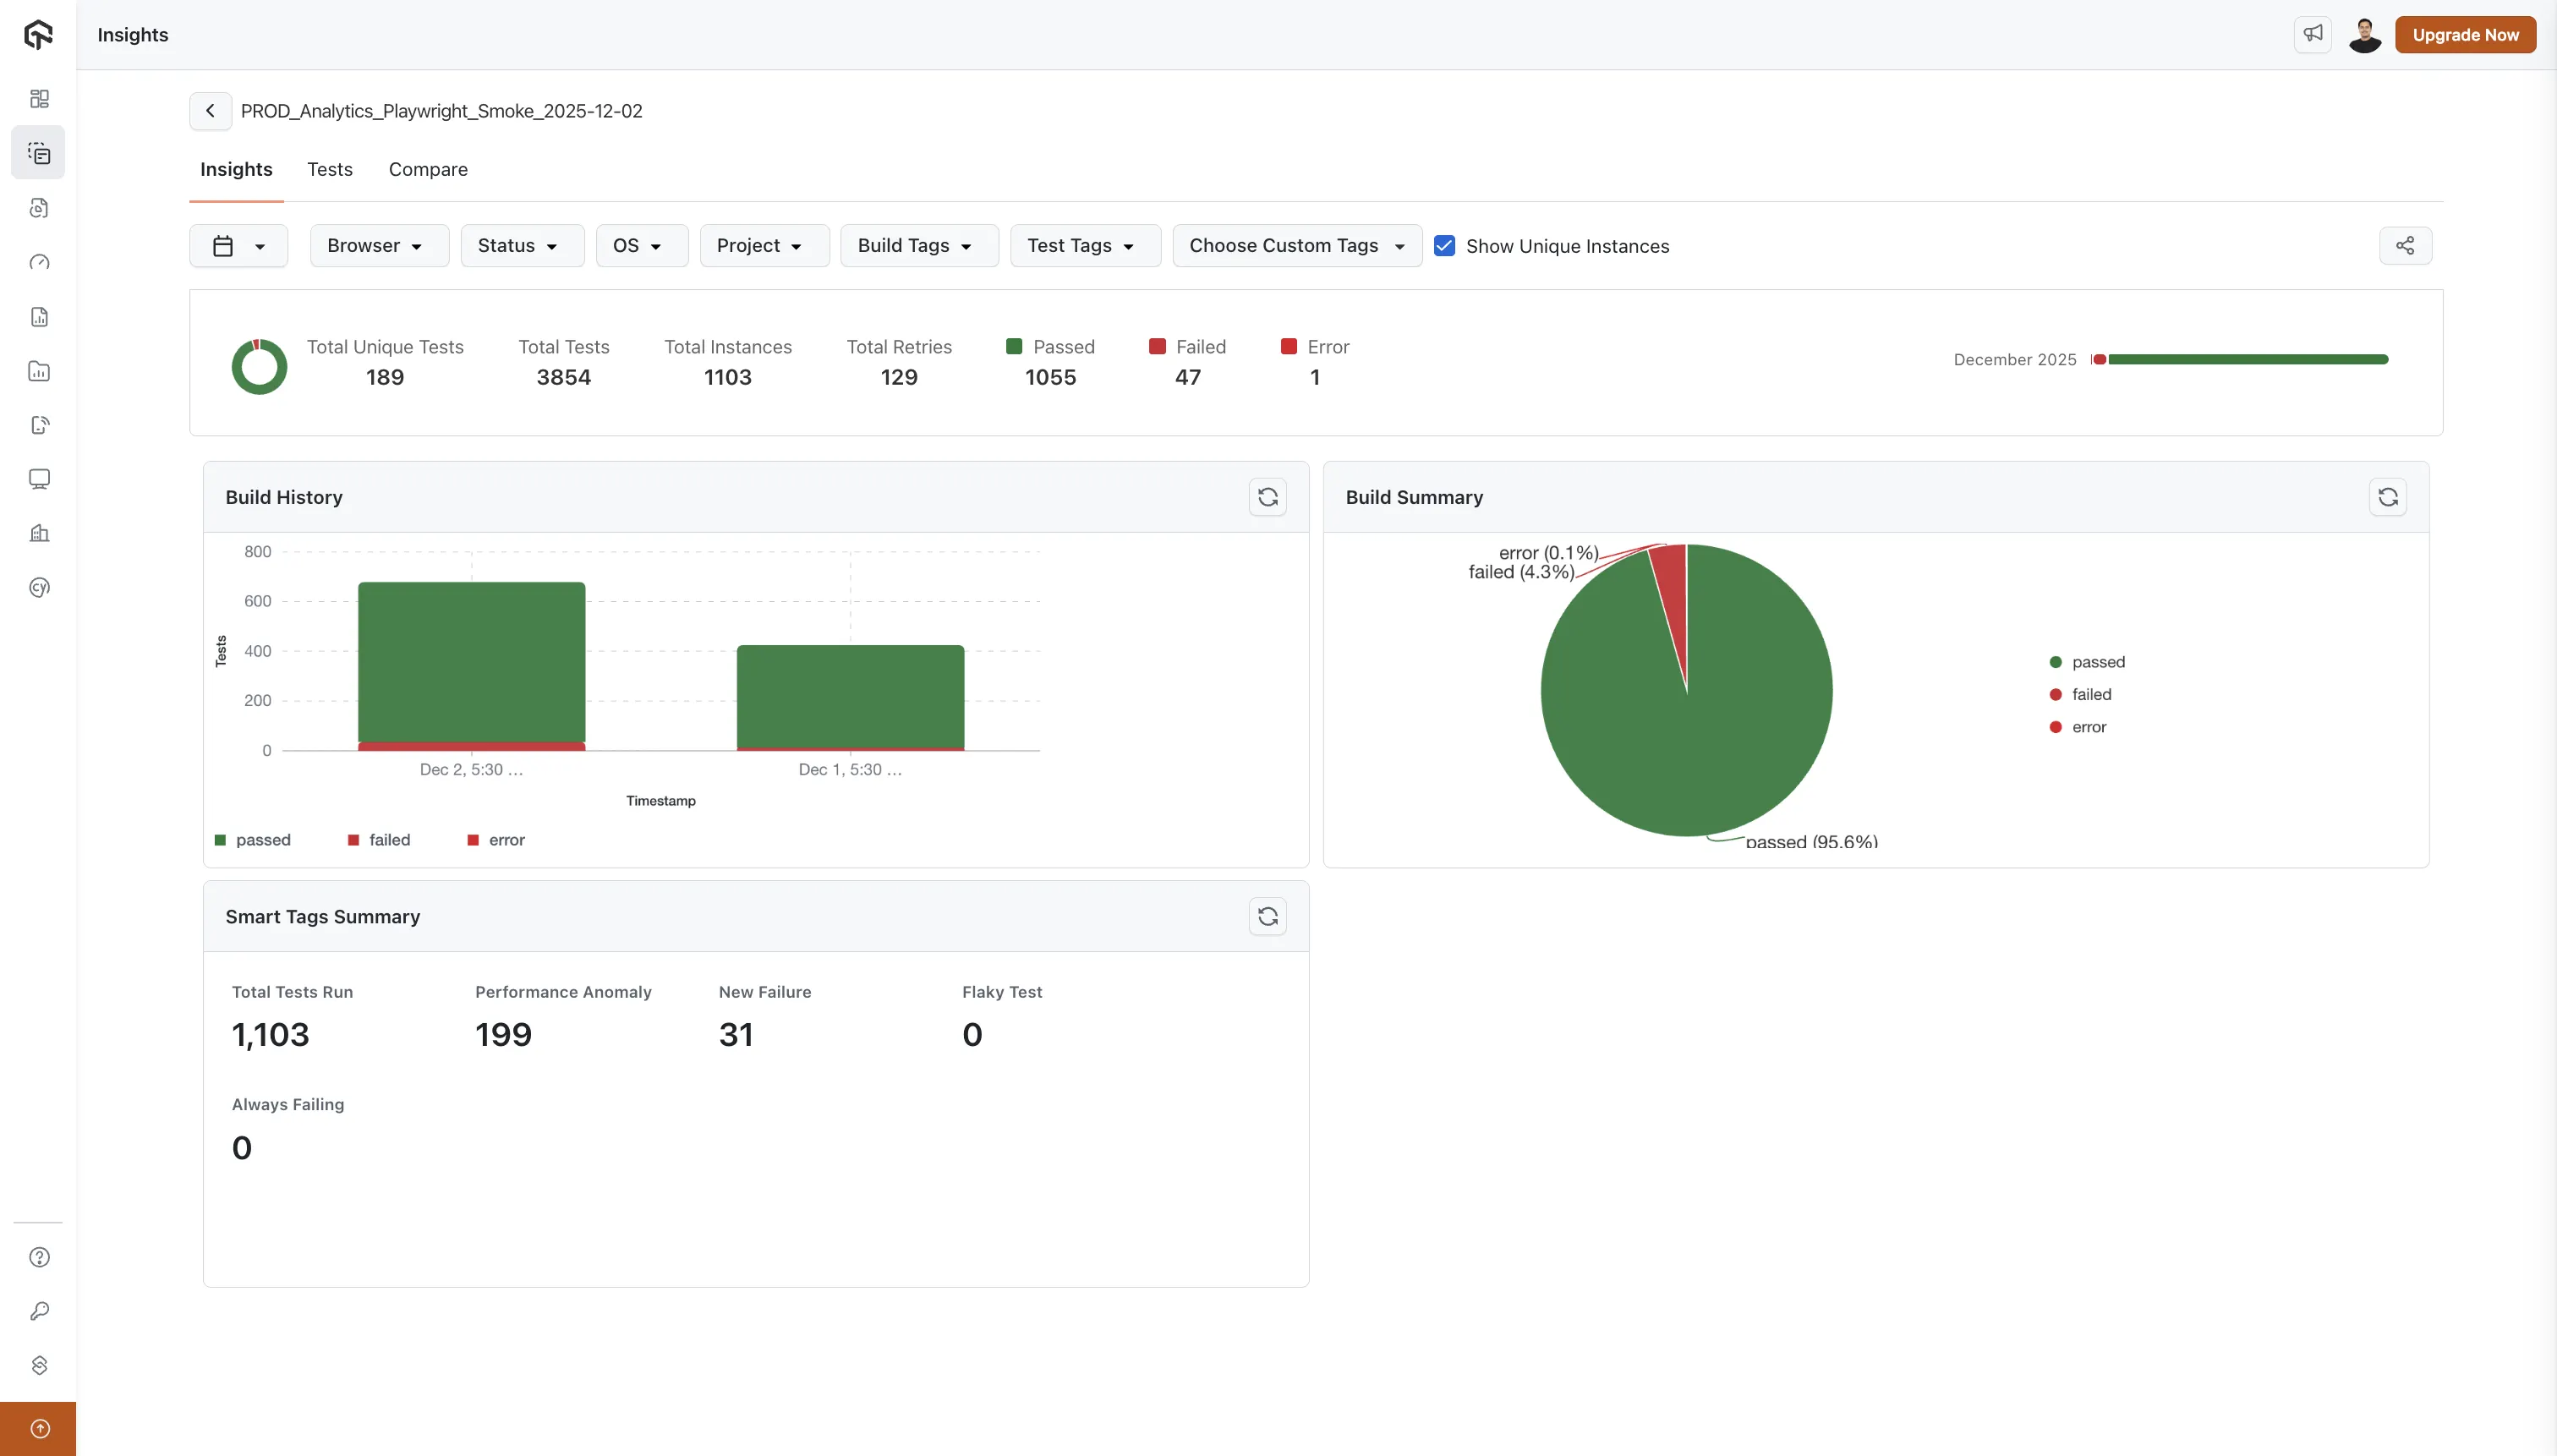
Key Metrics Summary
At the top of the Insights tab, you'll see a summary row displaying:
- Total Unique Tests: The number of unique test cases in the build
- Total Tests: The total number of test executions (including reruns)
- Passed: Count of passed tests (with green indicator)
- Failed: Count of failed tests (with red indicator)
- Error: Count of tests that errored (with dark red indicator)
- Others: Count of tests in other statuses (with grey indicator)
Monthly Progress Bar
Use this bar to track how the build has behaved over the last 2 months:
- Green segments represent periods where most tests passed.
- Red segments highlight time ranges with frequent failures.
- Together they help you see whether the build is stabilizing or becoming riskier over time.
Build History Chart
This stacked bar chart shows how many tests passed, failed, or errored in each execution of the build:
- Y-axis: Number of tests
- X-axis: Timestamps of build executions
- Color-coded segments:
- Green: Passed tests
- Red: Failed tests
- Dark Red: Error status
- Yellow: Idle timeout or other statuses
- Legend: Color-coded legend below the chart explains each status type
Use it to:
- Identify trends in success/failure rates across runs.
- Quickly see when a spike in failures started.
- Compare executions before and after a code or configuration change.
Build Summary Chart
This pie chart summarizes the current execution:
- Largest segment: Passed tests (typically shown in green with percentage)
- Other segments: Failed, Error, and other statuses with their respective percentages
- Legend: Color-coded legend showing what each segment represents
Use it for a quick “go / no-go” signal on the current run.
Smart Tags Summary
A grid displaying intelligent test categorization:
- Total Tests Run: Overall count of test executions
- Performance Anomaly: Tests flagged for unusual performance patterns
- New Failure: Recently introduced test failures
- Flaky Test: Tests with inconsistent pass/fail patterns
- Always Failing: Tests that consistently fail
Each metric points you directly to tests that need attention (for example, focus first on New Failure and Always Failing before refactoring Flaky Test).
Tab 2: Tests
Use the Tests tab when you are ready to debug at the individual test level.
Want to compare two builds side by side? Use the Compare tab to identify new failures, fixed tests, and stability changes between any two builds. This is especially useful for release validation and regression detection. Learn more in the Build Comparison documentation.
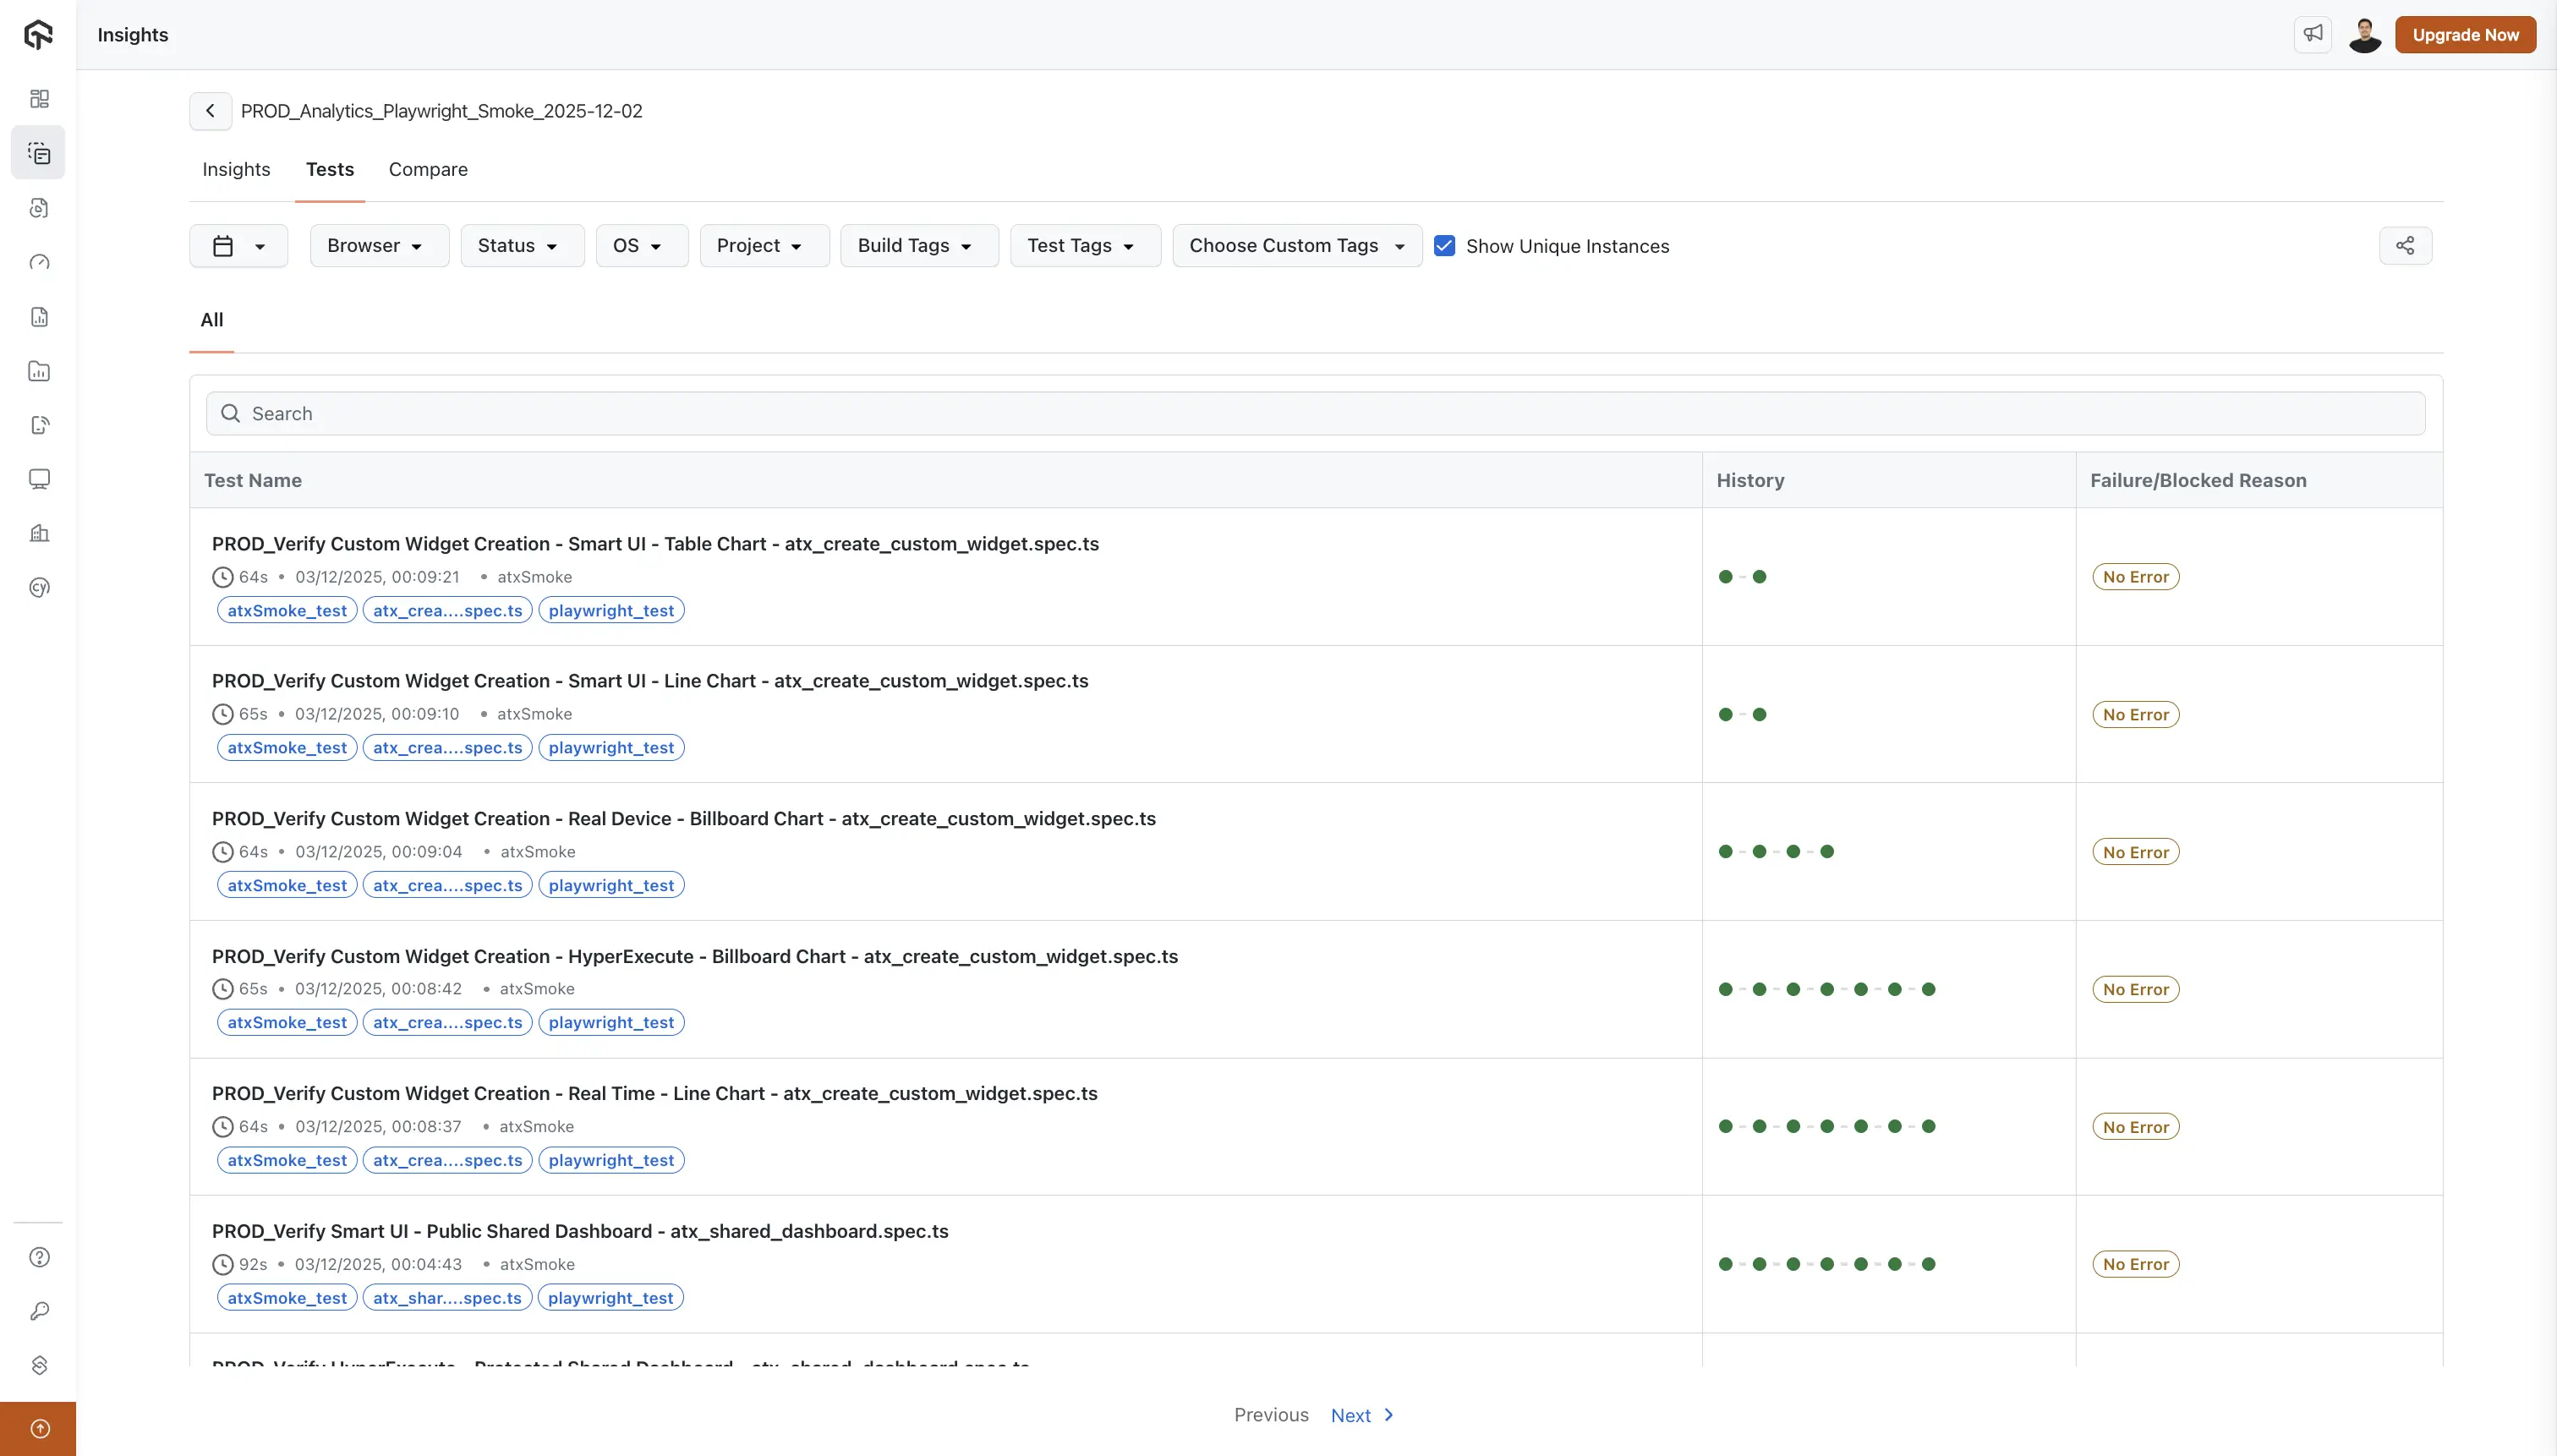
Search Functionality
Use the search bar to jump straight to a specific test by name (for example, when a developer shares a failing spec file name).
Group By
The Group By dropdown allows you to organize tests by specific environment attributes, making it easier to identify patterns across different configurations.
Location: The Group By dropdown is positioned adjacent to the search bar.
Available Grouping Options:
- Browser: Group tests by browser version (e.g., Chrome 120, Firefox 115)
- OS: Group tests by operating system version (e.g., Windows 10, macOS Ventura)
- Resolution: Group tests by screen resolution (e.g., 1920x1080, 1366x768)
- Device: Group tests by device type (e.g., Desktop, Mobile)
Default Behavior:
- By default, all grouping options are selected, which displays a flat list view showing all tests without grouping
- Deselecting one or more options groups the tests by the remaining selected attributes
Your Settings Are Remembered: Your Group By selections are automatically saved, so when you return to Build Insights, your preferred grouping configuration is already applied.
Use Cases:
- Browser compatibility analysis: Deselect all except Browser to quickly see which browsers have the most failures
- OS-specific debugging: Group by OS to identify platform-specific issues
- Resolution testing: Group by Resolution to spot responsive design problems
- Multi-dimensional grouping: Combine multiple grouping options to create hierarchical views (e.g., group by Browser and then by OS within each browser group)
Test Results Table
The main table displays individual test executions with three key columns:
Test Name Column
For each test, you'll see:
Primary Line:
- Test Name: The full name of the test (e.g.,
PROD_Verify FTD feature for the build atxRD_flakyBuild - flaky_test_detection.spec.ts)
Secondary Line (Environment Info): Each test row displays detailed execution context with visual icons in the following order:
- Duration: How long the test took to execute (e.g., "82s", "2m 15s")
- Timestamp: When the test was executed in a readable format (e.g., "Jan 20, 2026 5:12 PM")
- Username: The user who executed the test
- Browser: Browser name and version with browser icon (e.g., Chrome icon with "Chrome 120")
- OS: Operating system with OS icon (e.g., Windows icon with "Windows 10")
- Device: Device type indicator (e.g., Desktop, Mobile)
- Resolution: Screen resolution used (e.g., "1920x1080")
- Smart Tags: Intelligent test categorization tags (e.g., "Flaky Test", "New Failure", "Performance Anomaly")
Additional Information:
- Project/Tag: Associated project or tag (e.g., "atxSmoke")
- Test Tags: Clickable tags associated with the test (e.g., "playwright_test", "atxSmoke_test")
The environment icons match the visual style used throughout the Test Intelligence drilldown views, providing consistent visual identification of execution contexts.
History Column
A visual representation of the test's recent execution history:
- 10 colored circles: Each circle represents one of the last 10 test executions
- Green circles: Successful test runs
- Red circles: Failed test runs
- This visual history helps you quickly identify:
- Test stability patterns
- Flaky tests (alternating green/red patterns)
- Consistently failing tests (mostly red)
- Stable tests (mostly green)
Failure/Blocked Reason Column
For each test, this column displays:
- Error Message: If the test failed or was blocked, the reason is shown in a colored box
- No Error: If the test passed, this is indicated in a light yellow box
- This information helps you quickly understand why tests failed without opening individual test details
Filtering and Analysis
Use the filters at the top to:
- Focus on specific browsers or operating systems (for example, only Safari failures on macOS).
- Filter by test status (Passed, Failed, Error) so you can work through failed tests first.
- Narrow down by project or tags to isolate a particular suite or component.
- Apply custom tag filters to align analysis with your internal categorization.
Pagination
Navigate through multiple pages of test results using the "Previous" and "Next >" controls at the bottom of the table.
How Teams Typically Use Build Insights
- Release readiness checks: Use the Build Insights page, Key Metrics Summary, and Build Summary chart to decide if a build is safe to ship.
- Regression and incident analysis: Use the Build History chart, Duration History, and test History column to find when a regression started and which tests were affected.
- Stability improvement work: Use Smart Tags and the Tests tab filters to prioritize fixing always-failing and flaky tests.
Build Naming Best Practices
Maintain Common Build Names
To get the most value from Build Insights, we recommend maintaining common build names instead of adding unique identifiers (UIDs) daily or weekly. Here's why:
Benefits of Common Build Names:
-
Historical Tracking: When you use consistent build names (e.g.,
PROD_Analytics_Playwright_Smoke), Build Insights can aggregate all executions of that build over time, giving you:- Accurate Result History charts showing trends across multiple runs
- Meaningful Duration History graphs that track performance over time
- Better visibility into build health patterns
-
Easier Analysis: Common build names make it easier to:
- Compare performance across different time periods
- Identify trends and patterns in test stability
- Track improvements or regressions in your test suite
-
Better Organization: Instead of creating new build names with dates or UIDs (e.g.,
Build_2025-12-02,Build_UID_12345), reuse the same build name for similar test suites. The system automatically tracks each execution with its timestamp, so you don't need unique names to distinguish runs.
Recommended Approach:
- Use descriptive, consistent names like:
PROD_Smoke_Tests,Regression_Chrome,Nightly_Build - Avoid adding dates or UIDs to build names unless necessary for specific use cases
- Let the execution timestamps handle the temporal distinction between runs
- Use tags and filters to further categorize and organize your builds
This approach ensures that Build Insights can provide you with meaningful historical analysis and trend identification for your test suites.
Best Practices
- Check builds early and often: Start your day on the Build Insights page to spot risky builds before they block releases.
- Filter with intent: Use filters to answer specific questions (for example, "Are failures only on Windows?") instead of browsing everything at once.
- Trust history, not one run: Use Result History, Duration History, and the test History column to judge stability over time, not just a single execution.
- Share context, not just failures: When sharing a build, also mention which metrics you looked at (for example, "pass rate dropped from 98% to 90% in the last 3 runs").
- Standardize build names: Maintain common build names so histories stay meaningful and easy to compare across days and weeks.
- Use Unique Instances for accurate reporting: Toggle on "Show Unique Instances" to consolidate retry runs and see the true pass/fail state of each test-environment combination, especially when your pipeline uses automatic retries.
- Leverage Group By for pattern analysis: Use the Group By dropdown in the Tests tab to organize tests by Browser, OS, Resolution, or Device. This helps quickly identify environment-specific failures and compatibility issues.
- Combine grouping with filters: Apply filters first to narrow down to relevant tests (for example, failed tests only), then use Group By to see how those failures distribute across environments.
 Chat with Us