Flaky Test Analytics with Test Intelligence
The best way to analyze your flaky tests is to use Test Intelligence. Test Intelligence is a machine learning-based algorithm that helps you identify flaky tests and get insights on the flaky tests that are causing your test runs to fail. By observing the historical test runs, Test Intelligence can identify the flaky tests and provide you with the insights to help you fix them.
Don't want to keep checking the dashboard? If you have the Slack Integration enabled, turn on the Flaky Test Messages preference to receive a Slack alert the first time TestMu AI detects a test as flaky — including the test name, build, and flake rate. Alerts are opt-in and off by default.
Flakiness Trends
The Flakiness Trends widget allows the QA teams to analyze the trends of the flaky tests executed on the platform categorized into Passed, Failed, and Flaky which can easily be filtered with the legends added at the top of the graph.
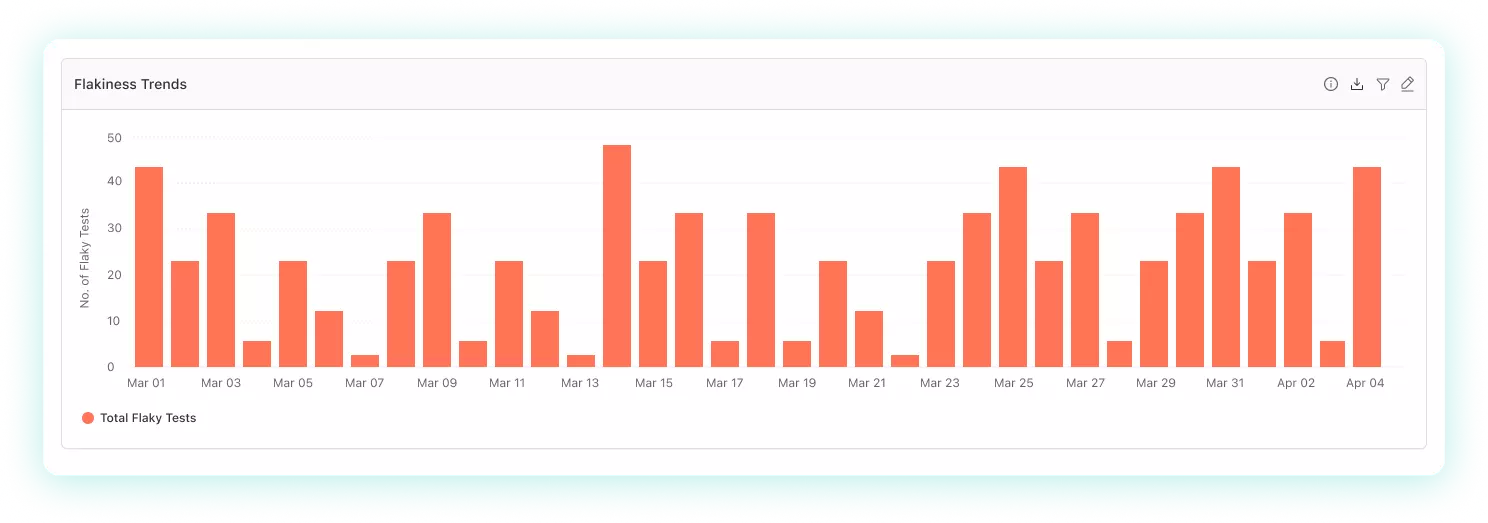
The graph shows the time series of the flaky tests executed on the platform. The QA teams can easily filter the graph with the legends added at the top of the graph. The QA teams can also hover over the graph to get the exact count of the flaky tests executed on the platform.
The following are the use cases of the Flakiness Trends widget:
- The QA teams can check the decrease or increase in the flaky tests executed on the platform over time.
- Easily navigate the to the test logs and fix the issues identified on the test logs.
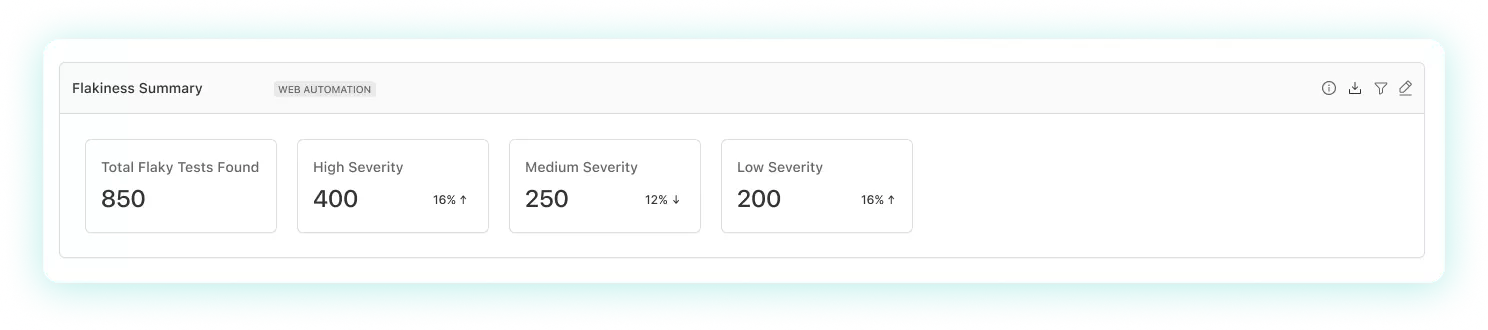
Flakiness Severity Summary
Analyze the flaky tests severity summary which is broadly categorized to High, Medium and Low depending on the Flake Rate of the tests. The following are the distribution of for the severity:
High- If the flake rate is more than75%in compared to the previous test runs.Medium- If the flake rate is between50%to75%in compared to the previous test runs.Low- If the flake rate is less than50%in compared to the previous test runs.
The flake rate is calculated on the basis of the total number of flaky tests executed on the platform in compared to the previous test runs.
For example, if the total number of flaky tests executed on the platform is 100 and the total number of flaky tests executed on the platform in compared to the previous test runs is 50 then the flake rate will be 50%.
The following are the use cases of the Flakiness Severity Summary widget:
- The QA teams can easily identify the flaky tests that are causing the test runs to fail on the basis of the severity.
- The QA can prioritize on the basis of the severity and fix the flaky tests that are causing the test runs to fail.
Flakiness Tests - Test Group View
The Flakiness Tests - Test Group View widget allows the QA teams to analyze the flaky tests on the basis of the test groups. The QA teams can easily analyze the flaky tests on the basis of the test groups and get insights on the flaky tests that are causing the test runs to fail.
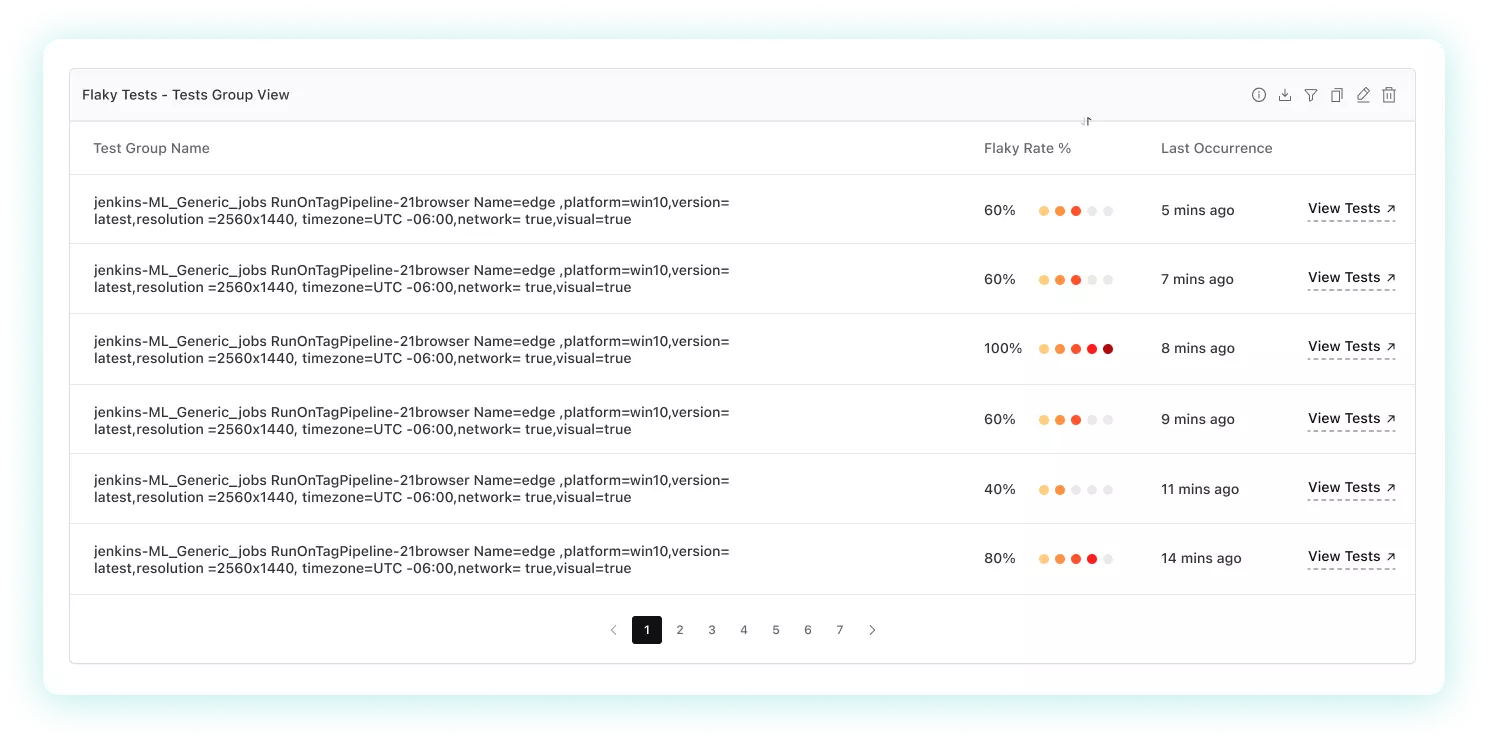
The following are the use cases of the Flakiness Tests - Test Group View widget:
- The QA teams can easily analyze the flaky tests on the basis of the test groups.
- The QA teams can identify the % of occurrence of the flaky tests on the basis of each test group.
To read more about the Flaky Tests Analytics, you can refer the documentation at Flaky Tests - Test Intelligence
