Analytics Dashboard Pre-built templates
About the Dashboard templates:
Dashboard templates provide a pre-defined set of widgets and visualizations tailored for specific testing requirements.
These templates help testers save time by not having to create custom dashboards from scratch. They also offer a standardized way to analyze test data and share insights across the team.
With various templates available for different test analytics purposes, testers can quickly gain insights into test performance, error reports, resource usage, and trends.
Prerequisites
You should have an account subscribed to TestMu AI Account and have relevant test data available in the system.
How to use it?
To use a dashboard template, follow these steps:
- Go to TestMu AI Analytics.
- Now, click on
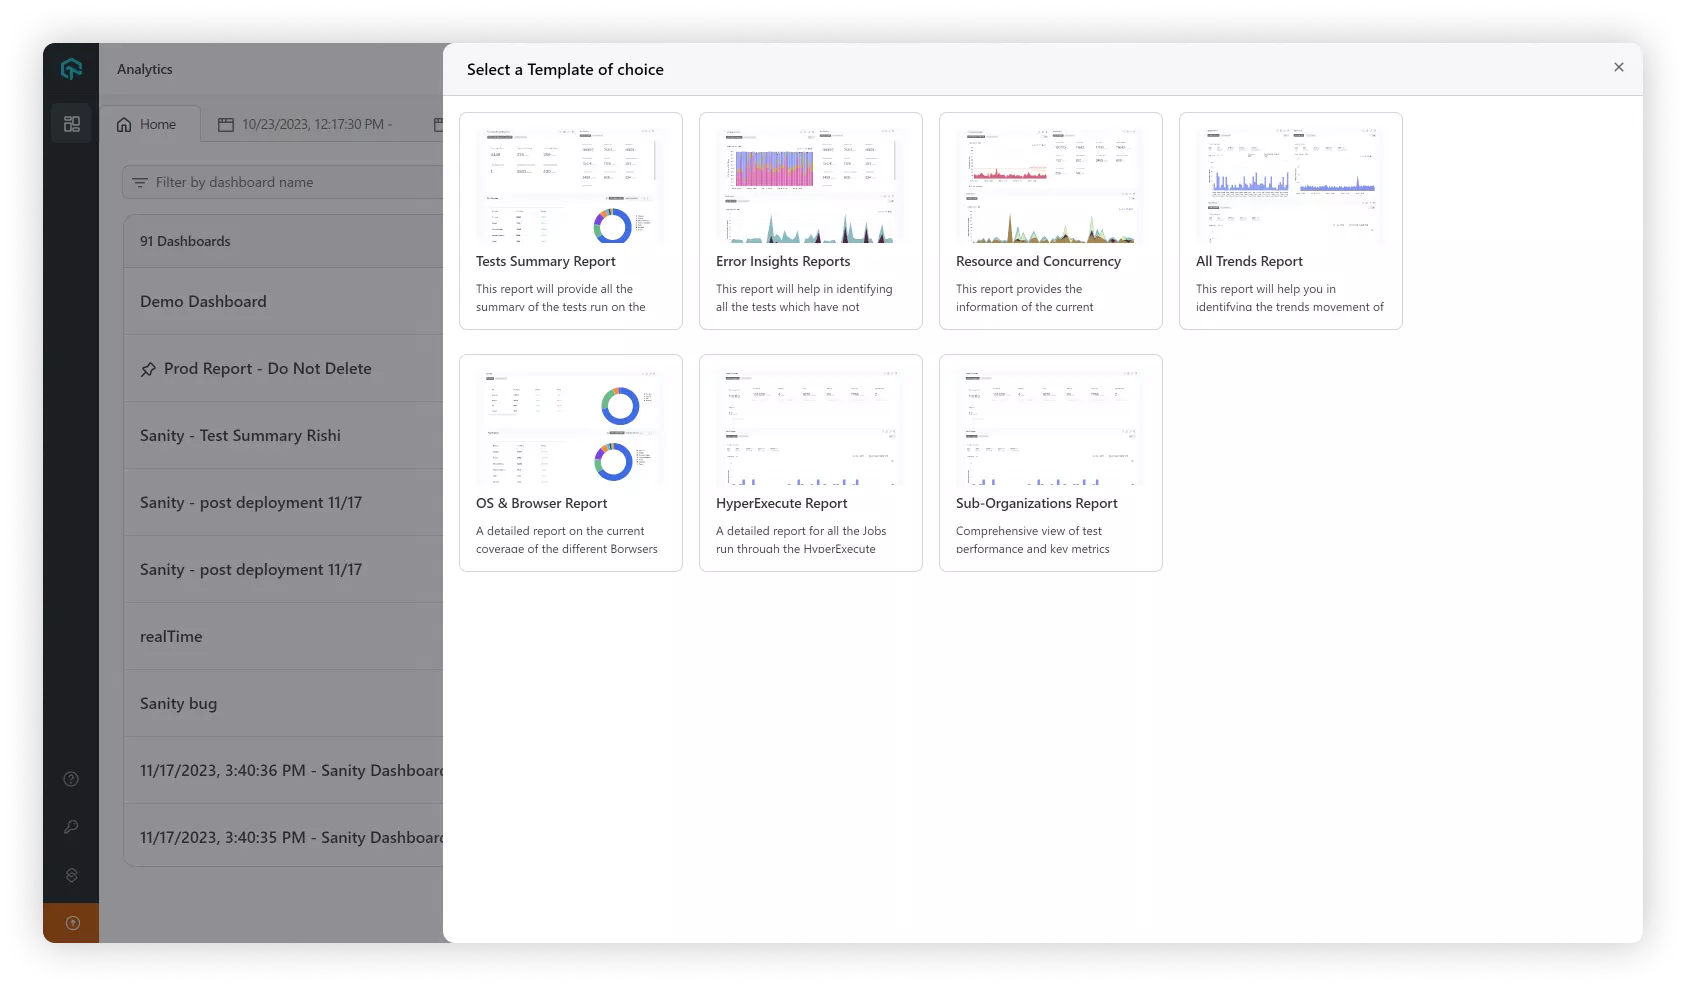
Create DashboardButton on the home page. - Select a
pre-builddashboards template based on your test analytics requirements. - Apply relevant
filtersto customize the data displayed on the dashboard. (Optional) - Review the generated dashboard with pre-associated widgets and visualizations.
Dashboard Templates Available on the platform
Tests Summary Report
The Tests Summary Report is designed to provide QA testers with a comprehensive overview of their test suite's performance and distribution. This template allows users to assess the overall health of their test suite quickly and efficiently.
By using the Tests Summary Report, QA testers can gain valuable insights into their test suite's performance and identify areas of improvement. This information helps them optimize their testing process, ensuring better test coverage and more reliable results, ultimately leading to higher-quality software products.
The following are the widgets added to this dashboard:
- Test Summary: Displays the total number of tests, their statuses, and distribution.
- Test Case Health Snapshot: Shows the health of test cases based on their pass, fail, or error statuses.
- Test Browser: Visualizes the distribution of tests across different browsers.
- Test OS: Presents the distribution of tests across different operating systems.
- Test Device Coverage (Only App Automation): Illustrates the device coverage for app automation tests.
- Jobs Summary (Only HyperExecute): Summarizes HyperExecute jobs.
- Stage Summary (Only HyperExecute): Provides a summary of HyperExecute stages.
- Tasks Summary (Only HyperExecute): Summarizes HyperExecute tasks.
The following are the use cases for the template:
- Quickly assess overall test performance and distribution to prioritize actions and allocate resources effectively.
- Monitor key testing metrics, such as test case health, browser, OS, and device coverage, to ensure comprehensive testing.
- Identify trends in test executions, enabling better planning and decision-making for future testing efforts.
- Streamline test analytics and reporting, saving time and effort for QA teams.
- Enhance collaboration between QA and development teams by sharing insights on test performance and distribution.
Error Insights Report
The Error Insights Reports template is specifically designed to help QA testers identify, analyze, and debug tests with errors status. This template enables testers to gain a deeper understanding of their test suite's error landscape, ultimately improving test reliability and robustness.
This template includes several widgets that focus on errors, such as error statistics, test status ratios, and error distributions across browsers and operating systems. The combination of these widgets allows testers to quickly spot patterns and trends related to errors, facilitating faster debugging and resolution.
Utilizing the Error Insights Reports, QA testers can pinpoint problematic areas in their test suite, leading to quicker error resolution and improved test stability. This template's insights empower testers to enhance their testing process, ultimately resulting in more reliable and higher-quality software products.
The following are the widgets added to this dashboard:
- Error Stats: Shows statistics related to errors in test statues.
- Test Status Ratio: Displays the ratio of error statuses in tests.
- Test Summary: Provides a summary of tests with errors.
- Test Case Health Snapshot: Displays the health of test cases with errors.
- Test Browser: Visualizes the distribution of errors across different browsers.
- Test OS: Illustrates the distribution of errors across different operating systems.
The following are the use cases for the template:
- Rapidly identify and resolve errors within test executions, improving overall test quality and efficiency.
- Monitor error trends to proactively address recurring issues and minimize their impact on test outcomes.
- Gain valuable insights into error patterns, leading to more effective debugging and resolution efforts.
- Improve collaboration between QA and development teams by sharing error insights and promoting a shared understanding of issues.
- Prioritize error resolution efforts based on the severity and frequency of identified issues.
Resource Consumption and Concurrency usage
The Resource Consumption and Concurrency usage template is designed to help QA testers monitor resource utilization effectively, analyze concurrency trends, and plan resource allocation. This template enables better resource management, ensuring optimal usage of available testing resources procured or to be planned for your upcoming budgets.
The template includes widgets that visualize concurrency trends, test summaries, test case health snapshots, and test distribution across browsers and operating systems. These widgets provide a comprehensive view of resource consumption and parallel thread usage, helping testers make informed decisions about resource availability trends.
With the Resource Consumption and Concurrency usage template, QA testers can optimize their testing process by effectively managing resources and ensuring that critical releases have sufficient resources allocated. This leads to a more efficient testing process, cost savings, and improved product quality.
The following are the widgets added to this dashboard:
- Concurrency Trends: Visualizes trends in resource consumption and parallel thread usage.
- Test Summary: Displays the total number of tests and their distribution.
- Test Case Health Snapshot: Shows the health of test cases based on their pass, fail, or error statuses.
- Test Browser: Presents the distribution of tests across different browsers.
- Test OS: Illustrates the distribution of tests across different operating systems.
The following are the use cases for the template:
- Optimize resource allocation by understanding the distribution of tests across different platforms and concurrency usage.
- Identify potential bottlenecks in resource consumption, allowing for better planning and management of testing efforts.
- Monitor trends in concurrency usage to ensure optimal utilization of subscribed resources.
- Improve overall testing efficiency by aligning resource consumption with testing priorities.
- Enable data-driven decision-making for resource planning and capacity management.
All Trends Report
The All Trends Report template is designed to enable QA Managers and testers to monitor and analyze trends in test performance, error statistics, and resource usage regularly. This template provides valuable insights to drive continuous improvement in the testing process.
This template features widgets that display test summaries, test case health snapshots, test distribution across browsers and operating systems, test trends, error statistics, and concurrency trends. These widgets work together to provide a holistic view of the testing process, allowing QA managers and testers to identify patterns and trends easily.
By using the All Trends Report, QA testers can gain a better understanding of their testing process's overall performance and identify areas for improvement. These insights help drive continuous improvement, resulting in more efficient testing processes, quicker error resolutions and save time in preparing these reports.
The following are the widgets added to this dashboard:
- Concurrency Trends: Visualizes trends in resource consumption and parallel thread usage.
- Test Summary: Displays the total number of tests and their distribution.
- Test Case Health Snapshot: Shows the health of test cases based on their pass, fail, or error statuses.
- Test Browser: Presents the distribution of tests across different browsers.
- Test OS: Illustrates the distribution of tests across different operating systems.
The following are the use cases for the template:
- Identify trends in test performance and execution to monitor progress and continuously improve testing efforts.
- Gain insights into test case health, browser and OS distribution, and error patterns to optimize testing processes.
- Monitor concurrency trends to ensure optimal utilization of resources and improve overall testing efficiency.
- Enhance collaboration between QA and development teams by sharing insights on test trends and performance.
- Support data-driven decision-making for resource planning, capacity management, and testing priorities.
OS and Browser Coverage Report
The OS & Browser Report is designed to provide comprehensive insights into the testing coverage across various browsers, operating systems, and devices. This report is particularly valuable for QA teams looking to ensure their applications are compatible and function seamlessly across multiple platforms, thus providing a consistent user experience.
With a collection of carefully selected widgets that display key metrics pertaining to test case health, browser and operating system distribution, and device coverage. By presenting these insights in a cohesive and easy-to-understand manner, the template allows QA teams to quickly identify areas of focus, prioritize testing efforts, and optimize resource allocation.
The following are the widgets added to this dashboard:
- Test Case Health Snapshot: Review the overall health of your test cases, enabling you to identify areas that require further attention or improvement.
- Test Browser: Analyze the distribution of test executions across different browsers, ensuring comprehensive coverage and addressing compatibility issues.
- Test OS: Gain insights into the testing distribution across various operating systems, helping you prioritize efforts and achieve better compatibility.
- Test Device Coverage (Only App Automation): Monitor device-specific testing coverage for mobile applications, ensuring seamless functionality across a wide range of devices.
- Concurrency Trends (split by OS & Browser): Examine trends in concurrent test executions, broken down by operating system and browser, to optimize resource allocation and testing efficiency.
The following are the use cases for the template:
- Identify gaps in browser and OS testing coverage, enabling targeted testing efforts and improved application compatibility.
- Monitor device coverage to ensure comprehensive testing across various devices, especially for mobile applications.
- Gain insights into test case health across browsers and operating systems, helping prioritize resolution efforts.
- Optimize resource allocation by understanding the distribution of tests across different platforms.
- Enhance collaboration between QA and development teams by sharing browser and OS-specific insights.
HyperExecute Report
The HyperExecute Report template is meticulously designed to cater to the sophisticated requirements of large corporations and enterprises, providing QA managers with an in-depth analysis of all jobs executed through the HyperExecute platform. This template empowers users to effortlessly assess job performance, tasks, and stages with a comprehensive and efficient view, ensuring streamlined testing processes and improved operational efficiency.
The HyperExecute Report template comprises a suite of pre-defined, high-impact widgets that deliver crucial insights related to job insights, task trends, stage trends, job summaries, task summaries, stage summaries, task status summaries, and error statistics. These widgets are expertly crafted to work in harmony, offering a crystal-clear and detailed representation of HyperExecute jobs, enabling QA managers to effectively oversee and optimize their testing processes on the platform.
By leveraging the HyperExecute Report template, QA managers at large enterprises can uncover invaluable insights into the performance of jobs executed on the platform. This knowledge allows them to identify and eliminate bottlenecks, optimize task distribution, and significantly enhance overall test execution efficiency. Consequently, QA managers can drive accelerated test execution times, minimize resource consumption, and deliver industry-leading, high-quality software products that meet the rigorous demands of today's technological era.
The following are the widgets added to this dashboard:
- Job Insights: Gain a comprehensive understanding of each job's performance, helping you identify areas of improvement and optimize your test execution process.
- Task Trends: Analyze the historical trends of tasks within your jobs, allowing you to pinpoint patterns and make data-driven decisions to enhance efficiency.
- Stage Trends: Evaluate the progress and performance of various stages within your jobs to ensure seamless execution and identify potential bottlenecks.
- Job Summary: Obtain a high-level overview of all jobs executed on the platform, enabling you to quickly assess their status and prioritize actions accordingly.
- Task Summary: Review a concise summary of all tasks within your jobs, helping you monitor their progress and allocate resources effectively.
- Stage Summary: Get a snapshot of each stage within your jobs, allowing you to track their performance and make informed decisions for continuous improvement.
- Task Status Summary: Stay informed about the current status of all tasks, enabling you to proactively address any issues and maintain a smooth testing process.
- Error Stats: Identify and analyze errors within your jobs, providing valuable insights for faster debugging and resolution, ultimately resulting in more reliable and higher-quality software products.
The following are the use cases for the template:
- Gain comprehensive insights into job performance, helping identify areas of improvement and optimize test execution processes.
- Analyze task and stage trends within jobs to pinpoint patterns and make data-driven decisions for enhanced efficiency.
- Evaluate the progress and performance of various stages within jobs, ensuring seamless execution and identifying potential bottlenecks.
- Obtain a high-level overview of all jobs executed on the platform to assess their status and prioritize actions accordingly.
- Assess the efficiency of HyperExecute workflows by analyzing job, task, and stage summaries, enabling continuous optimization and improved test execution times.
