Command Logs Analytics with Test Intelligence
Introduction to AI Native Command Logs Analytics
TestMu AI Analytics help you intelligently analyze your test execution steps on the platform. It provides you with the insights on the errors that are causing your test runs to fail.
Prerequisites for using Command Logs Analytics
The following are the steps to use Command Logs Analytics:
- You should have a TestMu AI account. If you don't have one, you can sign up here.
- You should have access to the
Test Intelligencesubscription plan. You can join the waitlist here. - Go to
Analyticsfrom the left navigation menu and create a new Dashboard by clicking on theCreate New Dashboardbutton. - Select the
Create Custom Dashboardoption from theCreate New Dashboarddropdown. - Select the
Command Logsoption from theAnalytics Modulessection. - Click on
Addfor the widgets required to your dashboard. - Input your
Dashboard Nameand click onCreate Dashboardto create your dashboard.
Command Status Summary Widget BETA
About the Widget
The Command Logs Status Summary Widget offers a summary of the response statuses for Selenium commands executed on the platform. This is visualized using a tree map, giving a quick and clear overview of the system's status.
Widget Simulation
A tree map is shown with each rectangle representing different command response codes. The size of each rectangle corresponds to the number of commands with that response code. This gives you a visual representation of the overall system health at a glance.
Use Cases
- Quickly identifying the system's health status
- Monitoring status codes over a specific timestamps
- Tracking system performance and identifying potential issues
- Analyzing command logs status distribution
- Filtering and focusing on specific response codes for further investigation
Command Error Status Trends Widget BETA
About the Widget
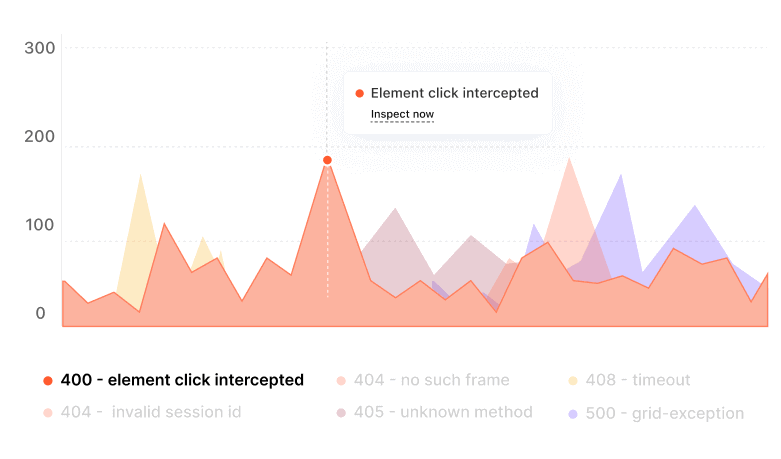
The Command Logs Status Trends Widget provides a time-series representation of command log HTTP response statuses. It groups tests with similar response statuses for a clearer view of the system's health and performance trends.
Widget Simulation
A line or bar chart is displayed with the x-axis representing the timestamp of the tests run and the y-axis representing the total number of unique errors in tests with command logs of respective response statuses.
Use Cases
- Tracking response status trends over time
- Identifying periods of increased error response codes
- Evaluating system health based on response status trends
- Comparing system performance over different periods
- Analyzing the frequency of retries or error status codes over time
Command Type Trends Widget BETA
About the Widget
The Command Logs Type Trends Widget shows the trends of endpoint usage over time by displaying the count of commands for each command name mapped to the endpoint/request path. It helps to identify potential system bottlenecks and optimization opportunities.
Widget Simulation
A horizontal bar chart is shown with the y-axis representing the W3C command name and the x-axis showing the count of commands. The command response codes are stacked on each bar for further granularity.
Use Cases
- Identifying the most frequently used command types
- Discovering potential bottlenecks in specific command types
- Comparing usage of different command types
- Tracking changes in command type usage over time
- Correlating command type usage with system performance
Command Error Messages Categorization Widget BETA
About the Widget
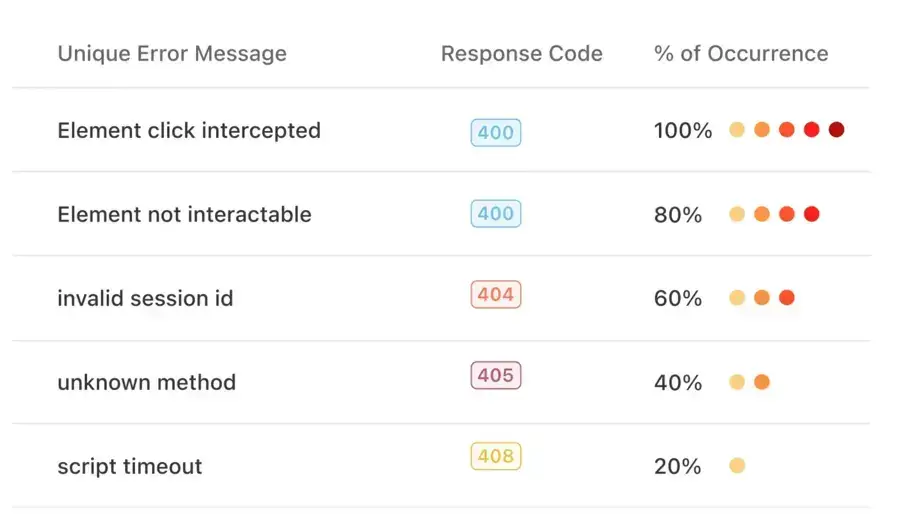
The Command Logs Error Messages Categorization Widget categorizes error messages from command logs, allowing users to identify common issues and prioritize bug fixes.
Widget Simulation
A table displays unique error messages, occurrences dots, the percentage of occurrences, the timestamp of the last error message, and tests with the error message command logs.
Use Cases 6. Identifying common error messages for prioritizing bug fixes 7. Tracking the frequency of specific error messages 8. Analyzing the proportion of error messages in the total commands 9. Finding correlations between error message occurrences and system performance 10. Inspecting tests with specific error messages for debugging
