Version 2.8.4
🚀 New Feature: Enhanced Left-Side Test List View for Cypress
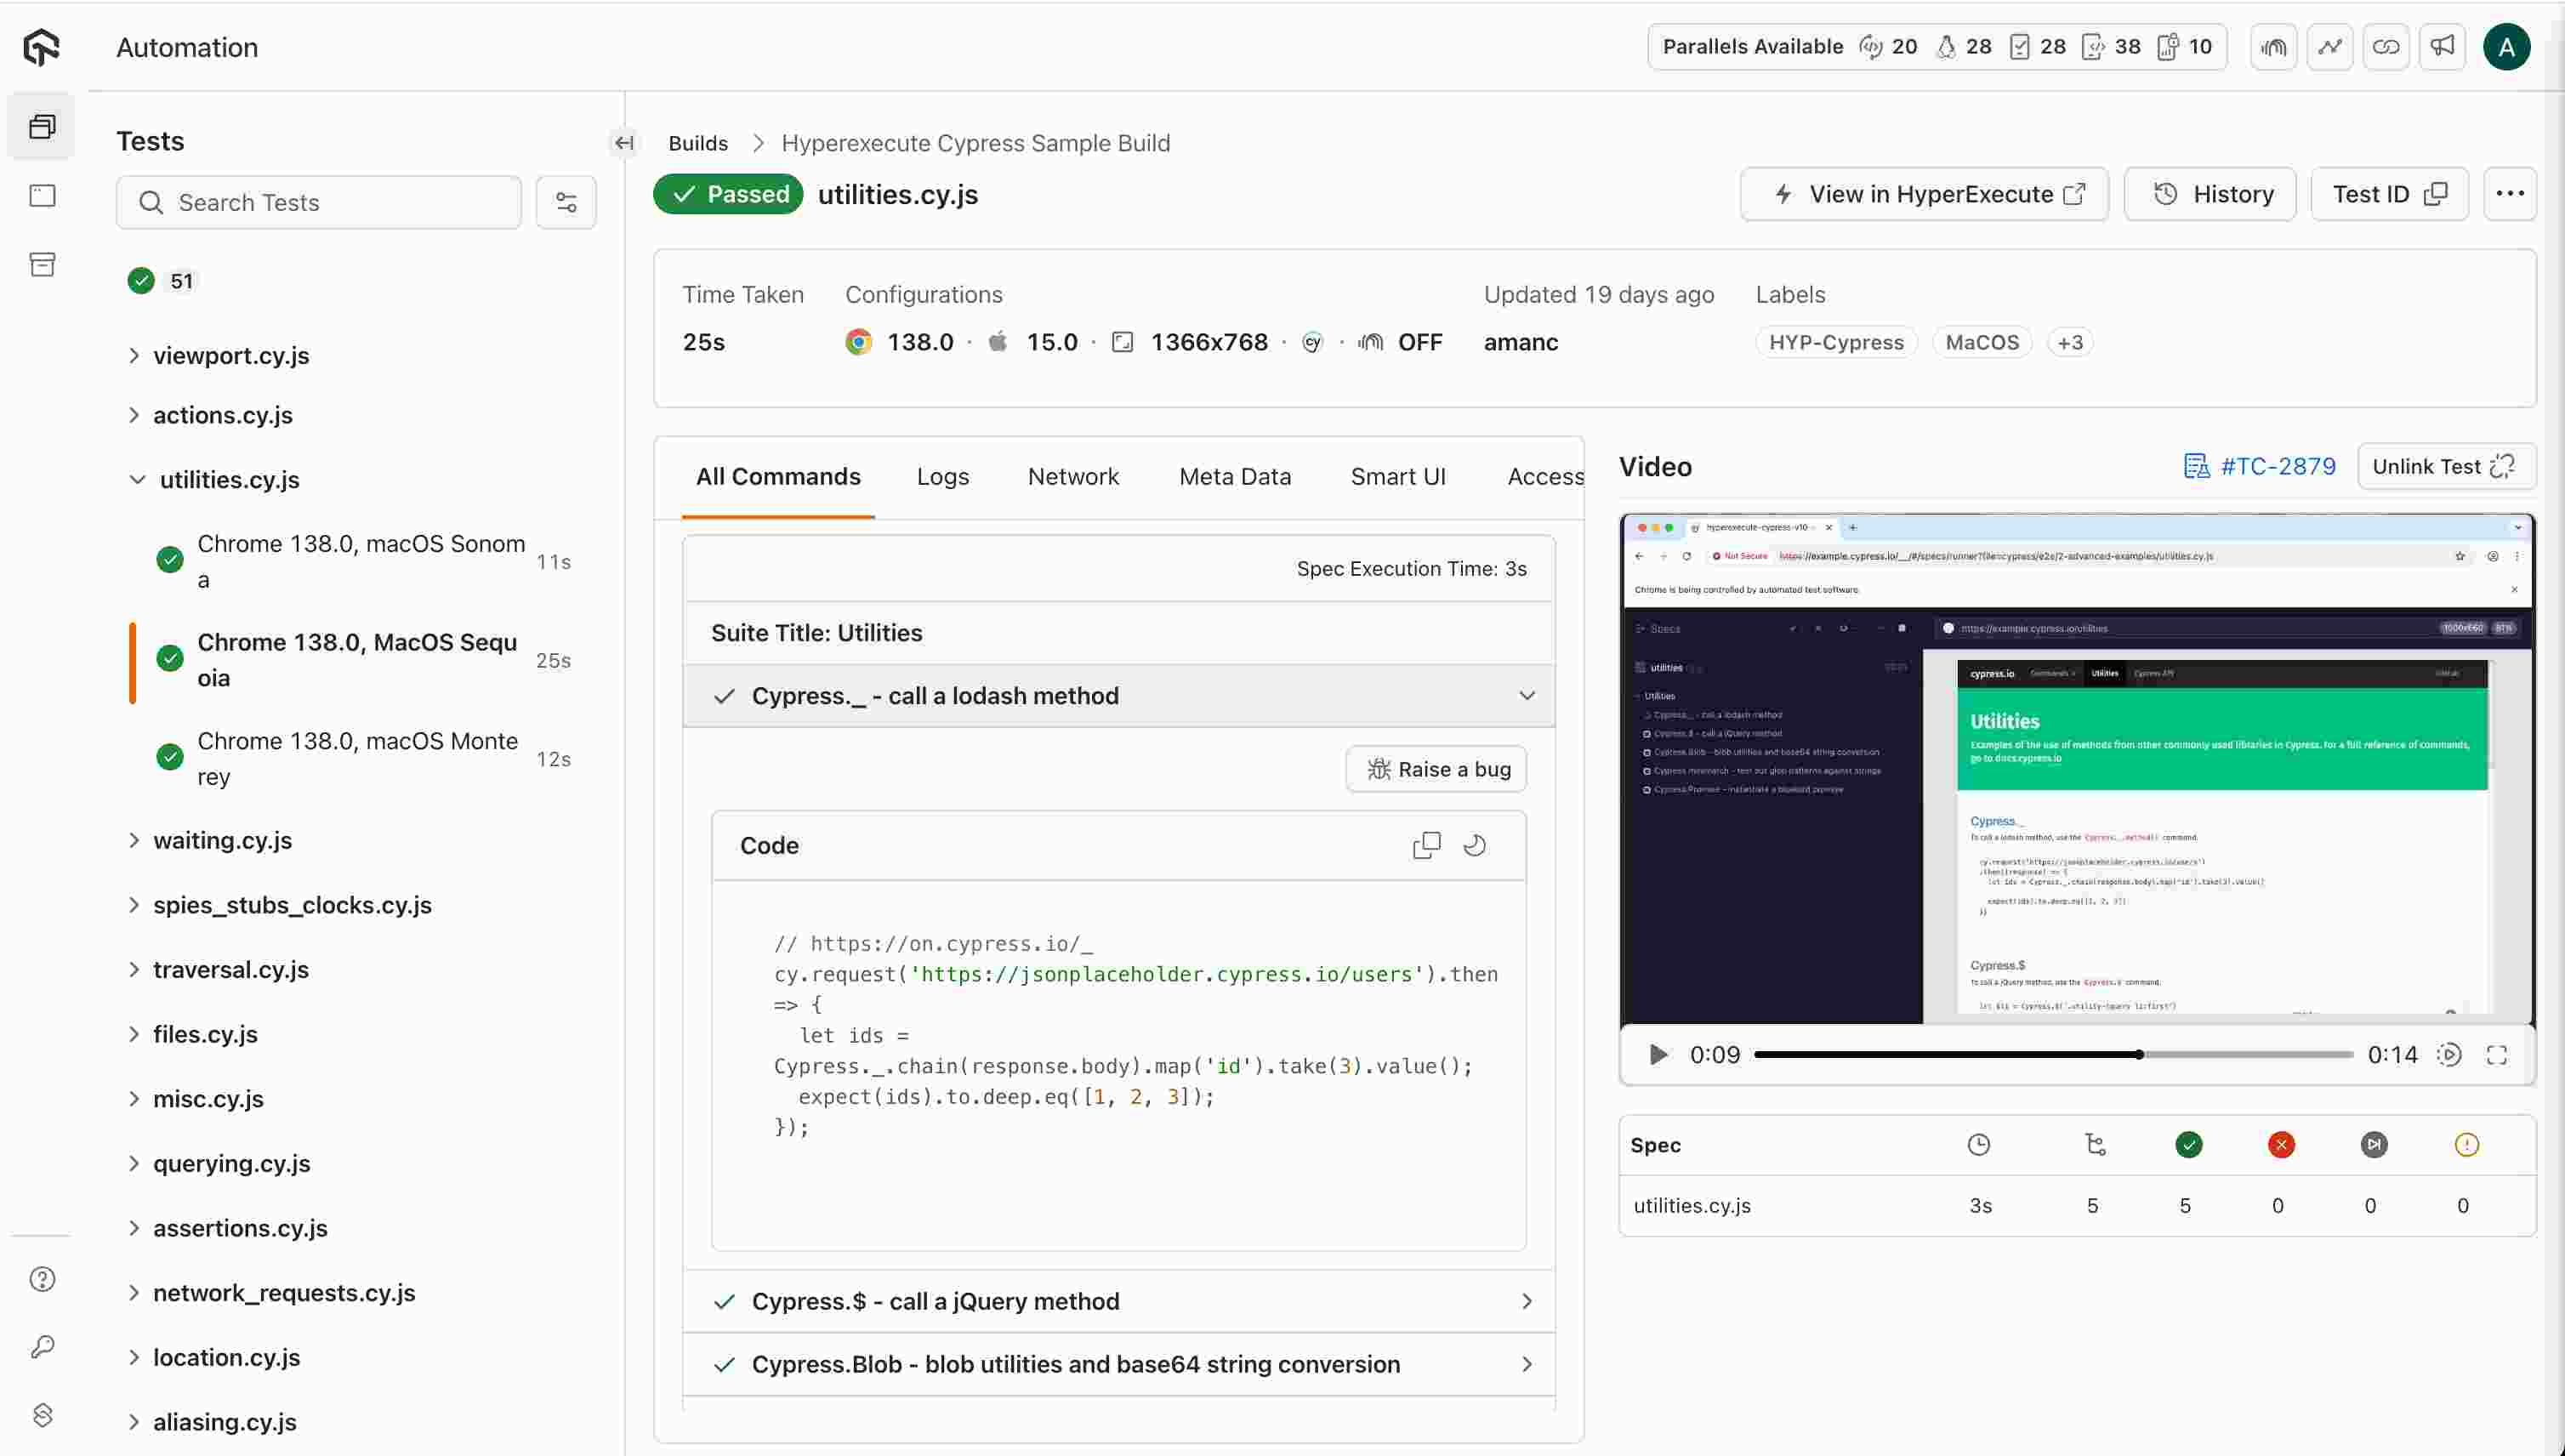
We’re excited to announce the launch of a brand-new Left-Side Test List View in the HyperExecute Automation Dashboard, tailored specifically for Cypress test executions. This enhancement is designed to provide users with a more intuitive, informative, and actionable interface for navigating and debugging their Cypress automation builds.
🔍 Overview
The new left-side panel now displays a vertical list of executed Cypress spec files within each build, making it easier than ever to:
- Understand the status of individual test files at a glance.
- Navigate between test files quickly.
- Debug failed or skipped tests efficiently.
- Monitor execution time per file. This feature significantly improves user experience by streamlining test result analysis and accelerating troubleshooting.
✅ Key Features Implemented
1. Test File Listing
- Each Cypress spec file (e.g., actions.spec.js, tunnel.spec.js) is displayed in a clean vertical list.
- Files are grouped under their corresponding build for better context.
- Sorted by execution start time to reflect chronological order.
2. Status Indicators
- Green checkmark (✔️): Test passed successfully.
- Red cross (✖️): Test failed.
- Yellow clock (⏳): Test is currently running (real-time updates).
- Grey icon (–): Test was skipped or not executed.
✅ Statuses are clearly visible and consistent across both the Build Summary page and individual Test Run pages.
3. Execution Time Display
- Execution duration shown next to each test file.
- Time format adapts based on length:
- 25s (seconds)
- 2m 59s (minutes and seconds)
✅ Times like 2m 59s, 35s, and 44s are accurately rendered in UI as expected.
4. Search and Filter
- A dedicated “Search Tests” bar is available at the top of the test list.
- Users can filter test files dynamically by filename for faster navigation.
🧪 Use Cases & Benefits
| Use Case | Benefits |
|---|---|
| Quickly identifying failed tests | Streamlined debugging process |
| Monitoring execution time per file | Better performance tracking |
| Searching through long test lists | Improved productivity and usability |
| Viewing real-time test statuses | Enables proactive monitoring during CI/CD |
📌 Accessing the Feature
This feature is enabled by default for all Cypress-based test executions on HyperExecute. Simply navigate to your Automation Dashboard , select a Cypress build, and view the enhanced left-side test list in the Build Summary or individual Test Run views.