How to Debug a Failed Job
As a developer or tester, you know that running tests is an essential part of the software development process. However, there are times when your tests may fail, and you may not be sure how to debug the issue, and you find yourself scratching your head, wondering what went wrong.
The HyperExecute Dashboard provides a central view of all your test runs, including the test results, error logs, and performance metrics. By understanding how to find and interpret error logs, you can quickly identify the root cause of a failed test and take steps to fix the issue. This document will help you debug failed tests on HyperExecute by finding error logs in different stages using the HyperExecute Dashboard.
Prerequisites
- HyperExecute Dashboard Access.
- A Job is triggered on HyperExecute, and it has a
Failedstatus. - Identify which Task has failed. Click on that task and check which of the Stage categories is throwing an error.
Pre Steps
You can see in the screenshot mentioned below that the Pre Step of the Task has failed. To understand the issue causing the step to fail, scroll down, go through the logs once, and you can find the type of error and its location in the code as well.
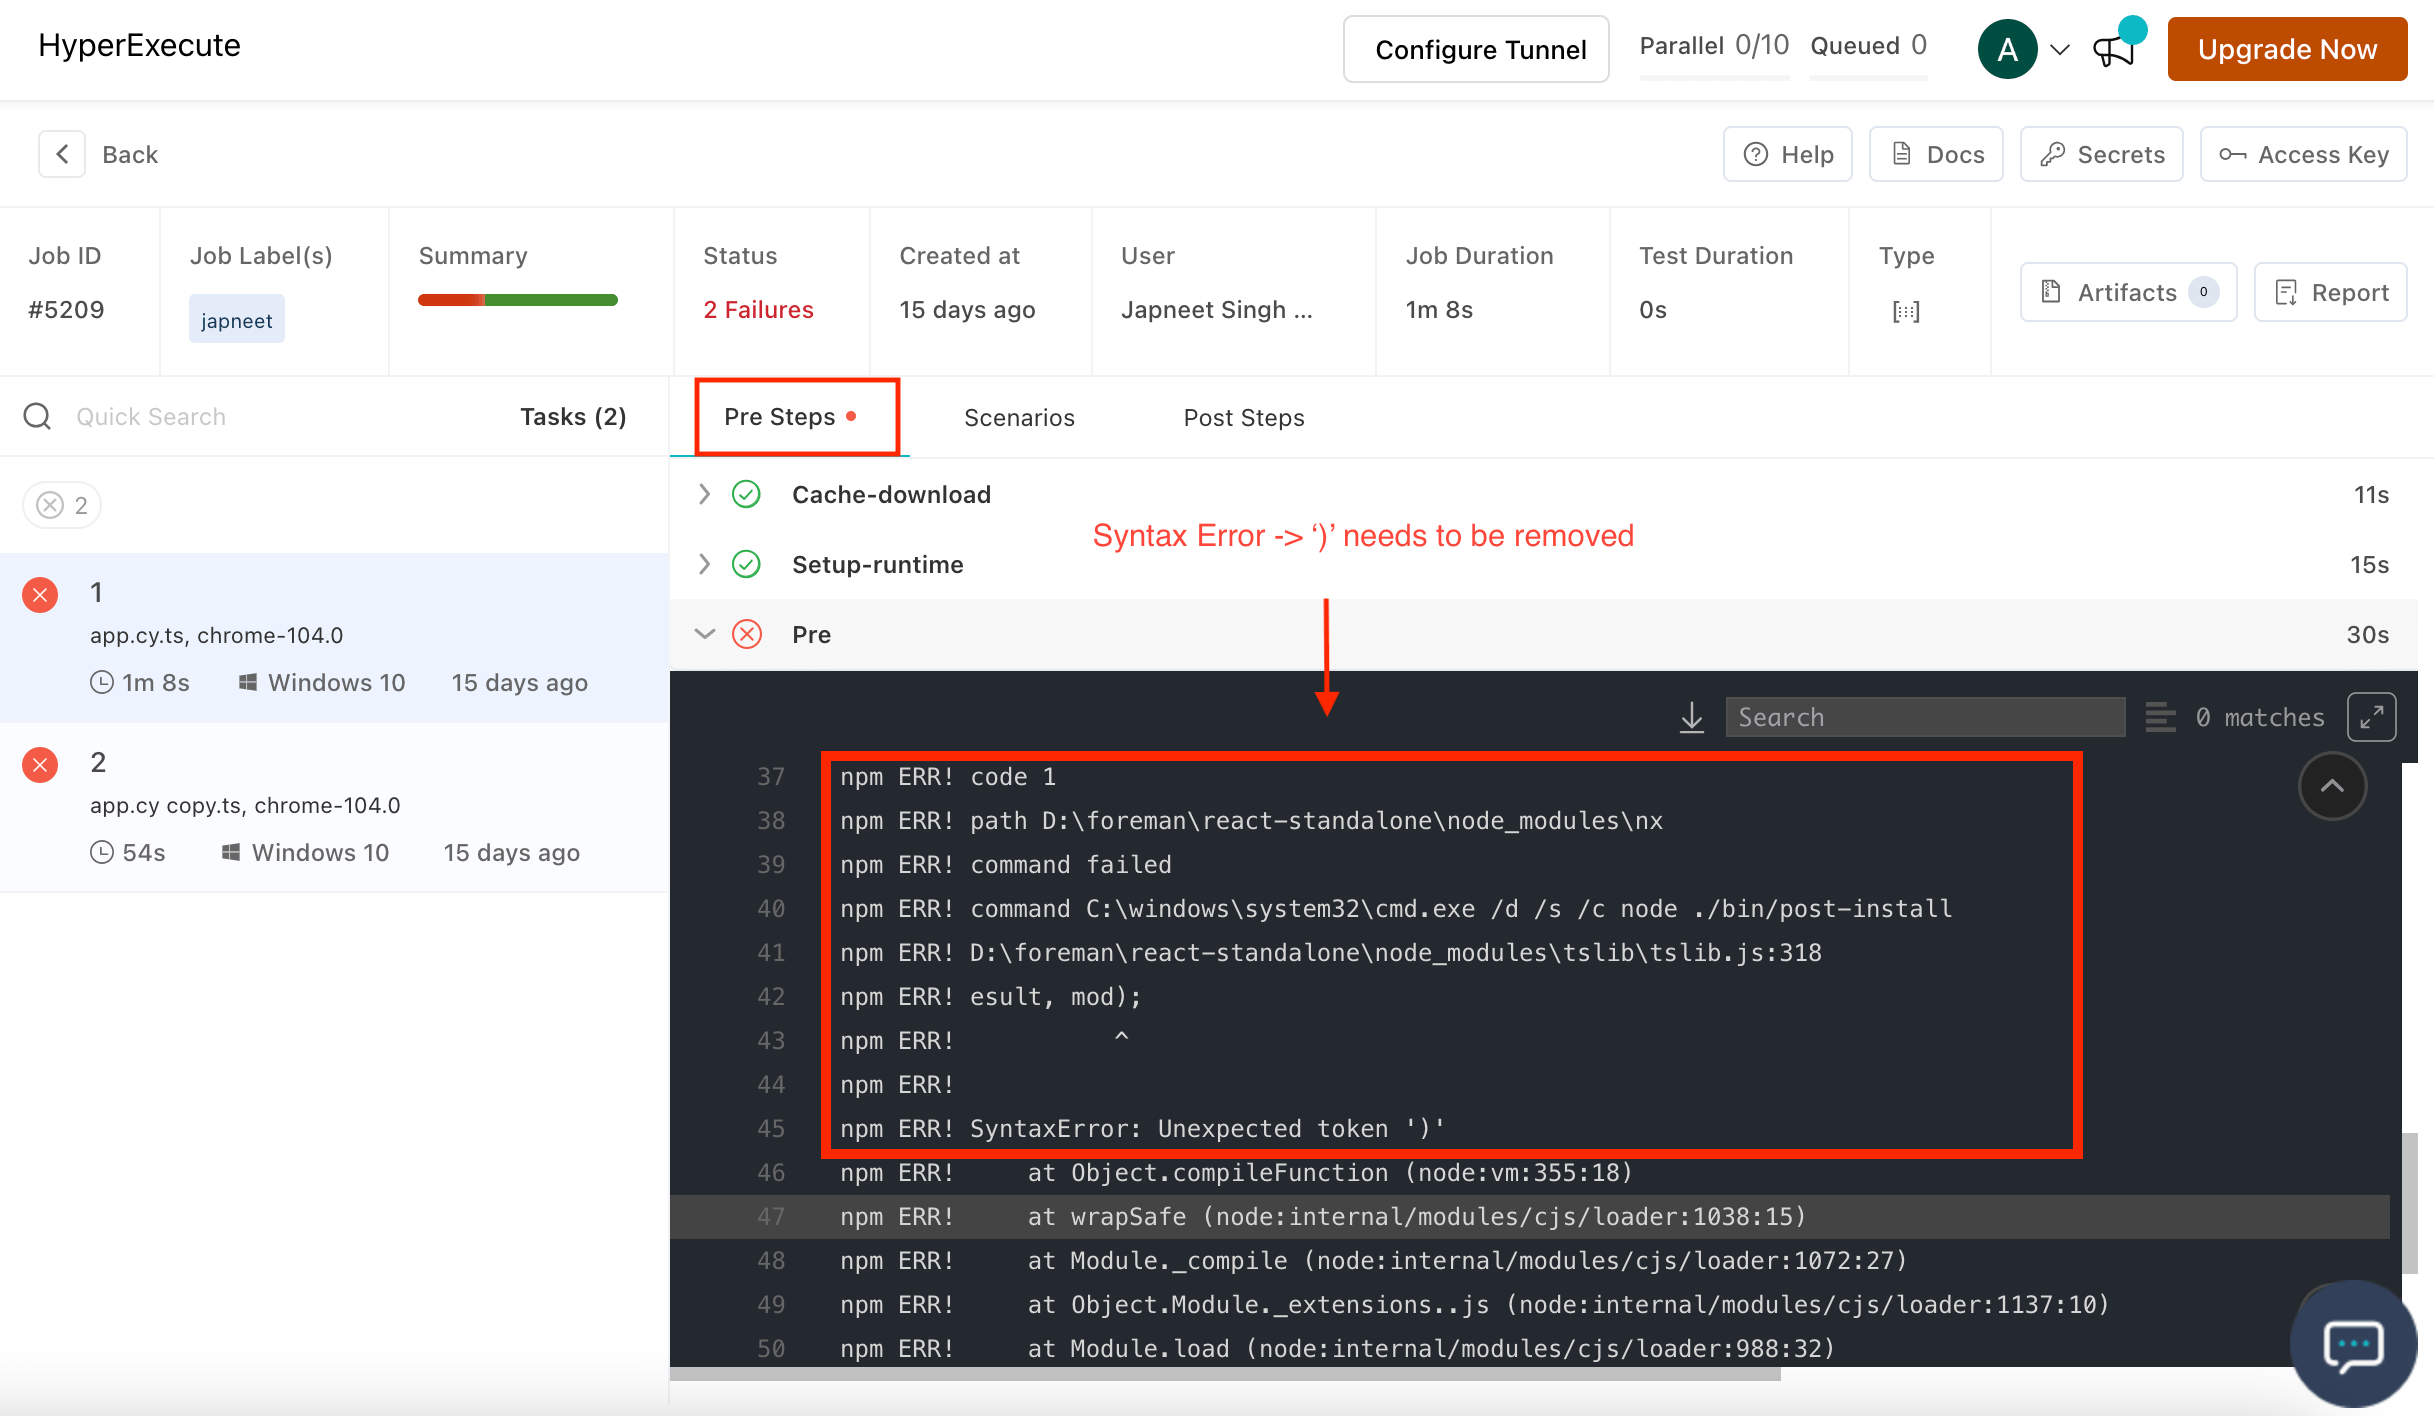
NOTE : During the execution of pre-commands, you might come across different issues. To troubleshoot and resolve these issues, please refer to the relevant solutions provided on this page.
Scenarios
To check the issues caused in the Scenario Step, there are multiple ways to find the issue. Let's explore each way:
Checking the Logs
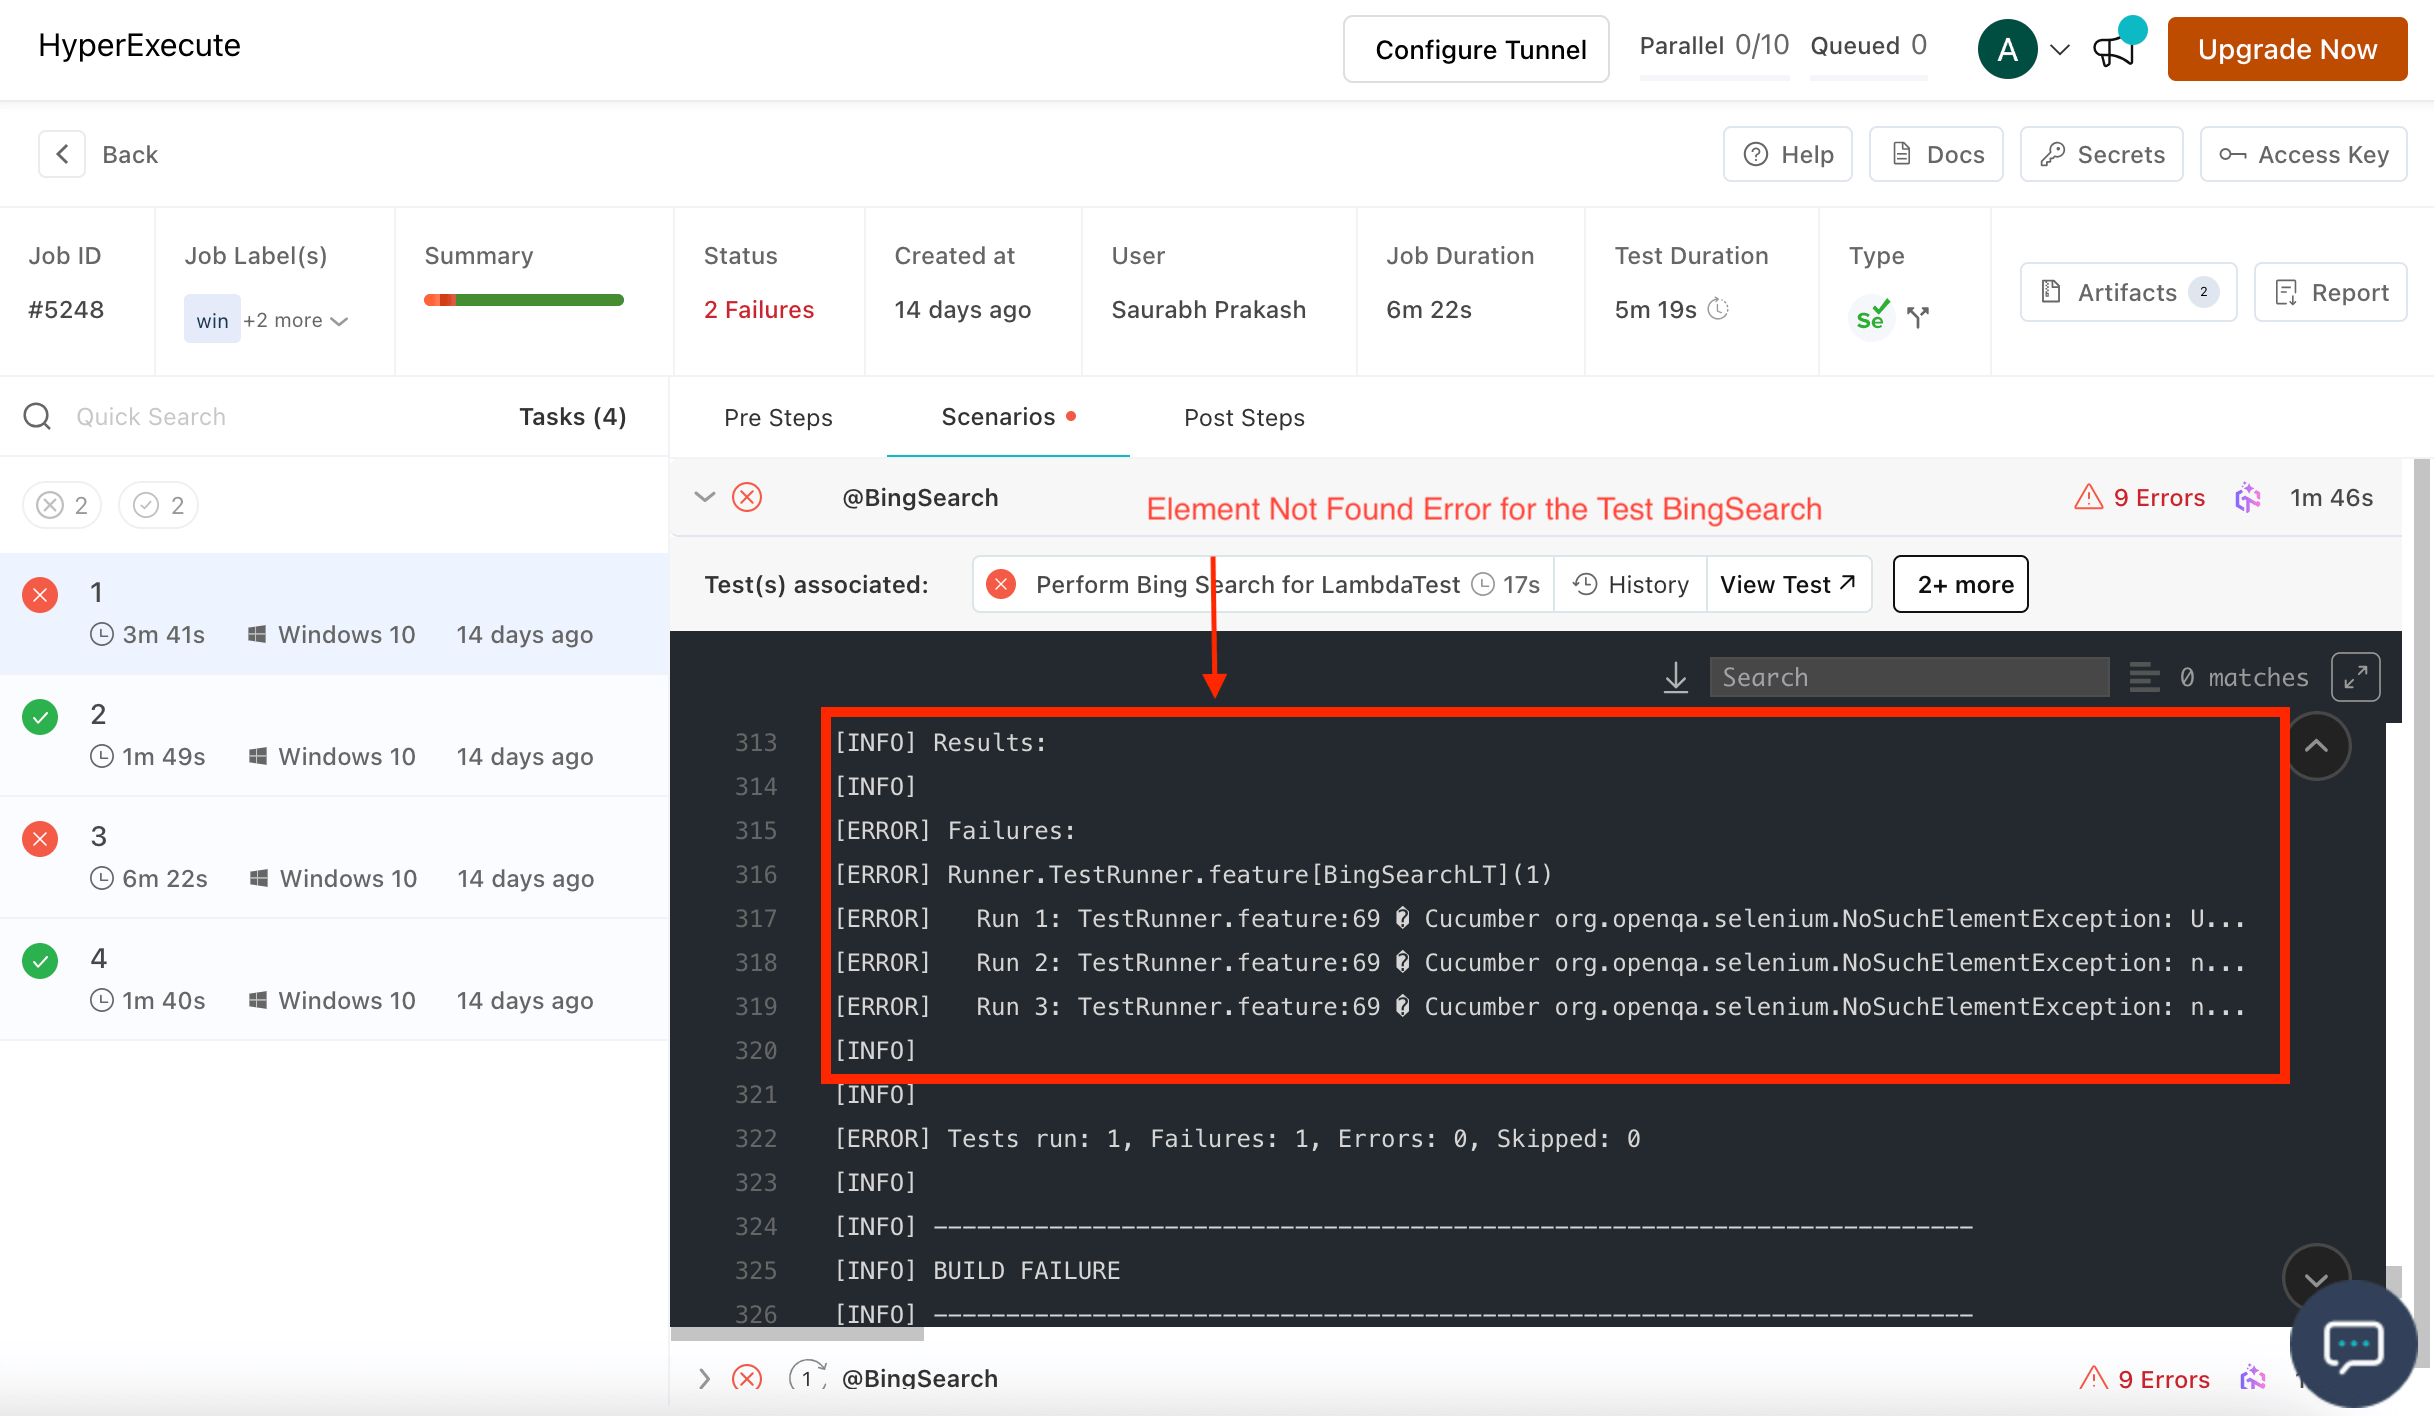
To check the logs, you need to expand the test case that has failed in the scenario. Go through the logs once until the end, and you will encounter the reason for the test failure.
In the given screenshot, we are encountering an Exception Error that No Such Element Found for the Test Case @BingSearch and it can be due to the wrong path entered in the code file or that particular Feature Case is not present in the code directory.
Video Recordings and Command Logs
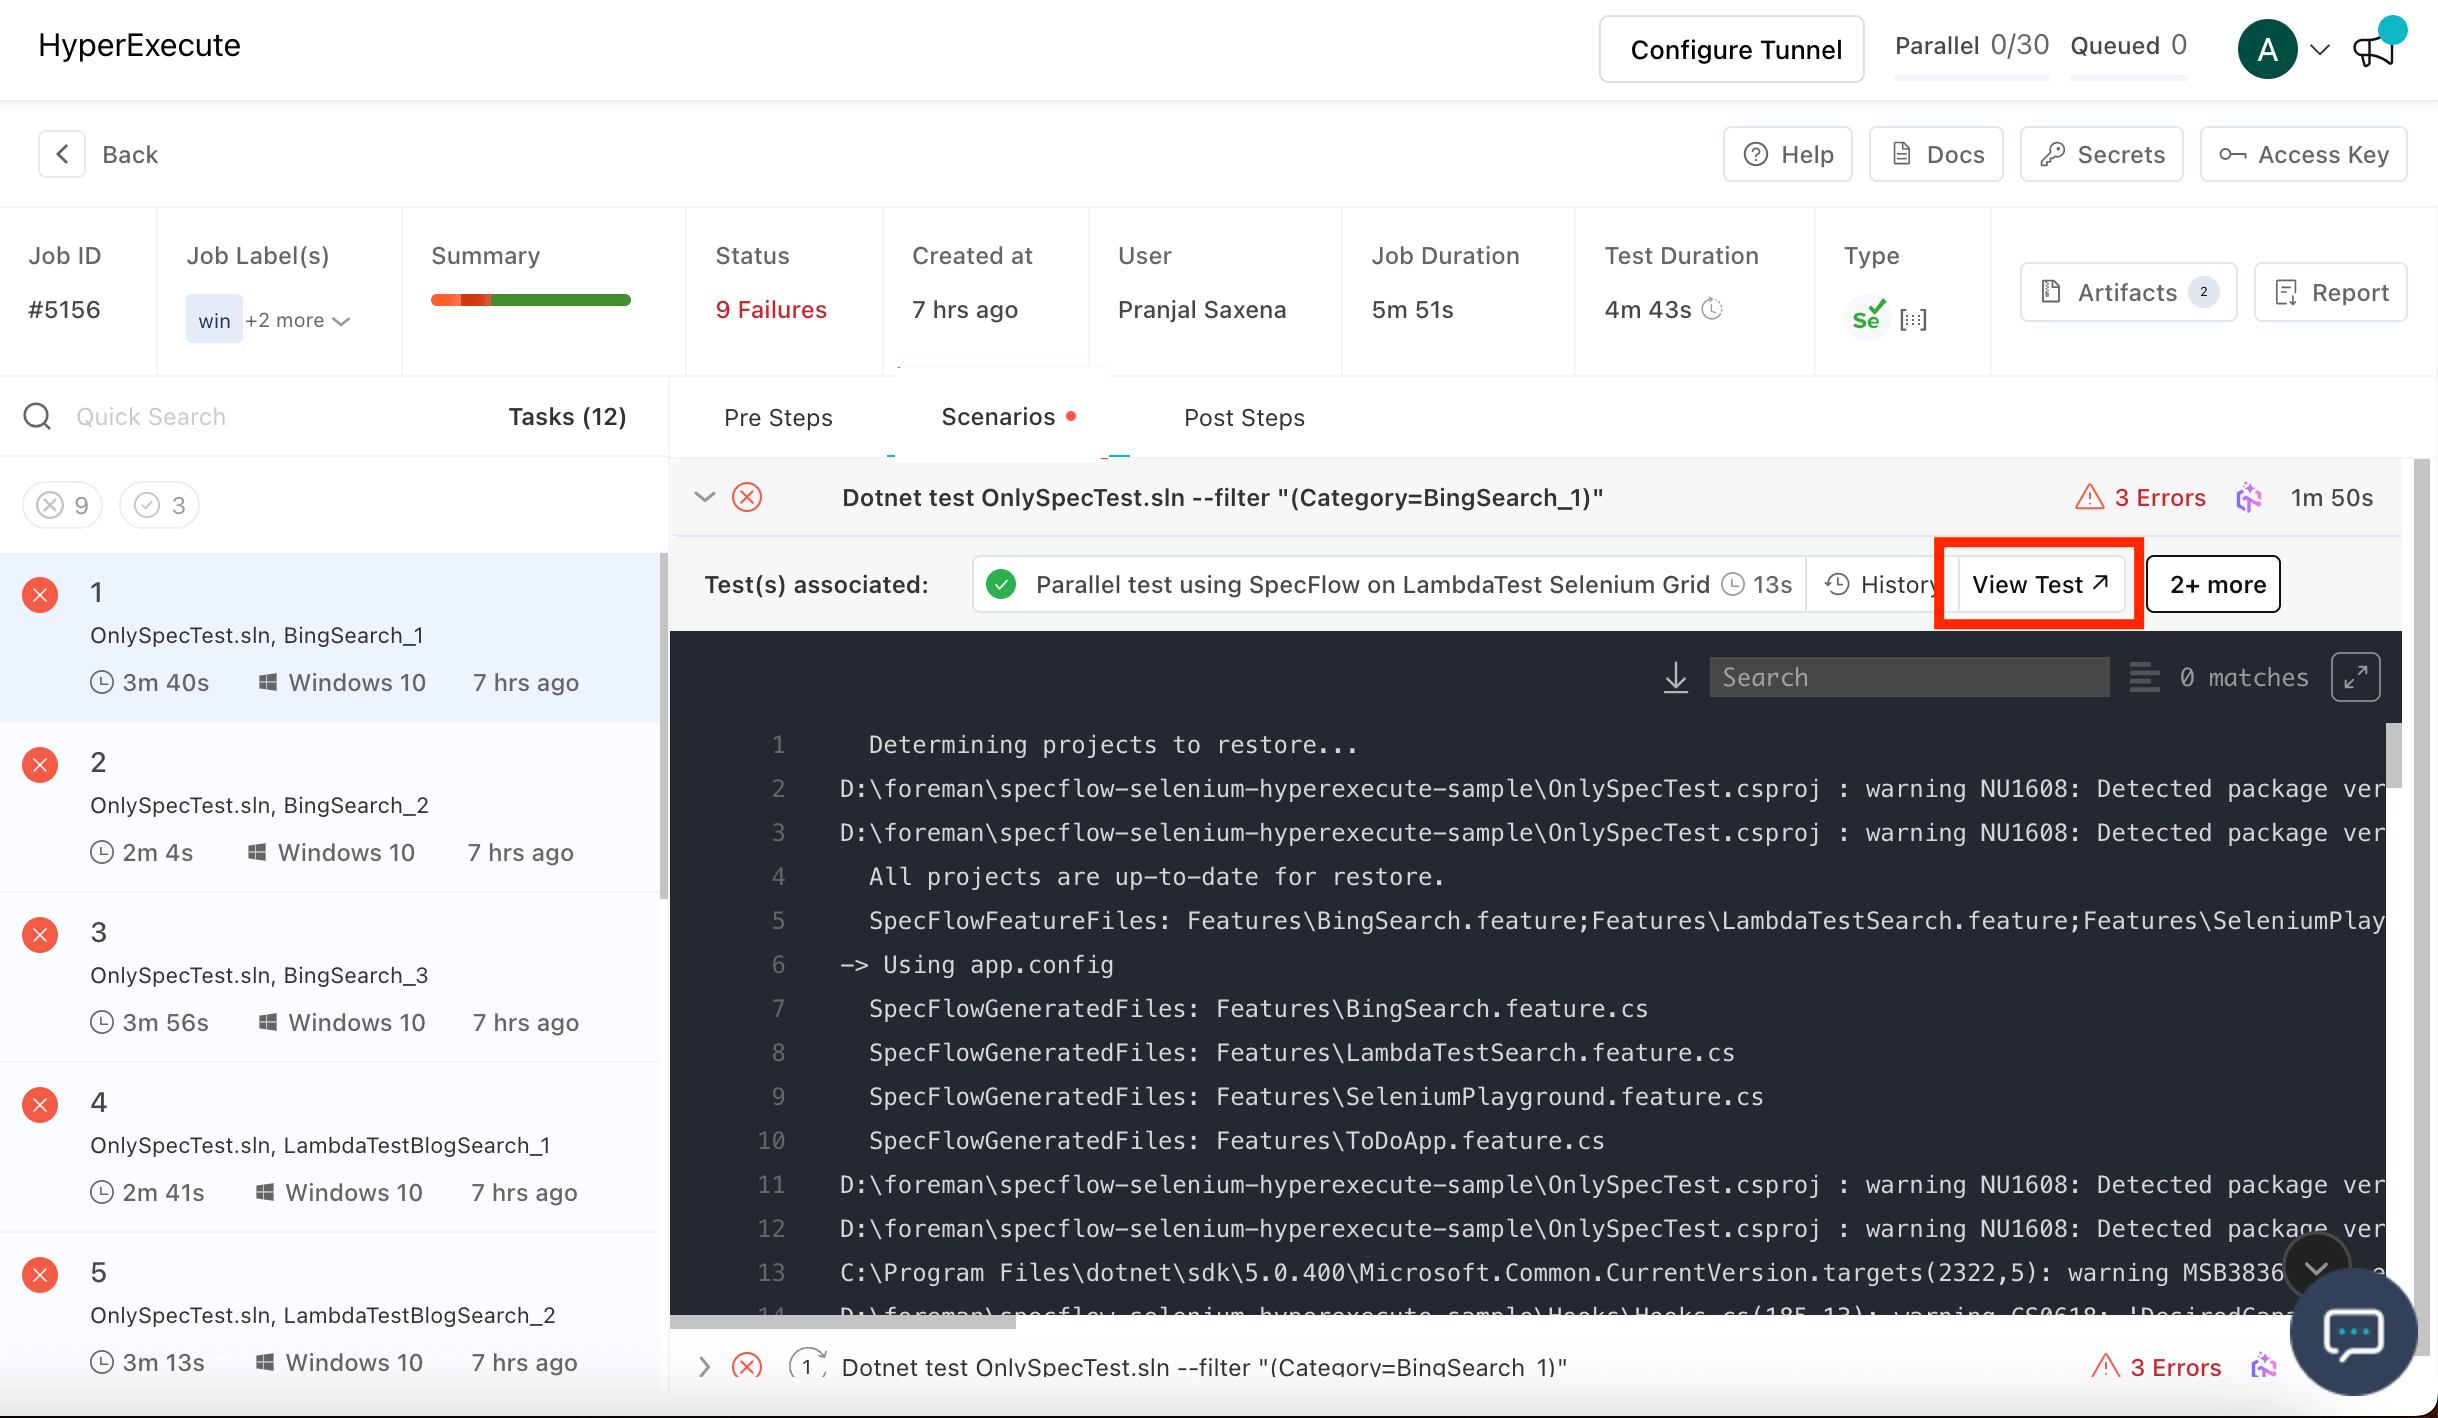
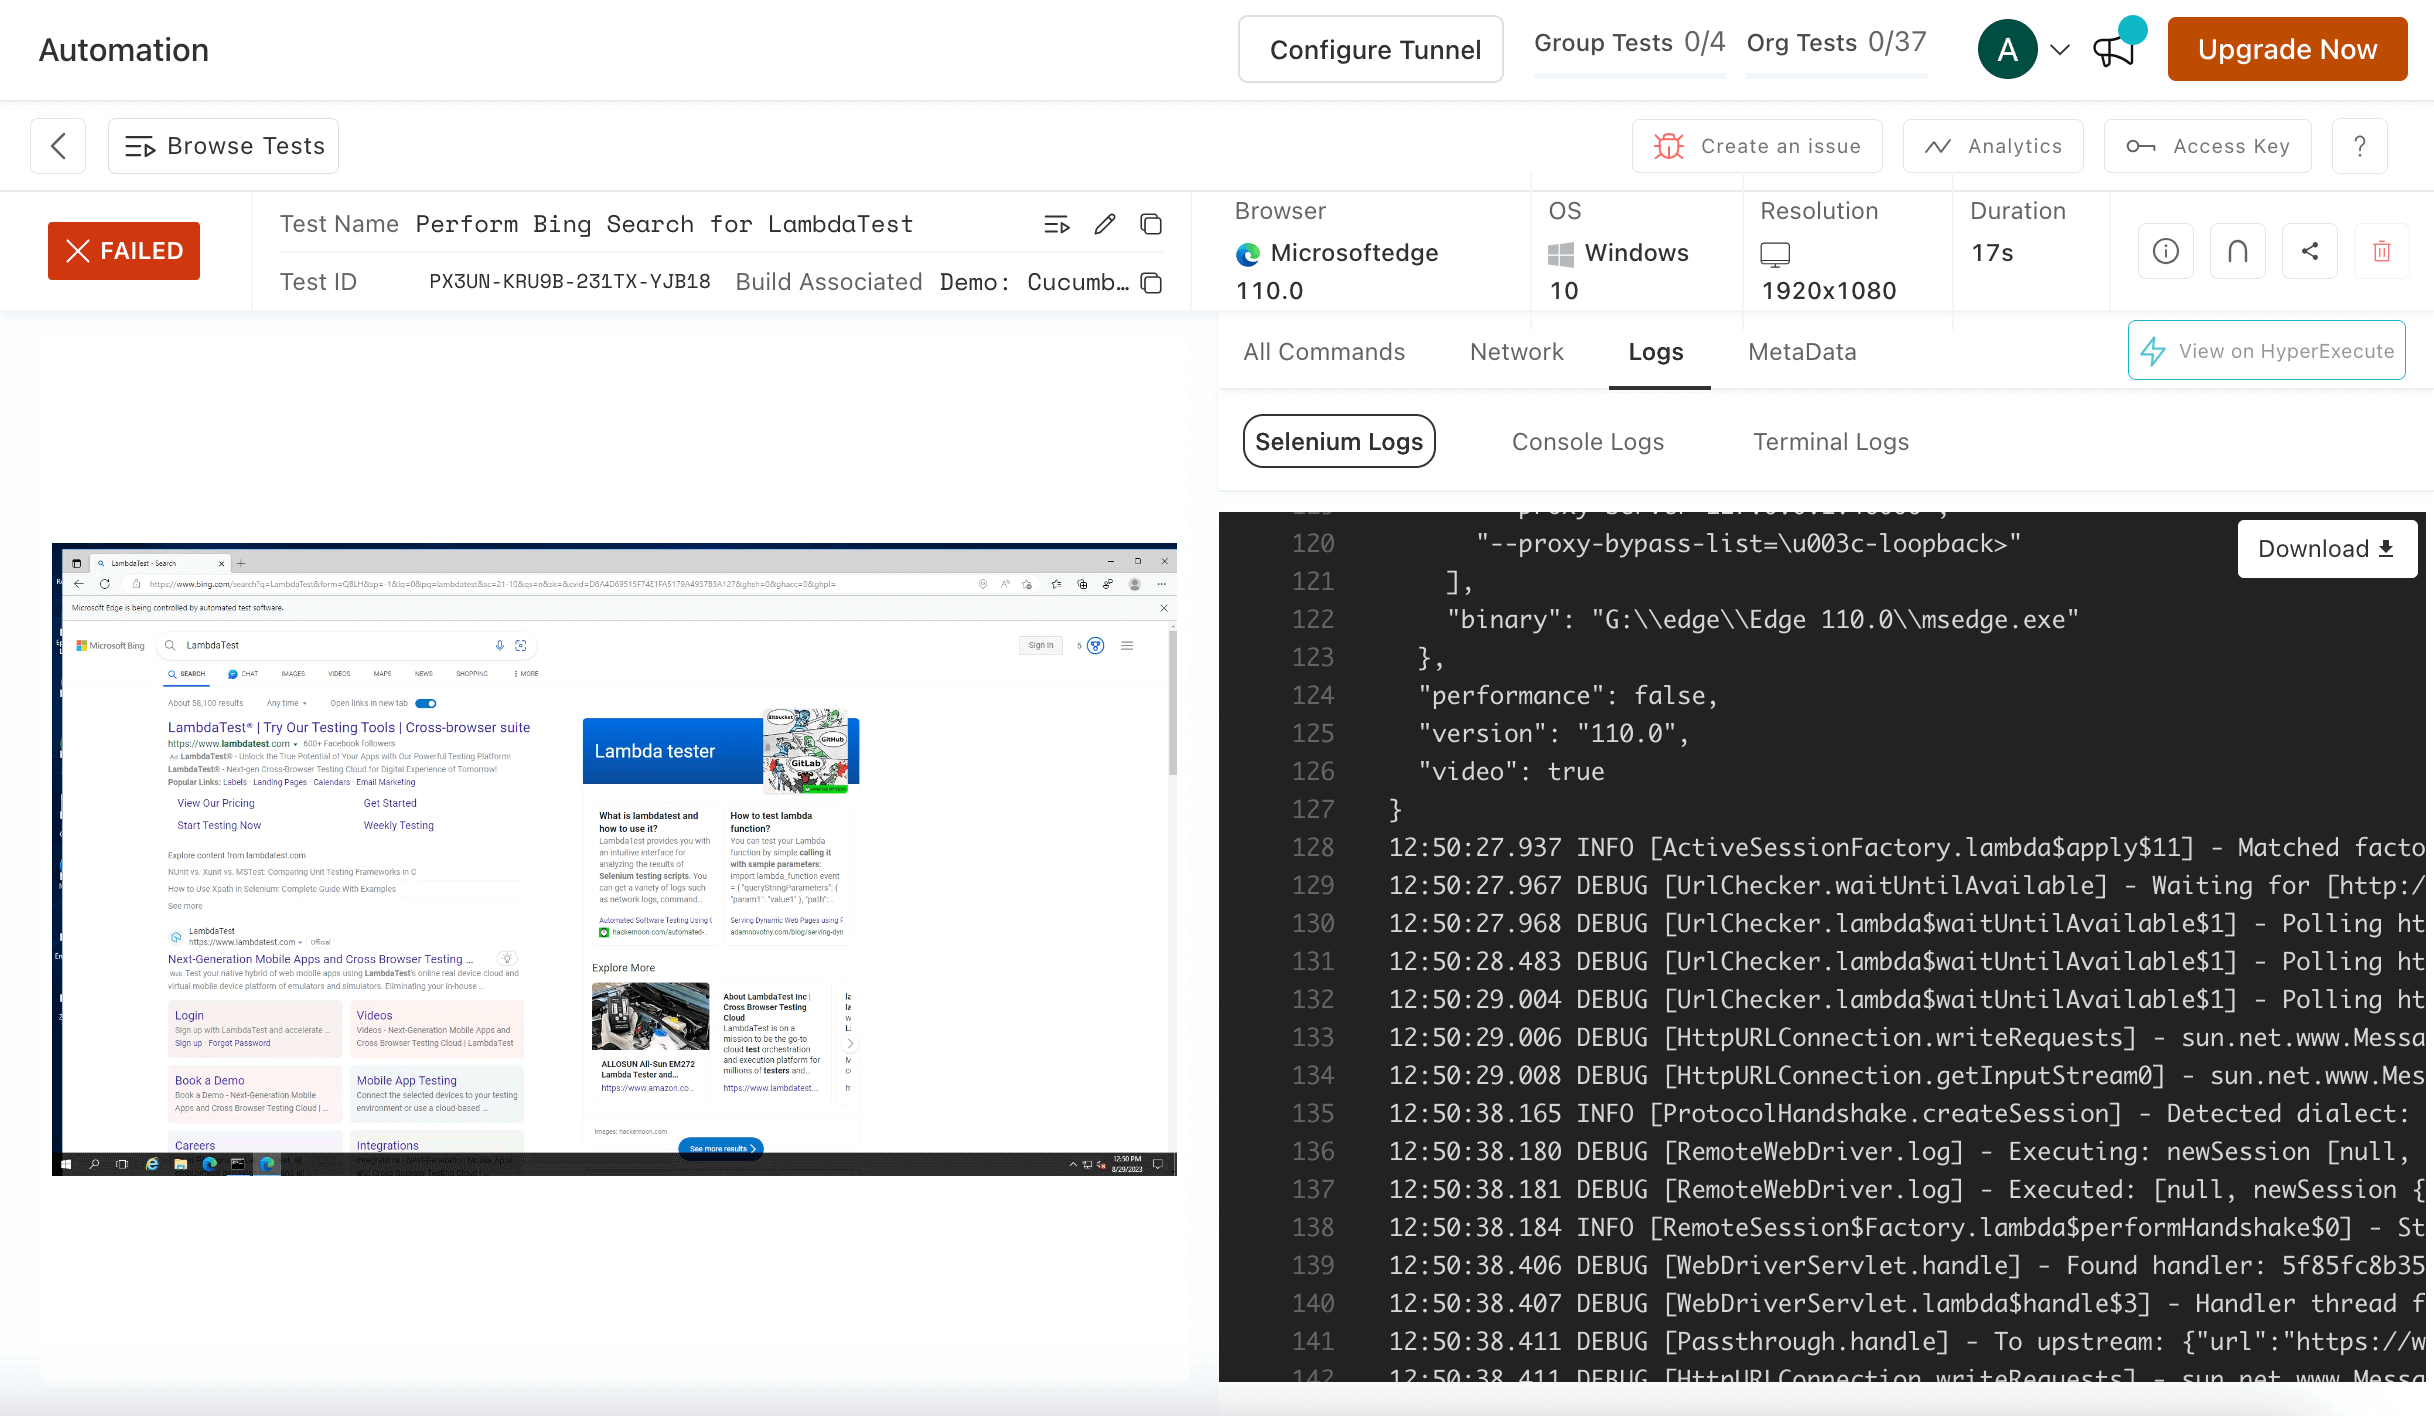
If you were unable to find the error and want a deep analysis of it, then you can click on the Test Associated button or the View Test button.
Video Recording
Here you can check which part of your test case is causing an error in the video format, along with the required logs to check at which timestamp you are encountering this error and what the reason behind it is.
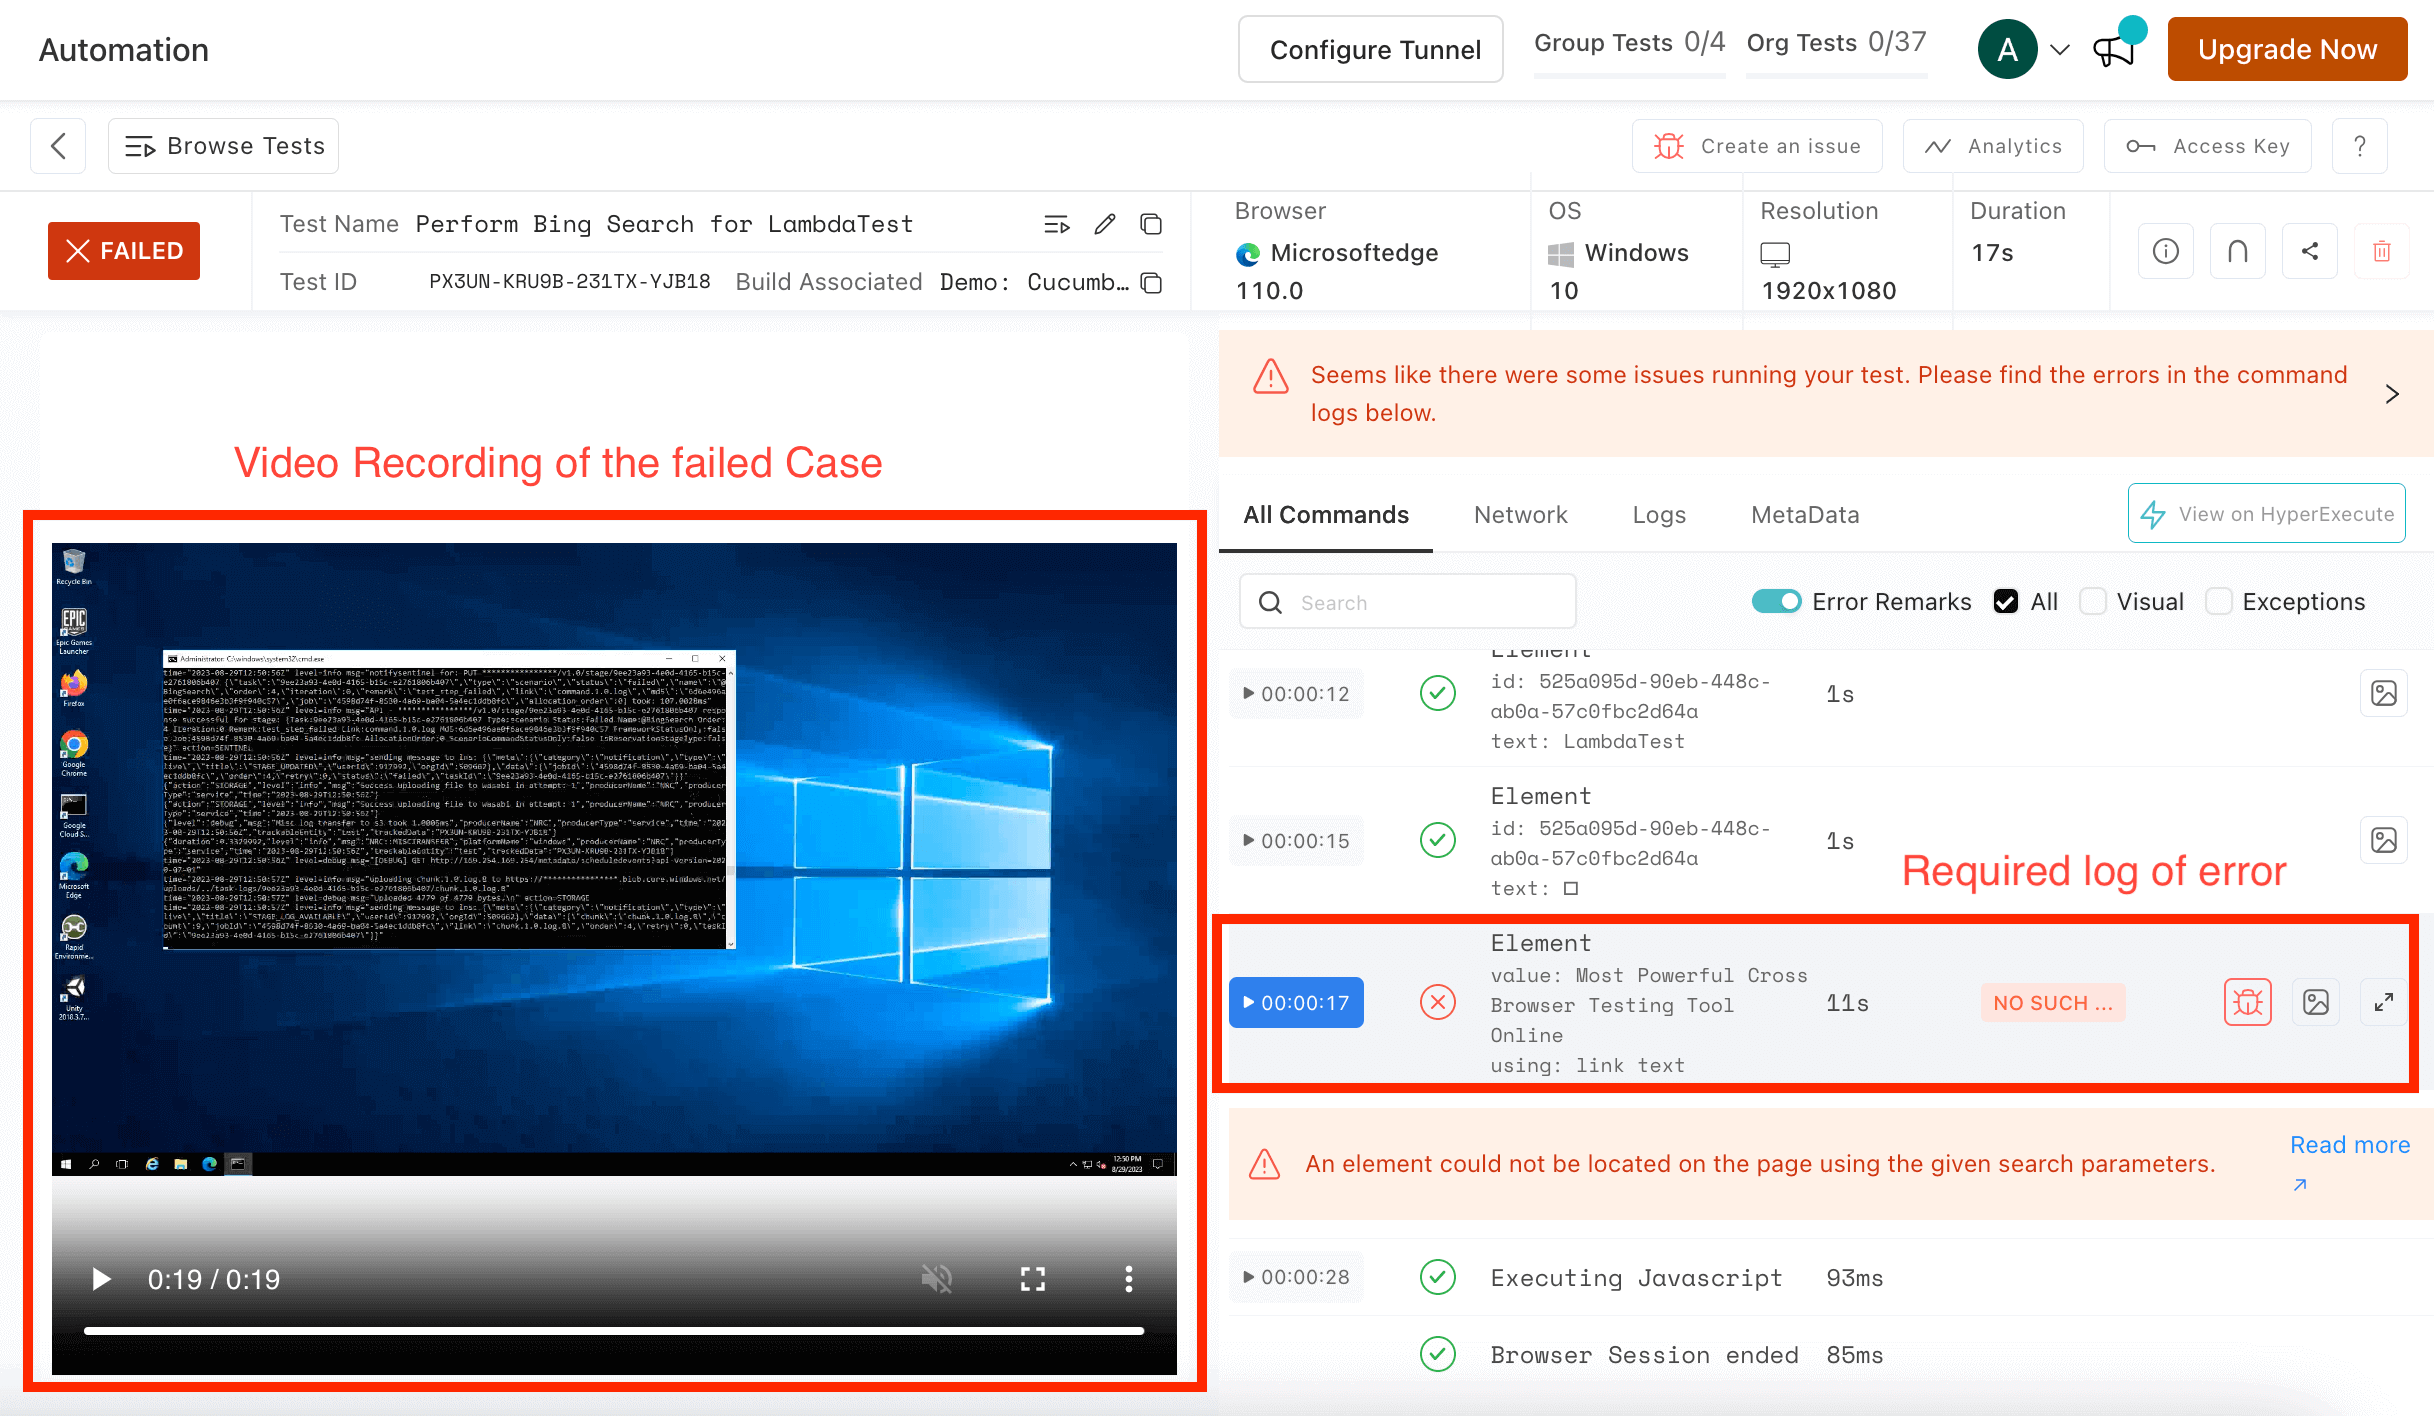
Command Logs
- You can view all kinds of logs as well like Network Logs. You can toggle between the Console Logs, Terminal Logs and the Test Framework Logs.
To enable these logs, you need to explicitly mention the required flag in your Test Capability Configuration.
NOTE : During the execution of scenario, you might come across different issues. To troubleshoot and resolve these issues, please refer to the relevant solutions provided on this page.
Root Cause Analysis Report
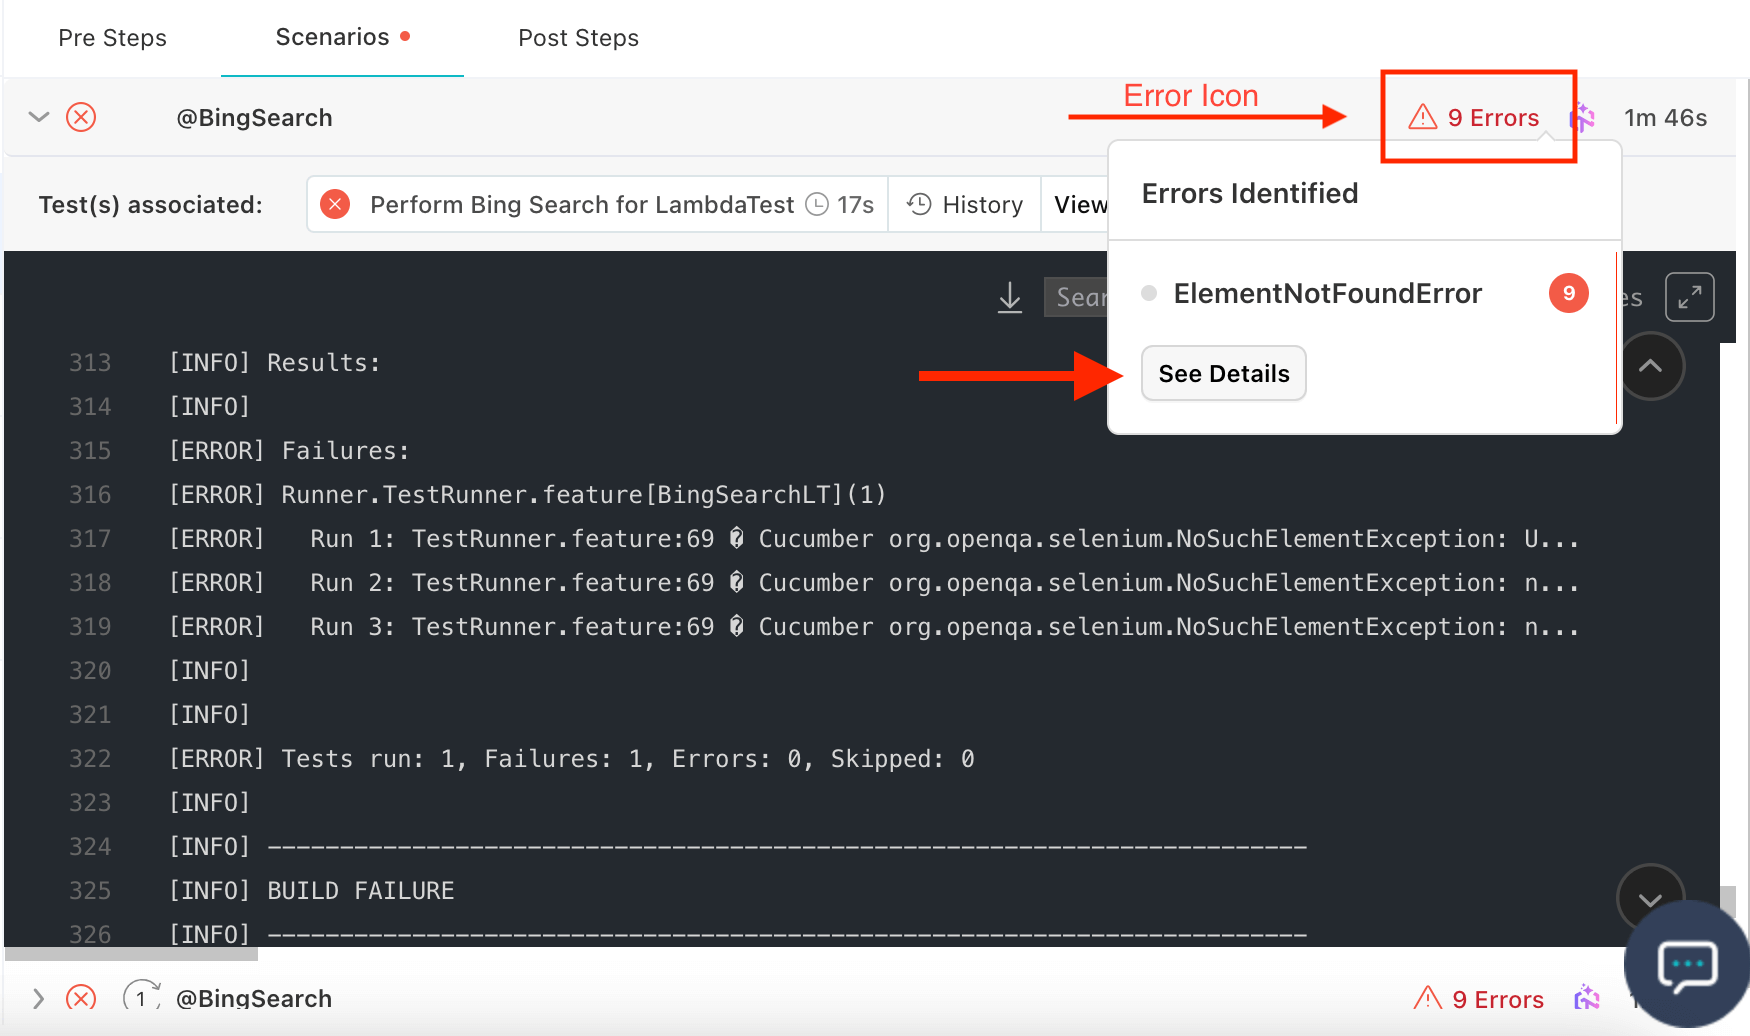
You can also check out our AI Native RCA Report, which will help you to quickly identify various error categories and also offer a comprehensive overview of the underlying causes.
To generate the RCA, simply click on the Errors icon, where you can also see the type of error, and then click on the See Details button to go through the detailed logs.
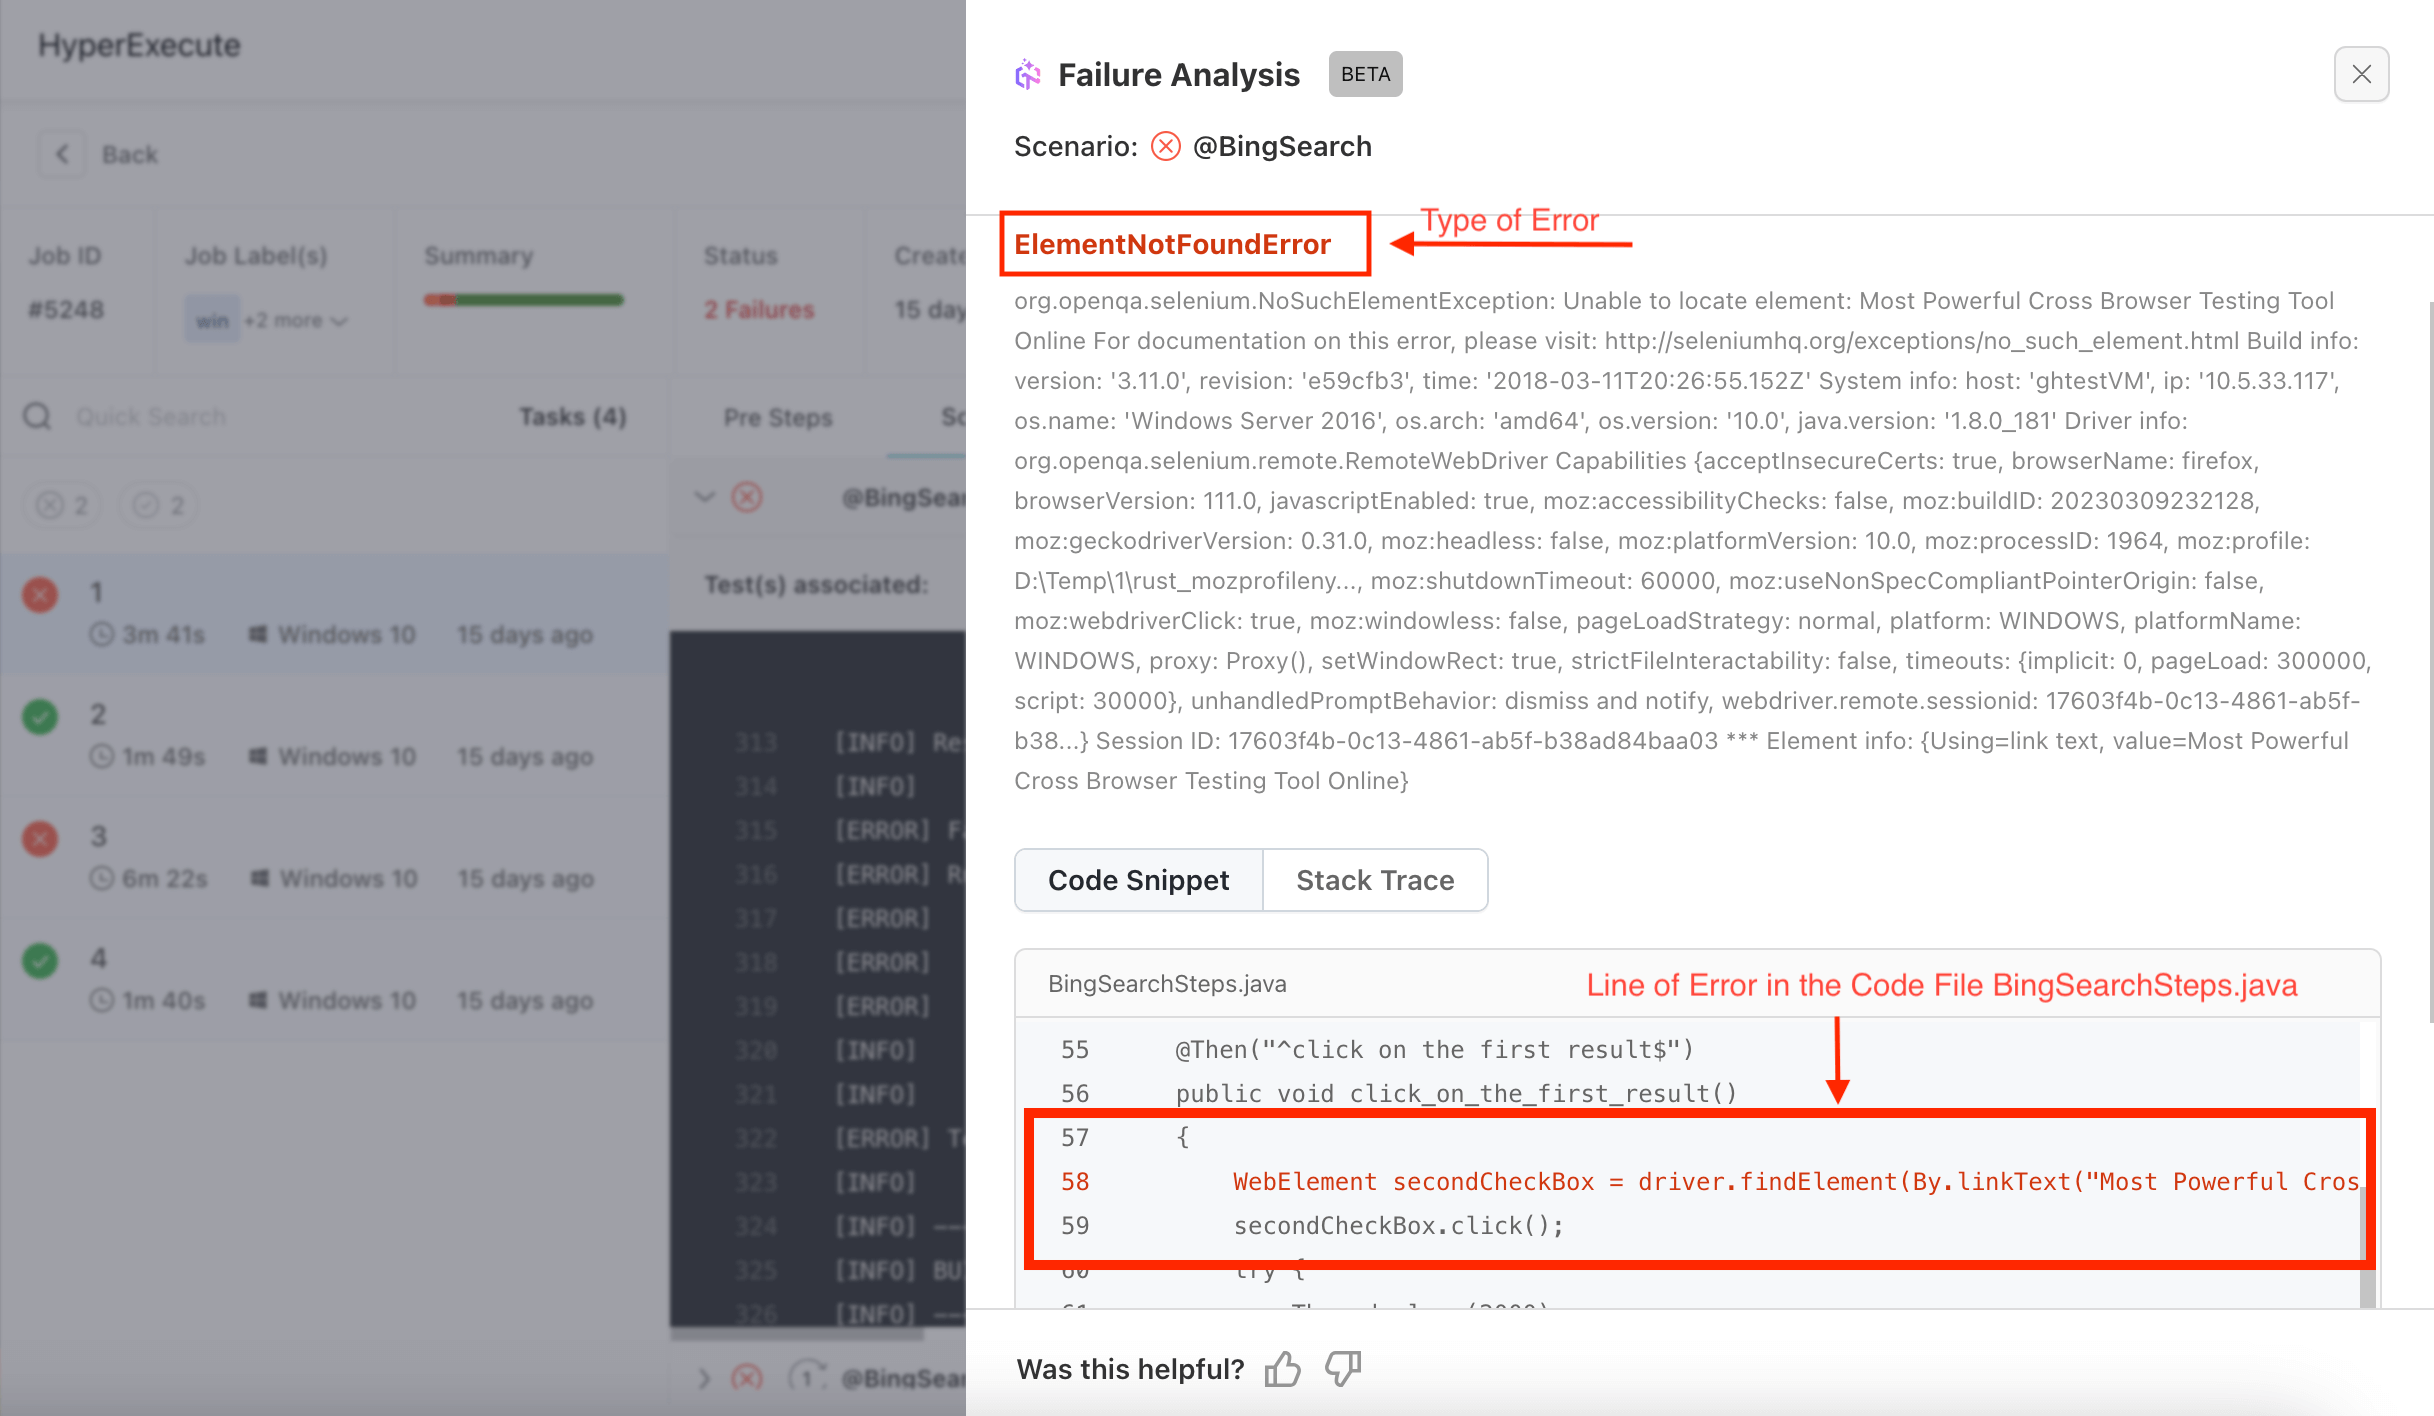
Here you can check the detailed log for the cause of failure as well as the Line number for the particular Code Snippet along with its Stack Trace.
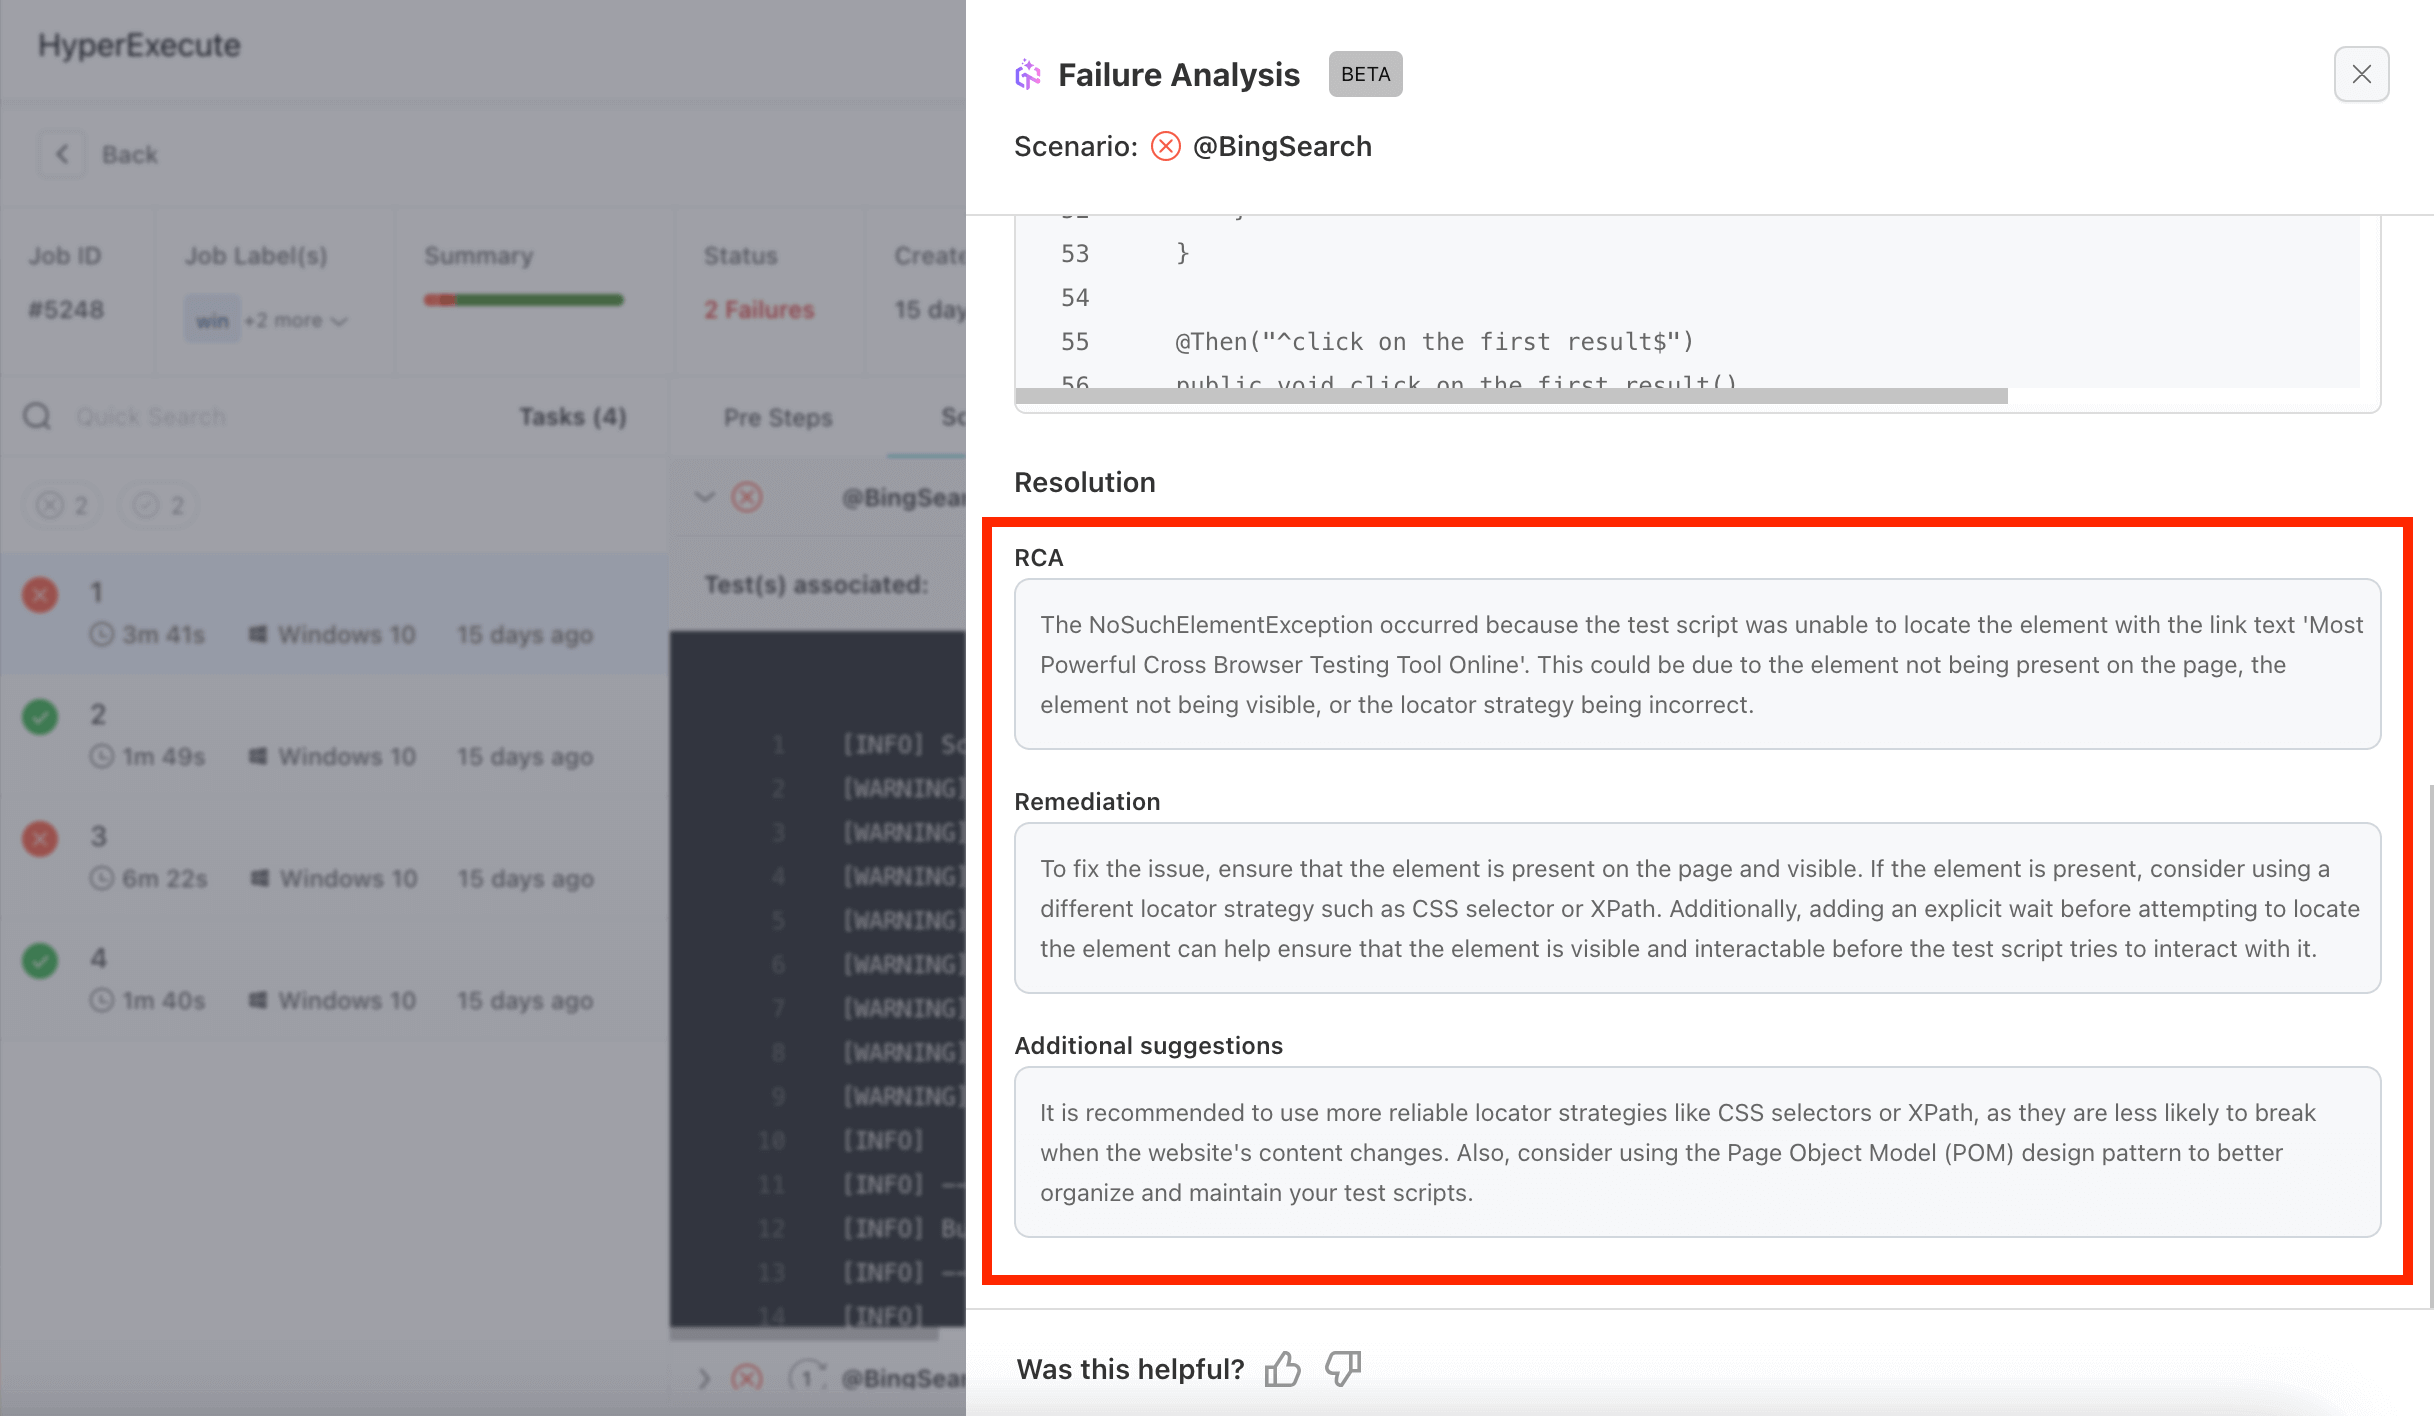
If you are still facing an issue, then scroll down and click on the Generate RCA button, which will offer a structured approach to addressing each failure type. You can efficiently get to the precise corrective measures or Remedies recommended, along with Additional suggestions for the particular error.
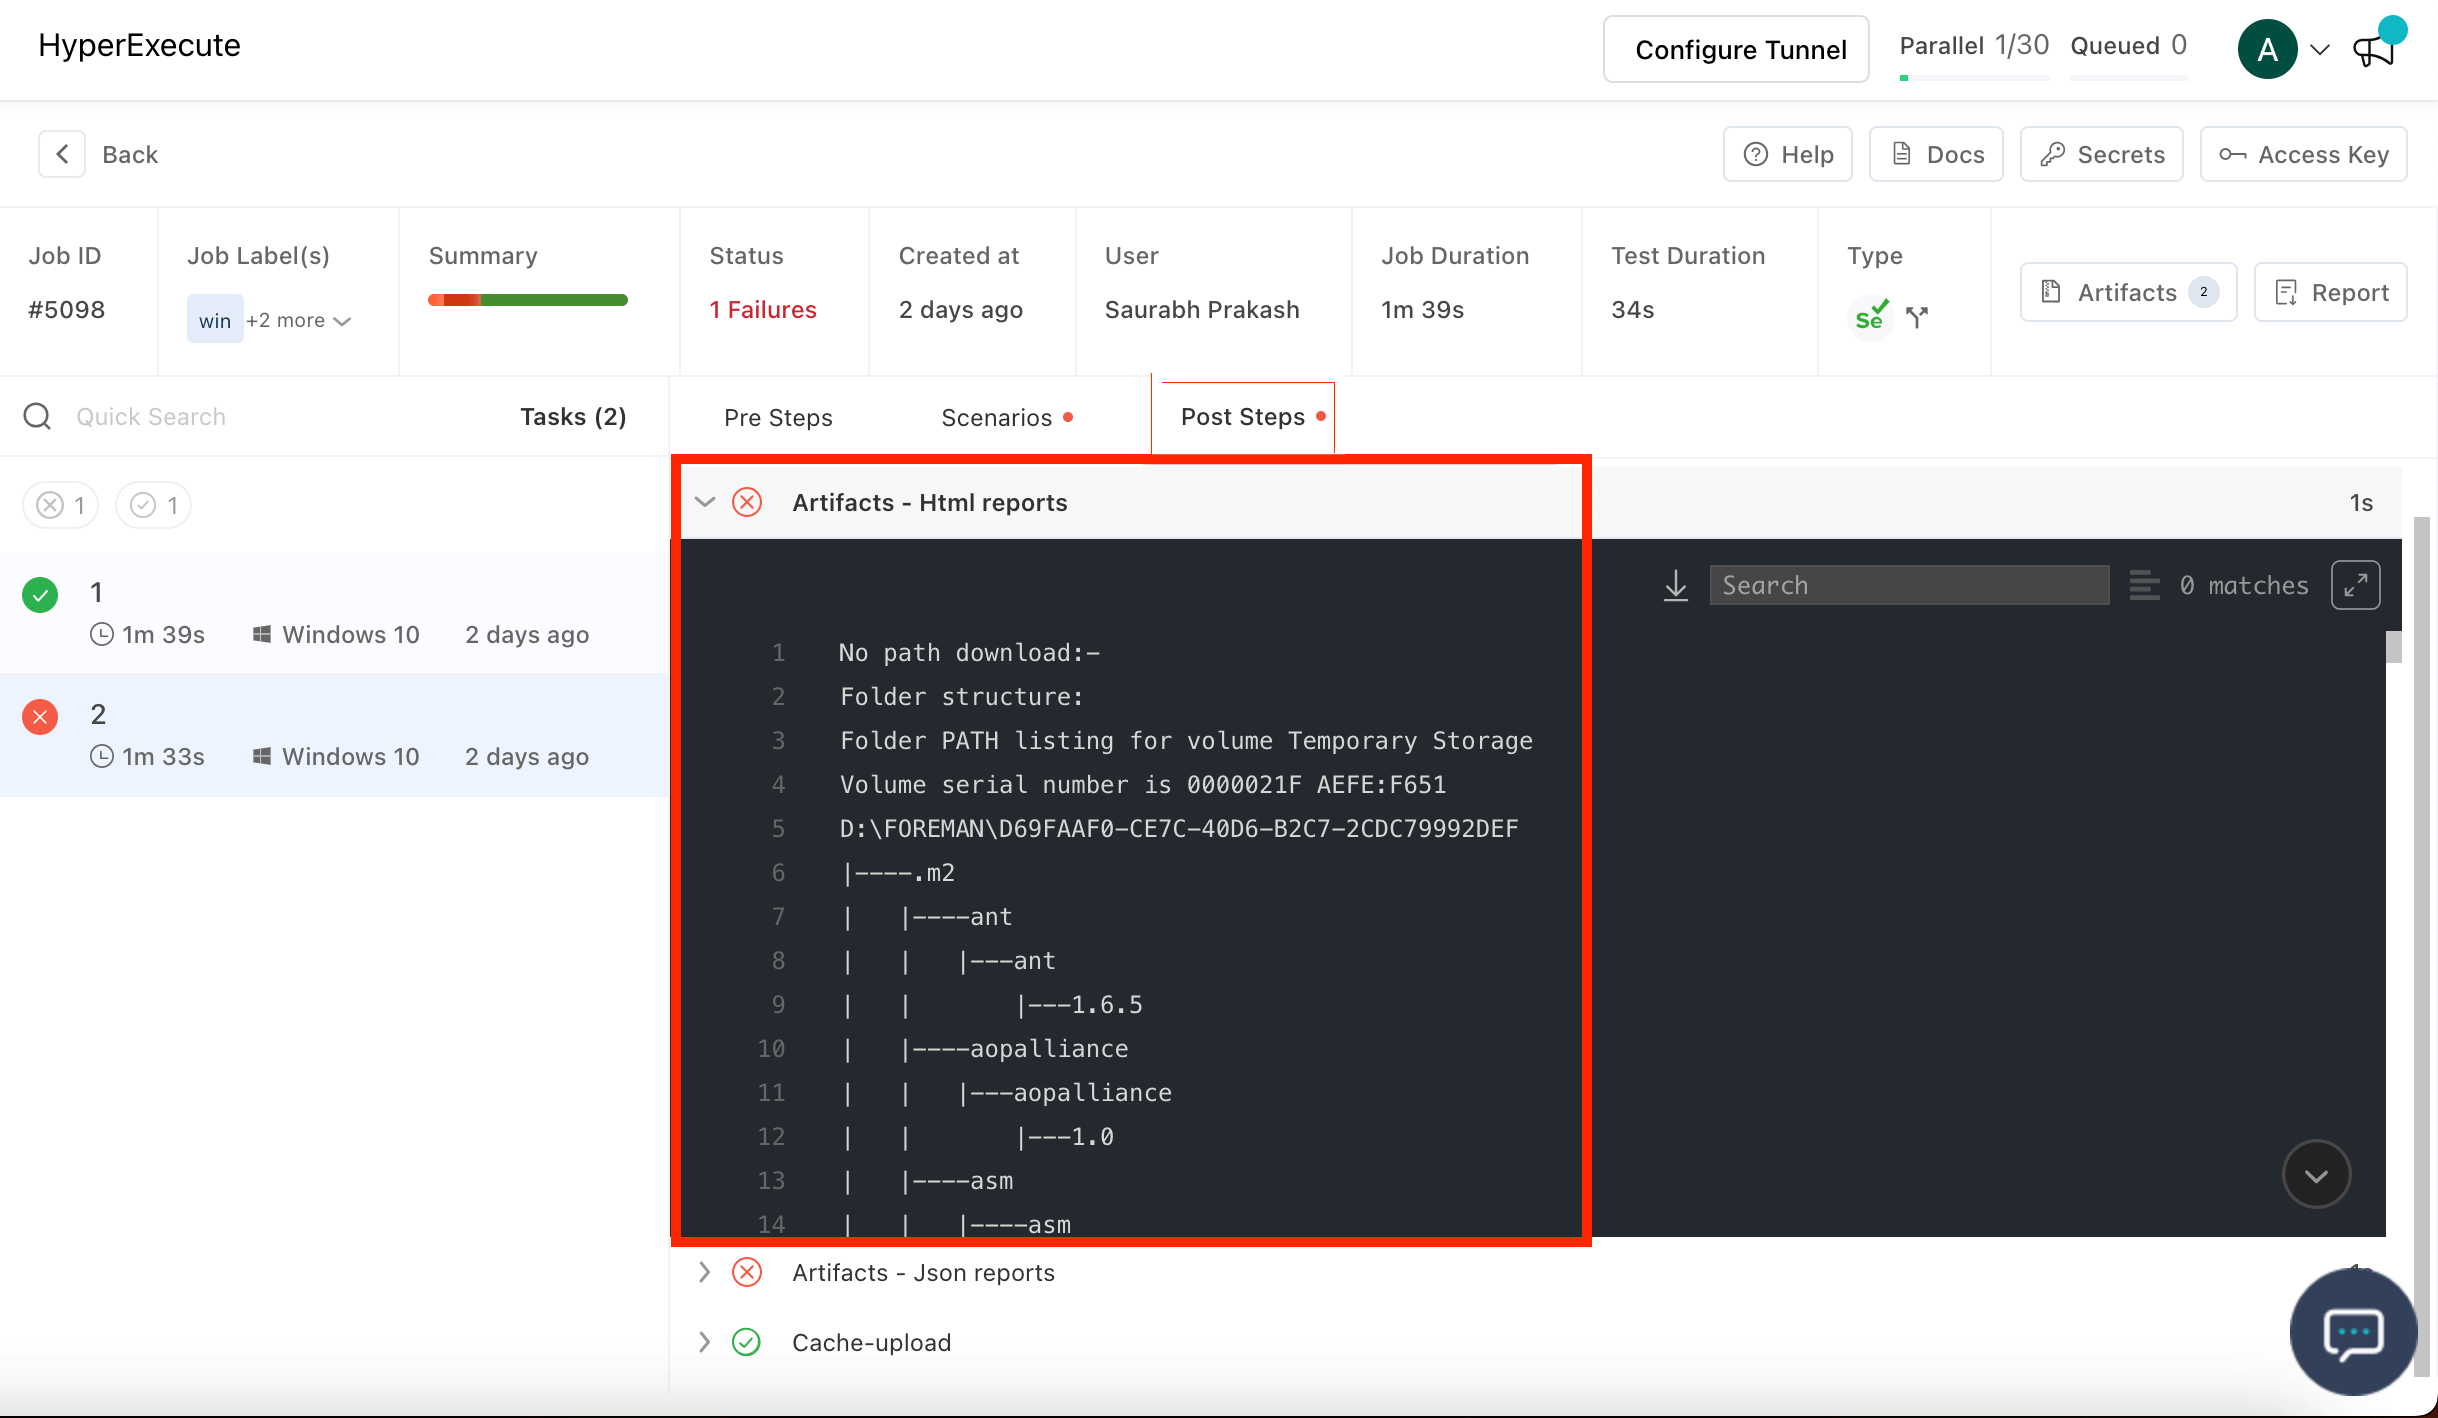
Post Steps
In the below screenshot, we can clearly see that there is some issue in fetching the path directory of the artifacts file and folder. And for the analysis of it, the path is also given in the logs so you can easily debug this.
You can also check the complete Detailed Job Report which can help you to analyze the outcome of your tests based on your framework.
