Test Intelligence - Flaky Test Detection
Flaky Test Detection helps you to identify the flaky tests in your test suite. It provides you with the list of tests that are flaky and the reason behind the flakiness ![]() of the test. You can also view the history of the flaky tests and the number of times the test has failed in the past. This helps you to identify the flaky tests and fix them to improve the quality of your test suite.
of the test. You can also view the history of the flaky tests and the number of times the test has failed in the past. This helps you to identify the flaky tests and fix them to improve the quality of your test suite.
Flaky Test Detection serves various use cases, including:
- Identifying Flaky Tests: Detecting tests that produce inconsistent results due to environmental factors, manual errors or other factors.
- Improving Test Reliability: Providing insights into the reliability of your automated tests.
- Identifying Sources of Flakiness: Pinpointing potential sources of flakiness, such as specific commands within a test.
- New Customization: Allowing you to tailor Flaky Test Detection settings to your specific testing environment and requirements.
- Flaky Test Analytics: Analysing the flaky tests and the number of times the test has changed in the past with pattern analysis using Flaky Test Analytics.
To read more about the Flaky Tests Analytics, you can refer the documentation at Flaky Tests Analytics
How to use Flaky Test Detection?
There are following Prerequisites to use Flaky Test Detection:
- You should have a TestMu AI account. If you don't have one, you can sign up here.
- You should have a test suite with same test name run on the platform at least 10 times.
How does the Flaky Test Detection work?
What are Flaky Tests?
Flaky tests refer to tests that exhibit inconsistent behavior when executed multiple times under the same conditions. These tests may produce varying results (pass or fail) when run repeatedly, even without any changes to the application or test script.
Flaky Test Detection Logics Supported
Summary:
Flaky Test Detection on the platform supports two complementary methods for identifying genuinely flaky tests. However, only one logic can be active at a time, based on user selection in the configuration. The detection of flaky tests will be performed exclusively using the selected logic:
-
Command Logs Mapping:
- Detects flakiness by analyzing transitions in test status and mapping command logs across test runs.
- Useful for identifying inconsistencies at the command level, such as when specific steps within a test behave differently across executions.
-
Error Message Comparison:
- Detects flakiness by comparing error messages (custom remark messages set by the user) between consecutive test runs.
- A test is classified as flaky only if it fails with different error messages across runs. If a test fails consistently with the same error message, it is not considered flaky.
- Reduces false positives by focusing on genuinely unstable tests.
Configuration:
- Users can select either Command Logs Mapping or Error Message Comparison as the active logic for flaky test detection in their settings.
- Only the selected logic will be applied for the detection of flaky tests. The other logic will not be considered until selected.
How it works:
- The system captures and stores both command logs and error messages from each test run.
- Flakiness is detected using only the logic chosen by the user:
- If Command Logs Mapping is selected, only command log inconsistencies are analyzed.
- If Error Message Comparison is selected, only error message differences are analyzed.
- Tests are marked as flaky if the selected method identifies inconsistent behavior or error messages.
Examples:
- If Command Logs Mapping is active: A test's command logs show different outcomes for the same command across runs → flaky.
- If Error Message Comparison is active: A test fails with "TimeoutError" in one run and "ElementNotFound" in another → flaky.
- If a test fails with the same error message and consistent command logs, it is not considered flaky under either logic.
Technical Details:
- The test result processing pipeline extracts and stores both command logs and error messages for each test run.
- Flakiness detection logic applies only the selected method.
- The database schema supports storage for both command logs and error messages.
- Logging is added to track the decision-making process for the active detection method.
- The UI reflects the detection mechanism, showing command log history or error message history based on the selected logic.
- Backward compatibility is maintained with existing test history data.
Business Value:
- Offers flexibility and precision in flaky test detection.
- Reduces false positives and helps teams focus on genuinely unstable tests.
- Improves the reliability of the test insights dashboard.
- Enables more targeted test stabilization efforts.
How to view the Flaky Test Detection for Web Automation tests?
To view the Flaky Test Detection report, you can follow the below steps:
- Go to the TestMu AI Automation Dashboard.
- Select the Build for which you want to view the flaky tests list.
- For flaky marked tests, you will see a Flake icon
 in the test list.
 - Now, select the test for which you want to view the flaky test details.
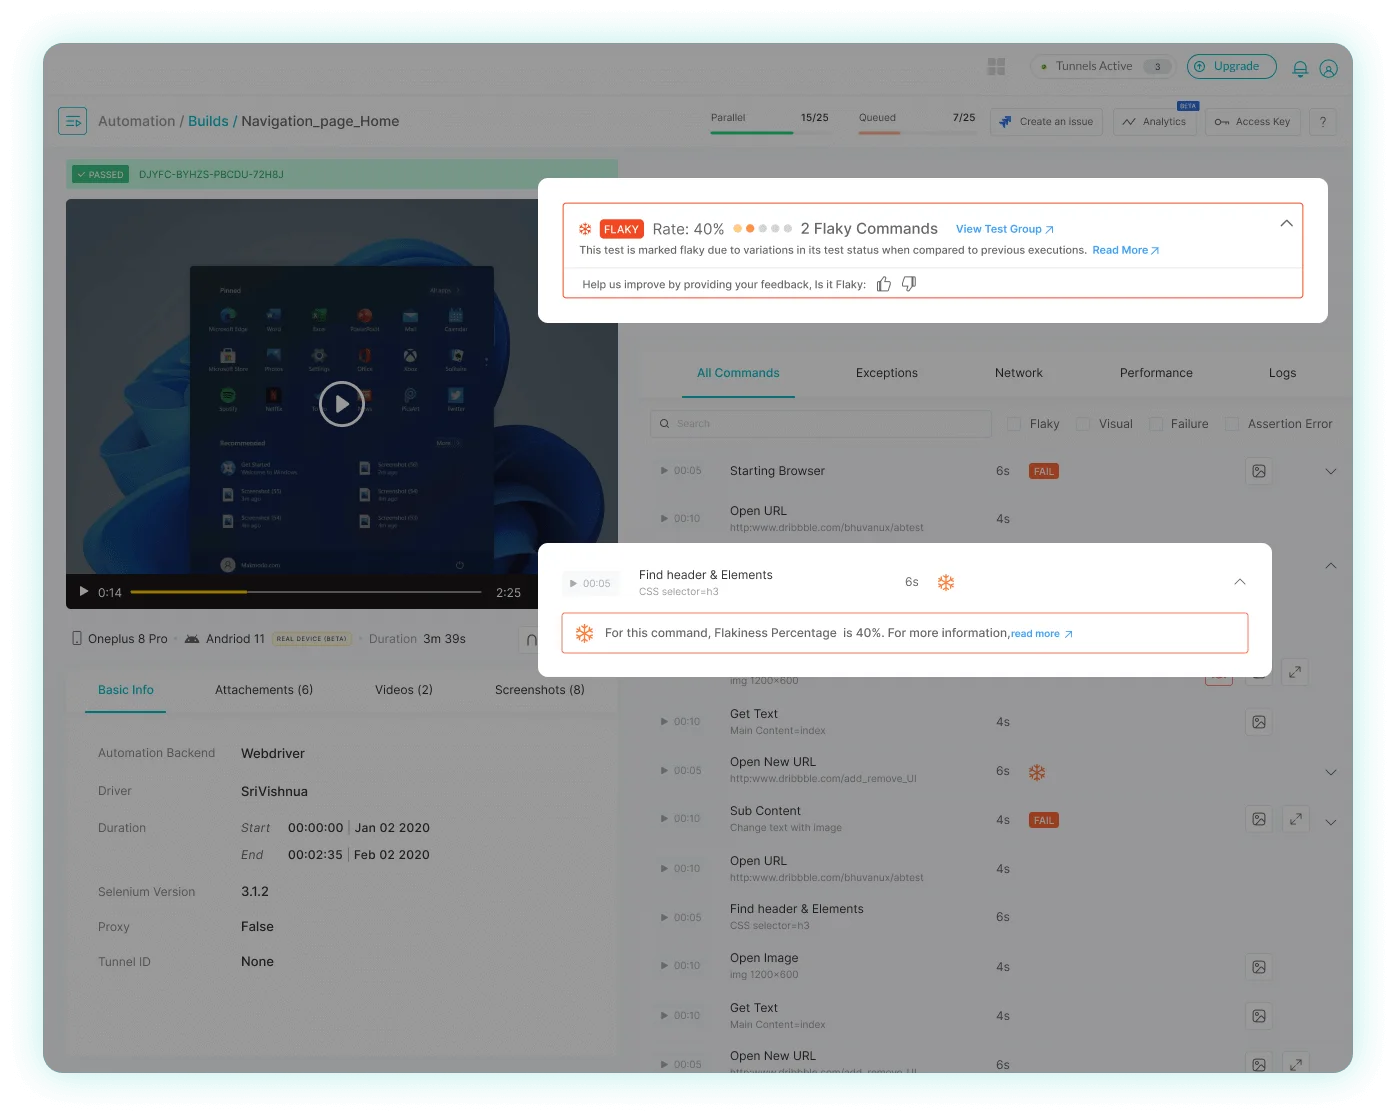
- You will be redirected to the Test Details page. Here, you can view the flaky test details in the right corner of the page.
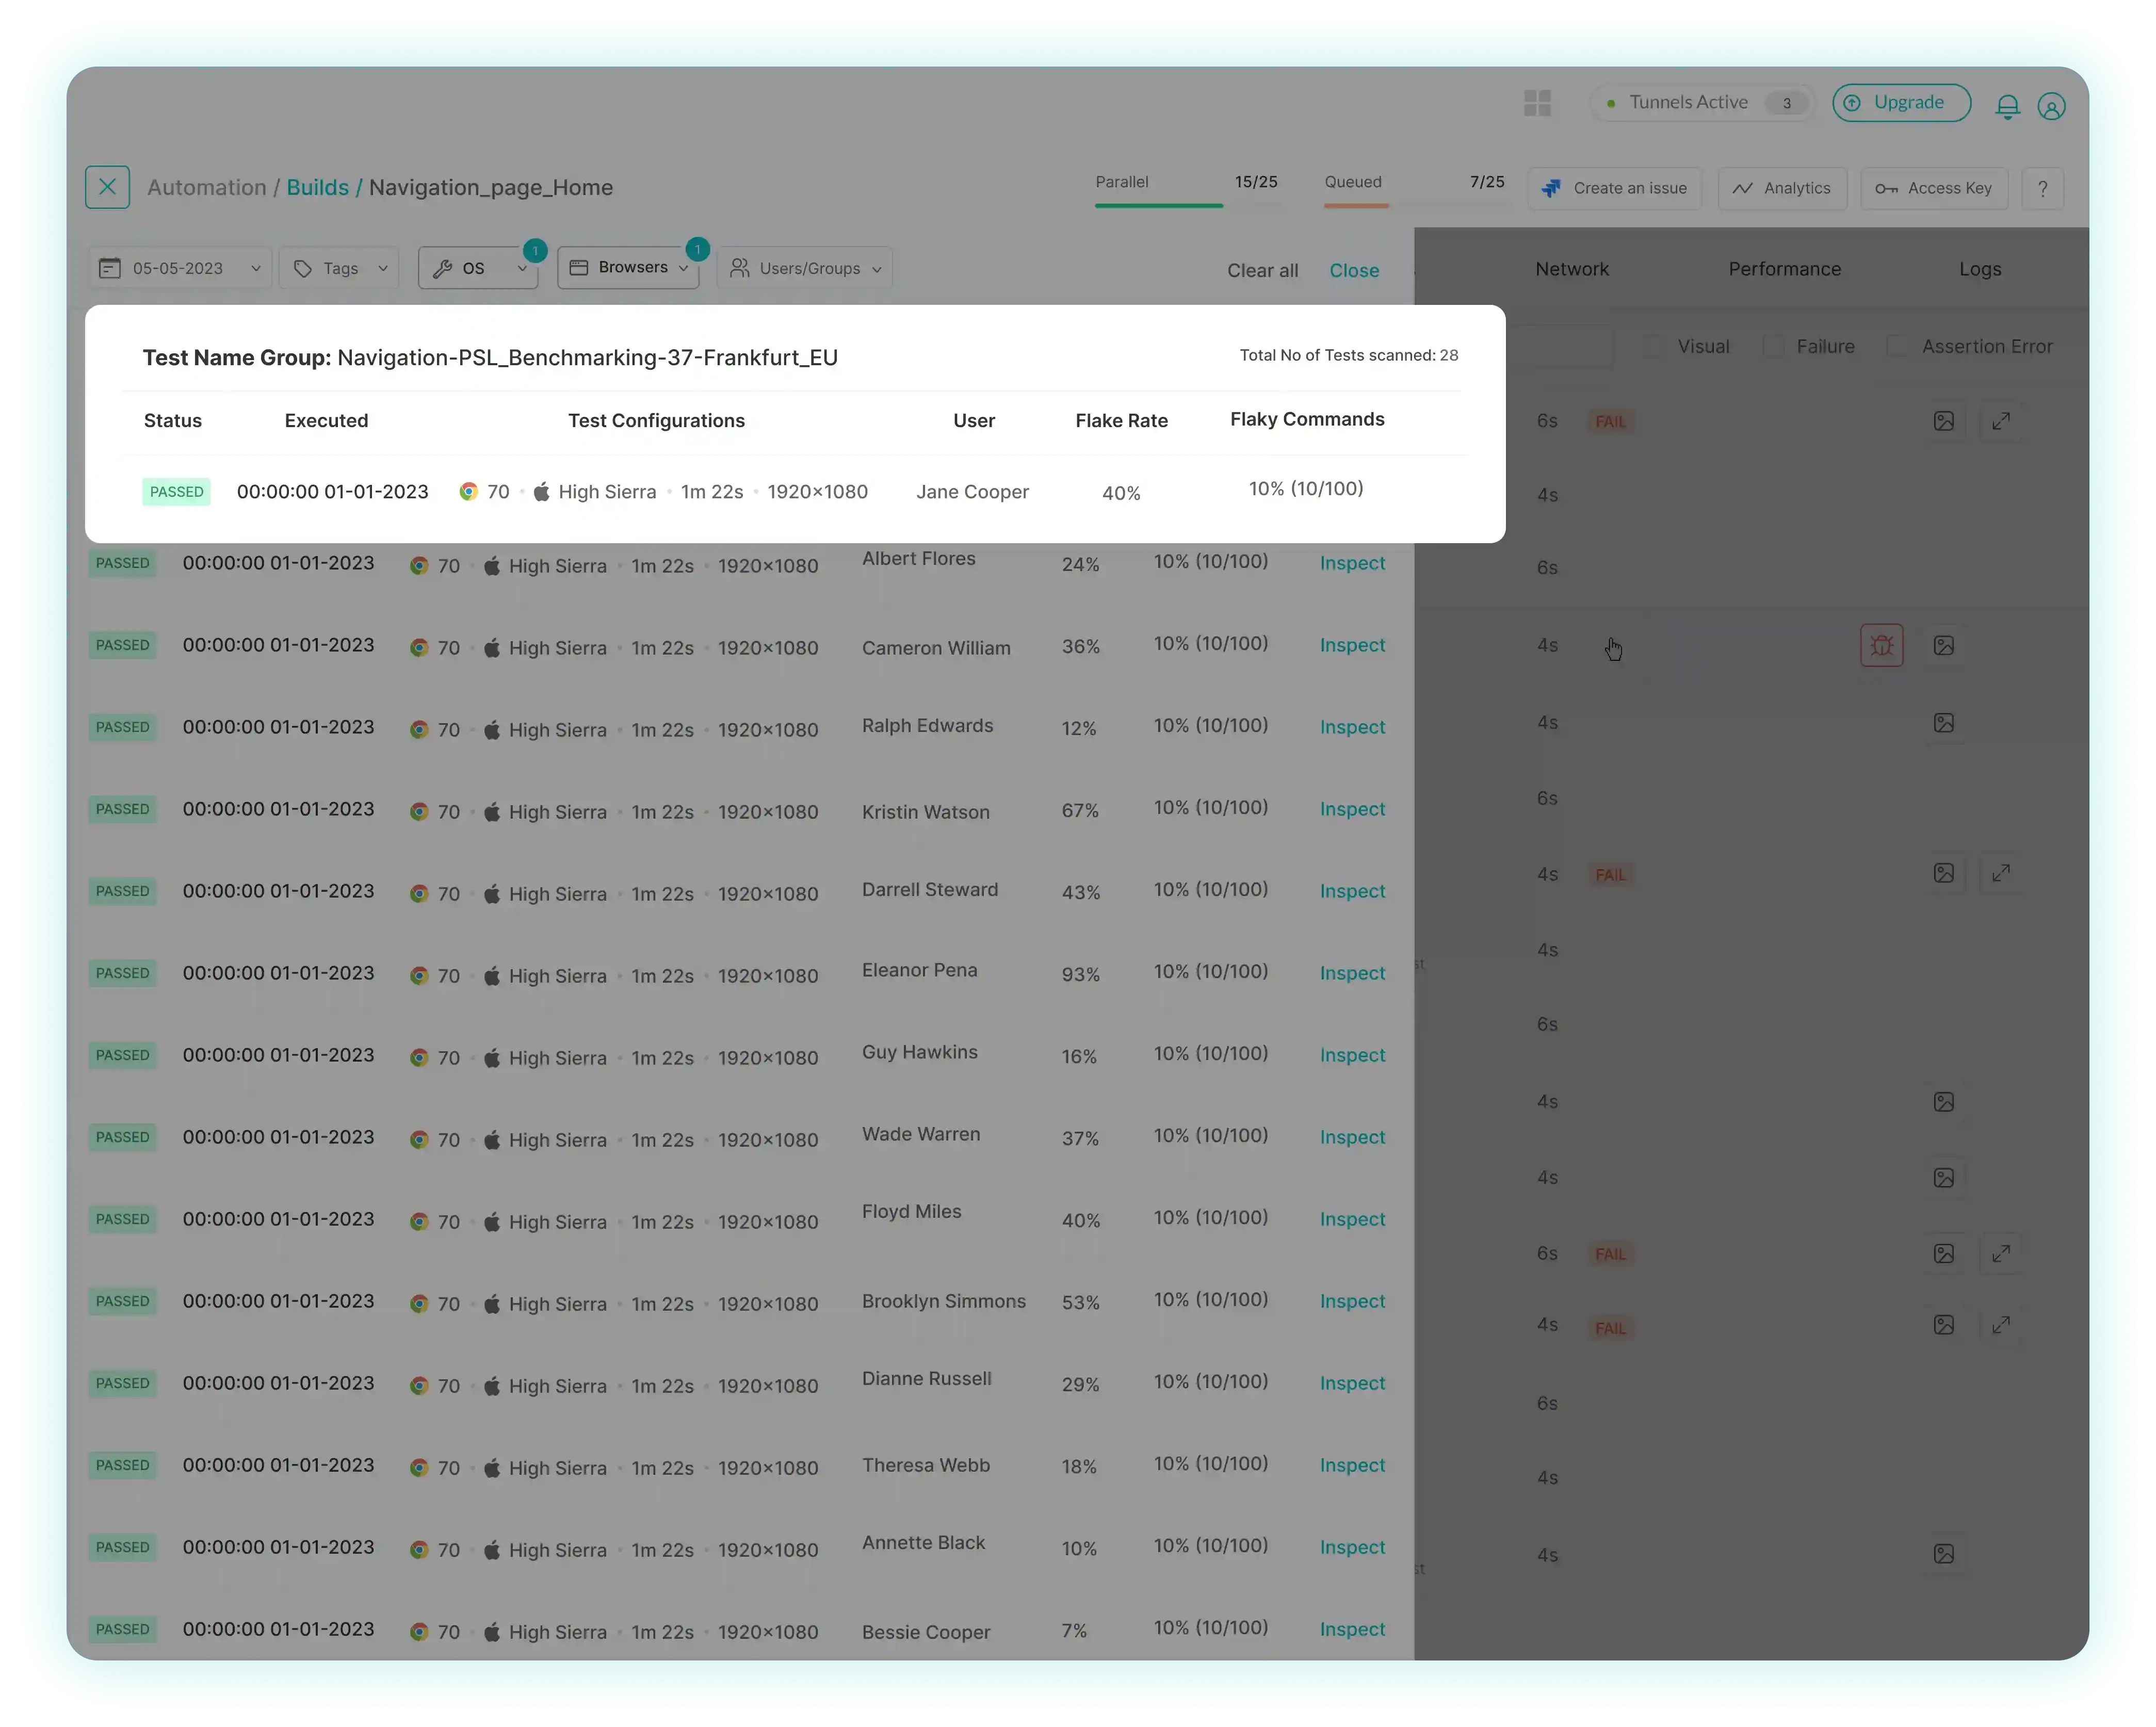
Exploring Different Metrics in Flaky Test Detection
In Flaky Test Detection, several metrics play a crucial role in assessing and categorizing test results. Understanding these metrics is essential for identifying and addressing inconsistencies in automated testing. Please note that some metrics are only relevant when the Command Logs Mapping logic is selected.
-
Flake Rate The Flake Rate is a metric that measures the current flake rate within a specific group of tests. In Flaky Test Detection, tests are grouped based on criteria such as test name, browser, operating system (OS), and resolution. This metric assesses the inconsistency across test runs of the same name by quantifying transitions in test status and provides valuable insights into the collective performance of similar tests under varying conditions.
Use Case: Picture a group of tests. The Flake Rate serves as a measure of the degree of consistency or inconsistency observed in the test status when these tests are executed repeatedly.
-
Flaky Commands (Available only with Command Logs Mapping logic) The Number of Flaky Commands is a metric used to define the order of flakiness
of an individual test. It signifies the inconsistency of different commands within the same test.Use Case: Consider a single test that performs a series of commands. The number of flaky commands will let the user know how many commands have inconsistencies in a single test.
-
Command Flakiness Percentage (Available only with Command Logs Mapping logic) The Command Flakiness Percentage is a metric employed to define the order of flakiness
of a specific command within a test. It assesses the inconsistency of the same command executed across different test runs within the same group. This level of granularity helps pinpoint potential sources of flakiness at the command level.Use Case: Within a test, individual commands may produce inconsistent results. The Command Flakiness Percentage identifies the fluctuations in each command, aiding in precise root cause analysis.
Understanding these metrics allows you to:
- Assess the overall consistency of tests within a group.
- Identify specific tests that exhibit inconsistent behavior.
- Drill down to individual commands to pinpoint sources of flakiness (when Command Logs Mapping is active).
- Prioritize improvements and optimizations based on the level of inconsistency revealed by these metrics.
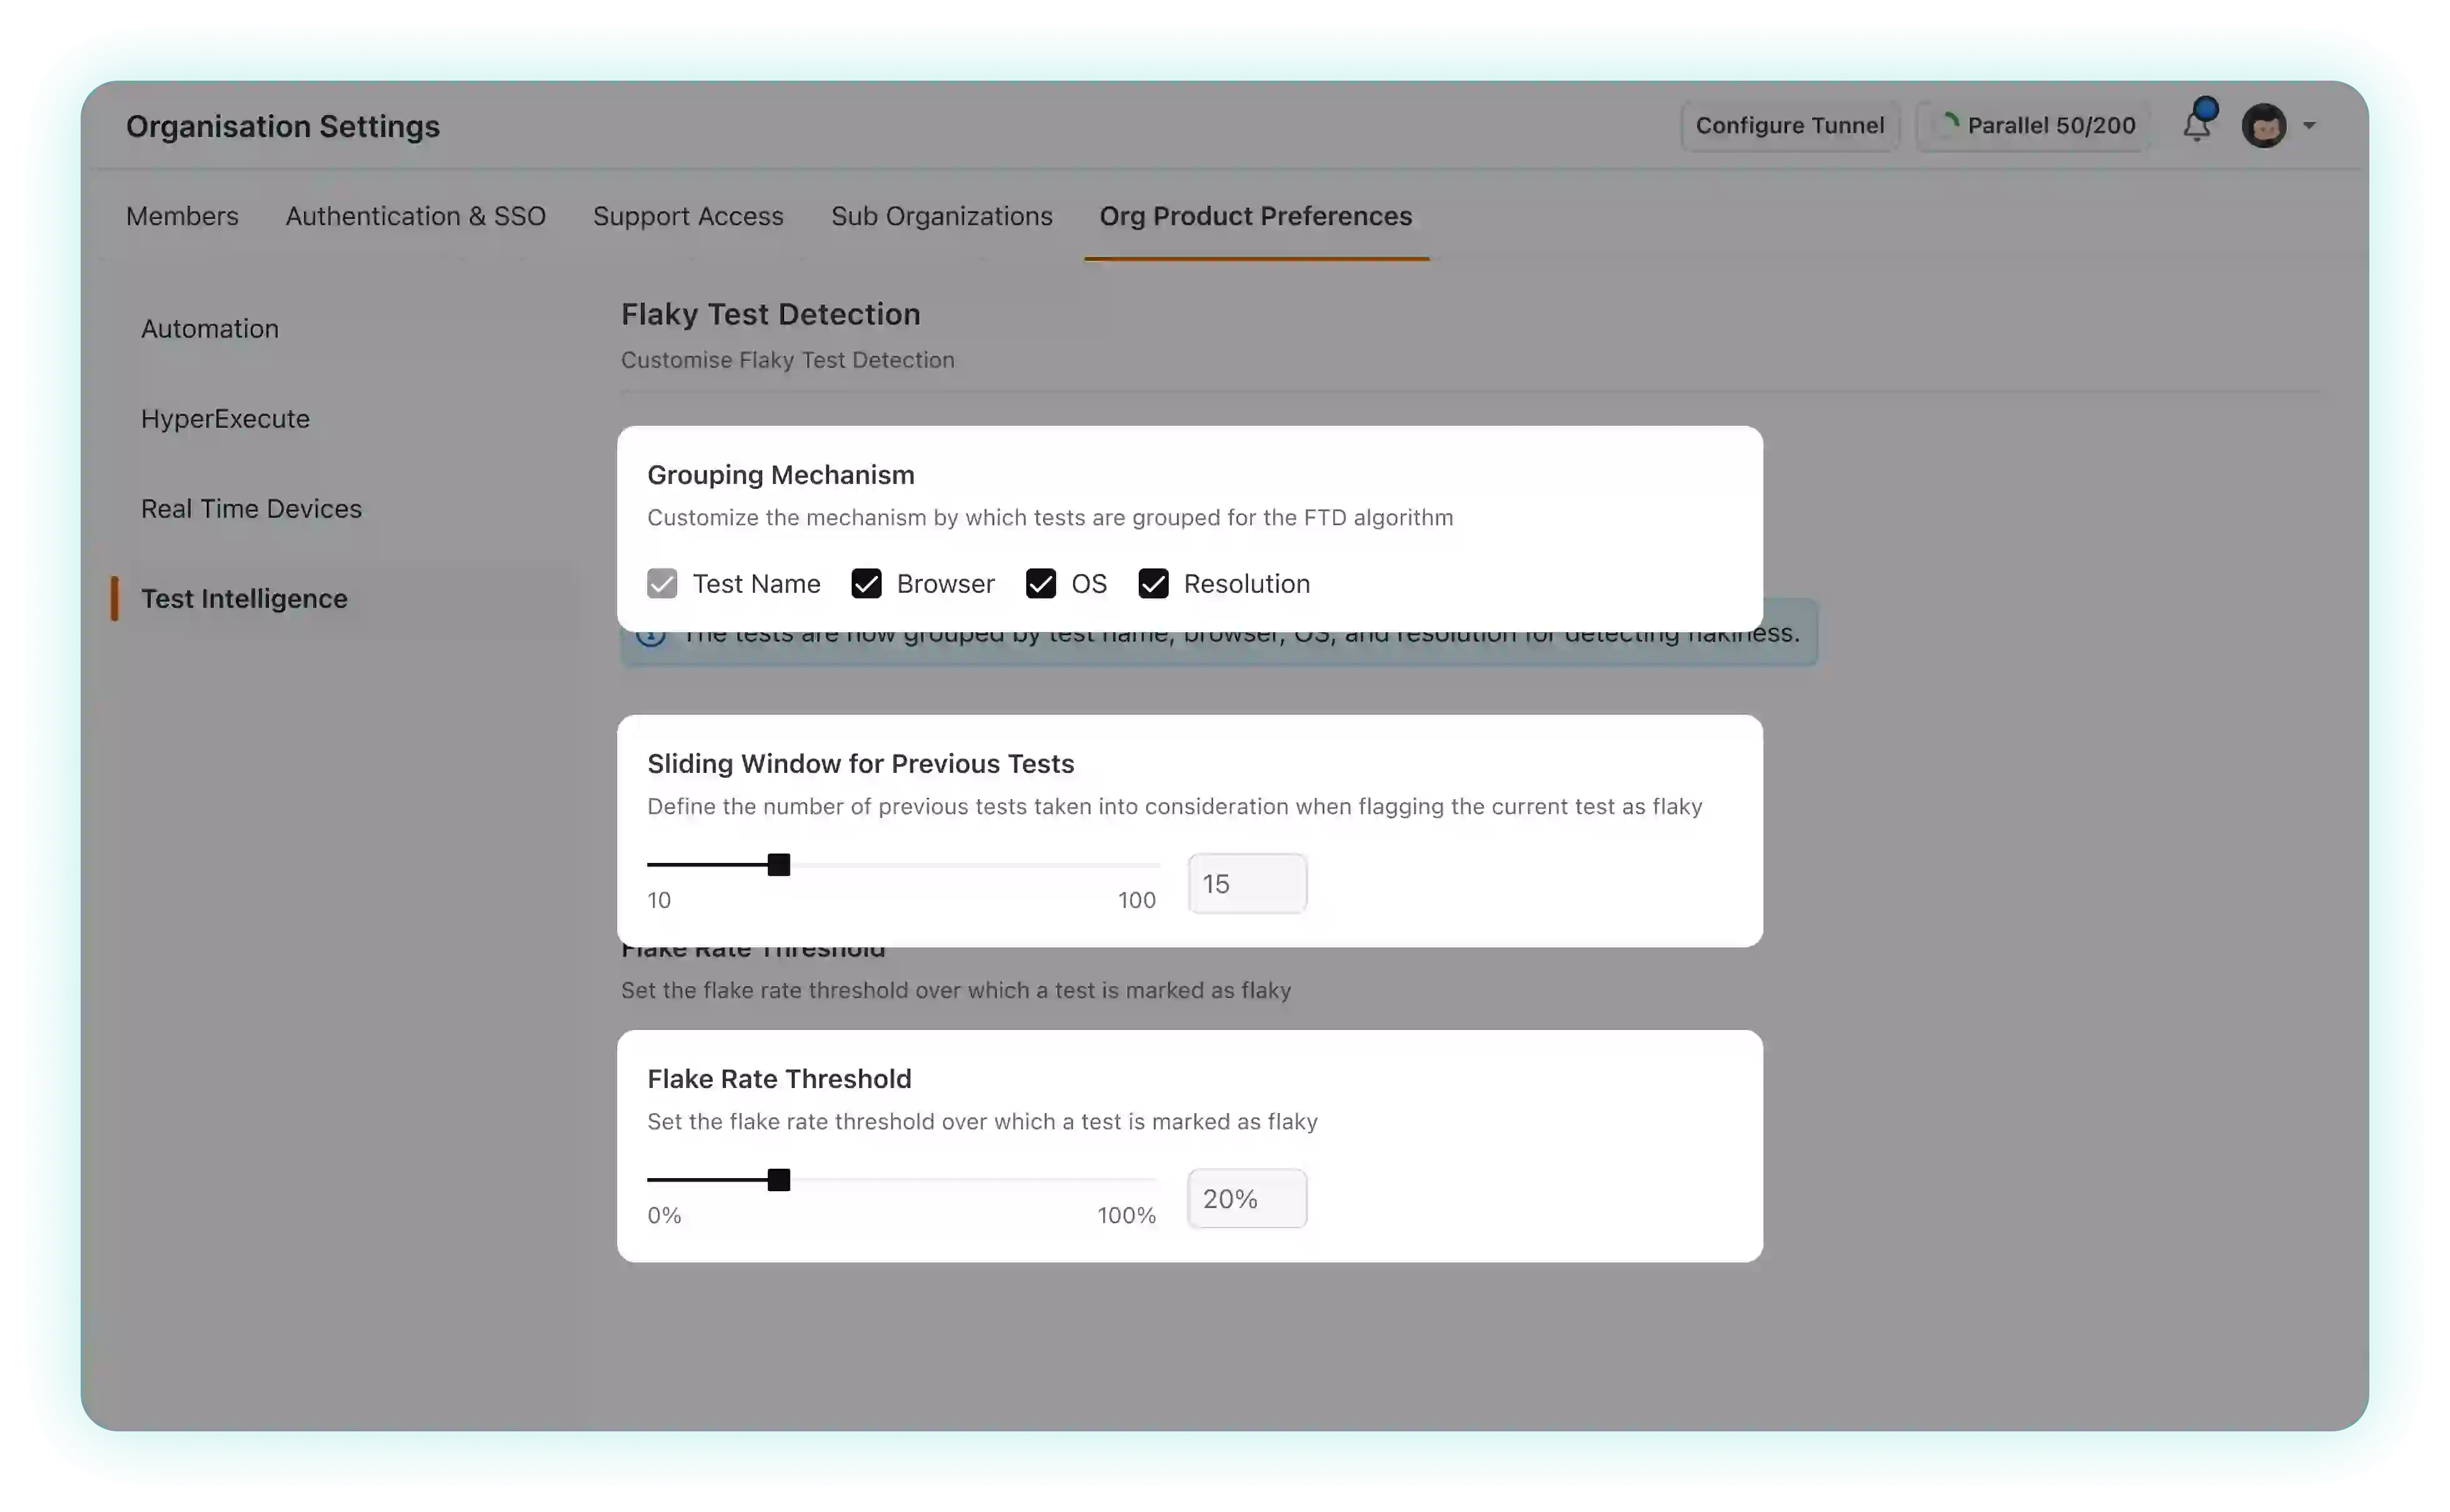
Customizing Flaky Test Detection New
How to use the Custom Flaky Test Detection settings?
Go to the Test Intelligence section in Org Product Preferences under Organization Settings to locate the following settings:
-
Grouping Mechanism: The grouping mechanism provides you with the ability to determine the criteria for categorizing tests for flakiness
. By default, tests are grouped based on your testing environment specified in the capabilities, which include parameters such as test name, browser, operating system (OS), and resolution.Test CapabilitiesFor instance, if you execute a test suite for the login functionality of your application, the test group name could be designated as
Loginin the capabilities of your test.const capability = {
"browserName": "Chrome",
"browserVersion": "118.0",
"LT:Options": {
"username": "<USERNAME>",
"accessKey": "<ACCESS_KEY>",
"platformName": "Windows 10",
"project": "Flaky Test Detection",
"name": "Login",
"w3c": true,
"plugin": "node_js-node_js"
}
}The primary criterion for grouping is the
test name, and you also have the flexibility to tailor this grouping according to your specific needs. This customization can be achieved by deselecting one or more of the environment variables, allowing you to precisely define how tests are categorized. -
Sliding Window of previous test runs: The sliding window represents the number of preceding tests taken into account when assessing the potential flakiness
of the current test. By default, this threshold is configured to include the last 10 tests in the analysis. Altering this threshold allows you to customize the historical data considered for evaluation. Increasing the threshold may provide a more extensive historical context, potentially identifying subtle patterns or fluctuations in test results. Conversely, reducing the threshold can lead to a more focused assessment, ideal for quicker insights when dealing with a large number of tests. Finding the right balance in selecting the sliding window threshold is key to optimizing your test reliability analysis. -
Flake Rate Threshold: You can set the flake rate threshold to define when a test is marked as flaky. The default threshold is 20%. Tests crossing this threshold will be marked flaky
. By adjusting the threshold, you can fine-tune the sensitivity of flakiness detection. Lowering it may result in more tests being flagged as flaky, helping you catch minor inconsistencies, while increasing it can provide a higher level of tolerance, focusing on more significant deviations in test behavior. Selecting an appropriate threshold empowers you to tailor your flakiness detection precisely to your testing needs.
Identifying flakiness in test status
Flakiness is characterized by the inconsistency observed in prior executions of the same test, which implies that a test can be deemed flaky even in the absence of flaky individual commands within the test. Since flakiness is predicated on the variability of the test's status across executions, a test will retain its flaky classification until its Flake Rate falls below the predefined threshold. The decline in the Flake Rate corresponds to achieving consistency in test executions.
Support for Cypress, Playwright, Puppeteer and Appium UPCOMING
We are actively working on extending its Flaky Test Detection capabilities to include popular testing frameworks like Cypress, Playwright, Puppeteer, and Appium. This expansion will empower users to assess and manage test reliability across a broader spectrum of testing scenarios in both web and app based tests, enhancing the overall testing experience. Stay tuned for updates on the availability of Flaky Test Detection support for these frameworks.
