ChromeOS App Testing
This document outlines how you can leverage the features like mark as bug, changing IP geolocation, in-depth device logs and network logs etc to ease your Real Time App testing process.
Steps to start your ChromeOS App Testing
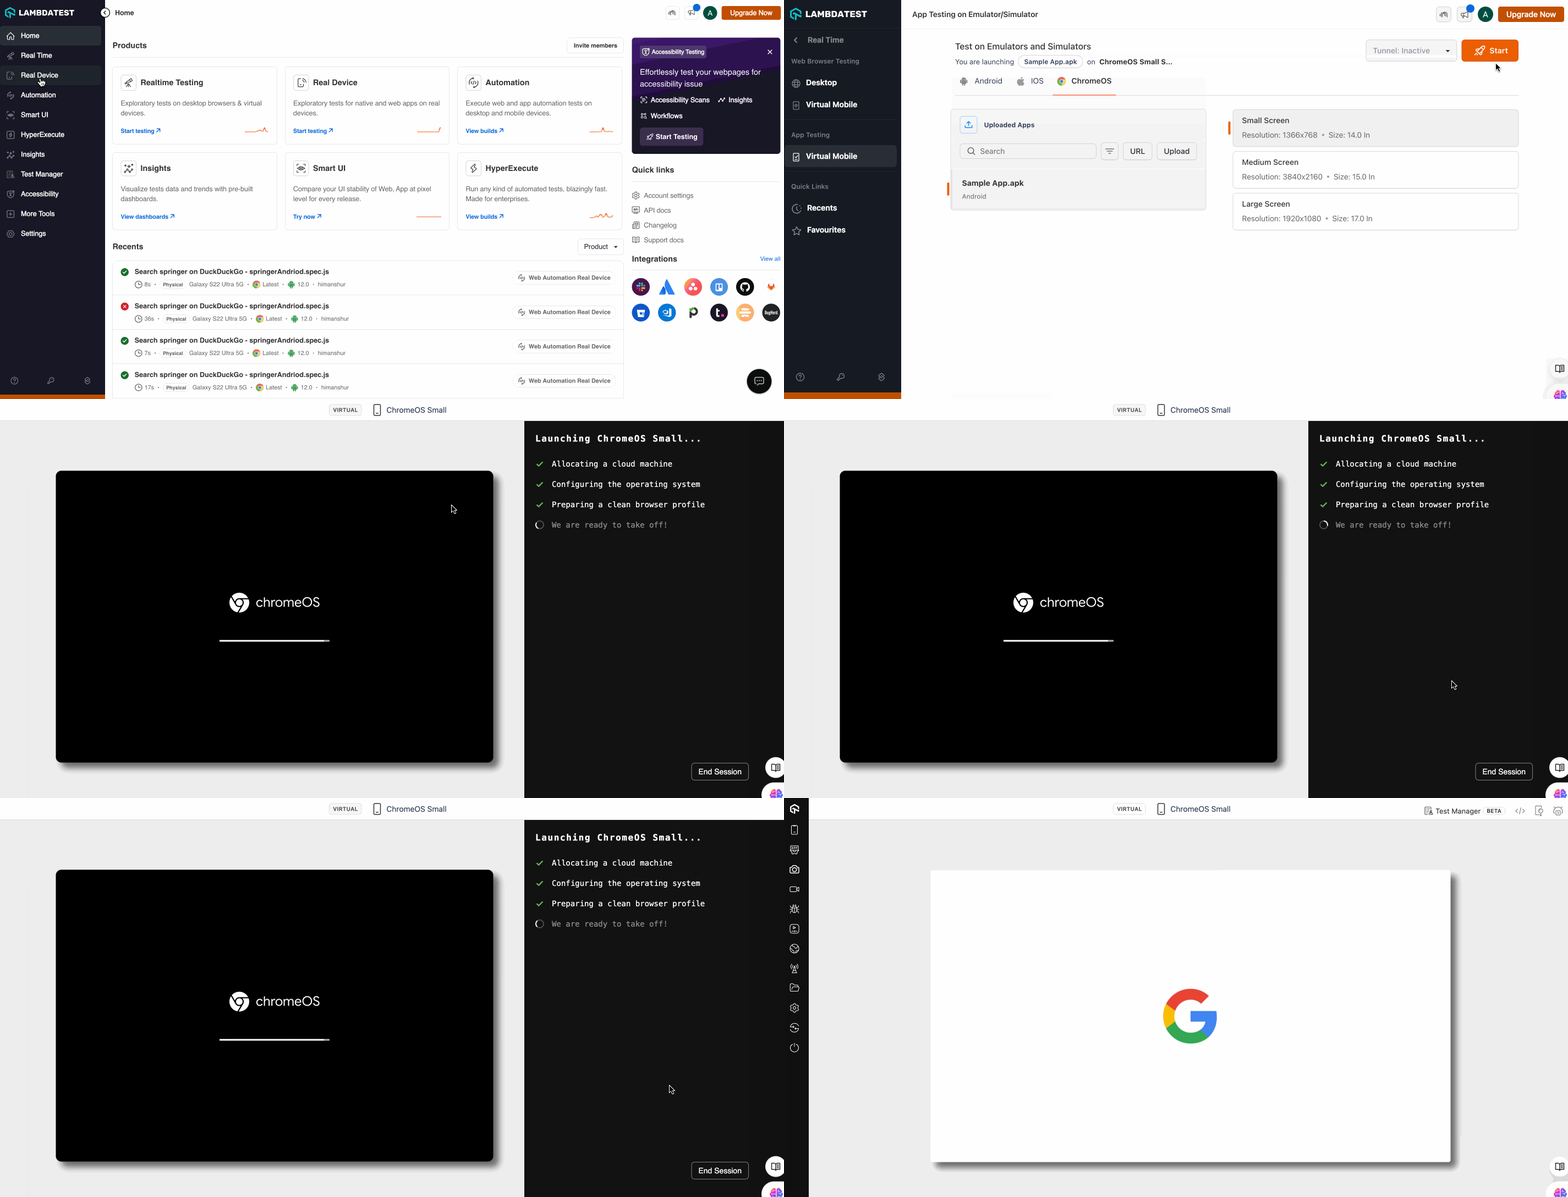
Step 1: Click on the Real Time option from your TestMu AI dashboard.
Step 2: Click on the Virtual Mobile option in App Testing section.
Step 3: Select the ChromeOS option, and upload your application to the TestMu AI. (We are using the sample application for the demo purpose)
Step 4: Select your screen resolution and click on Start button.
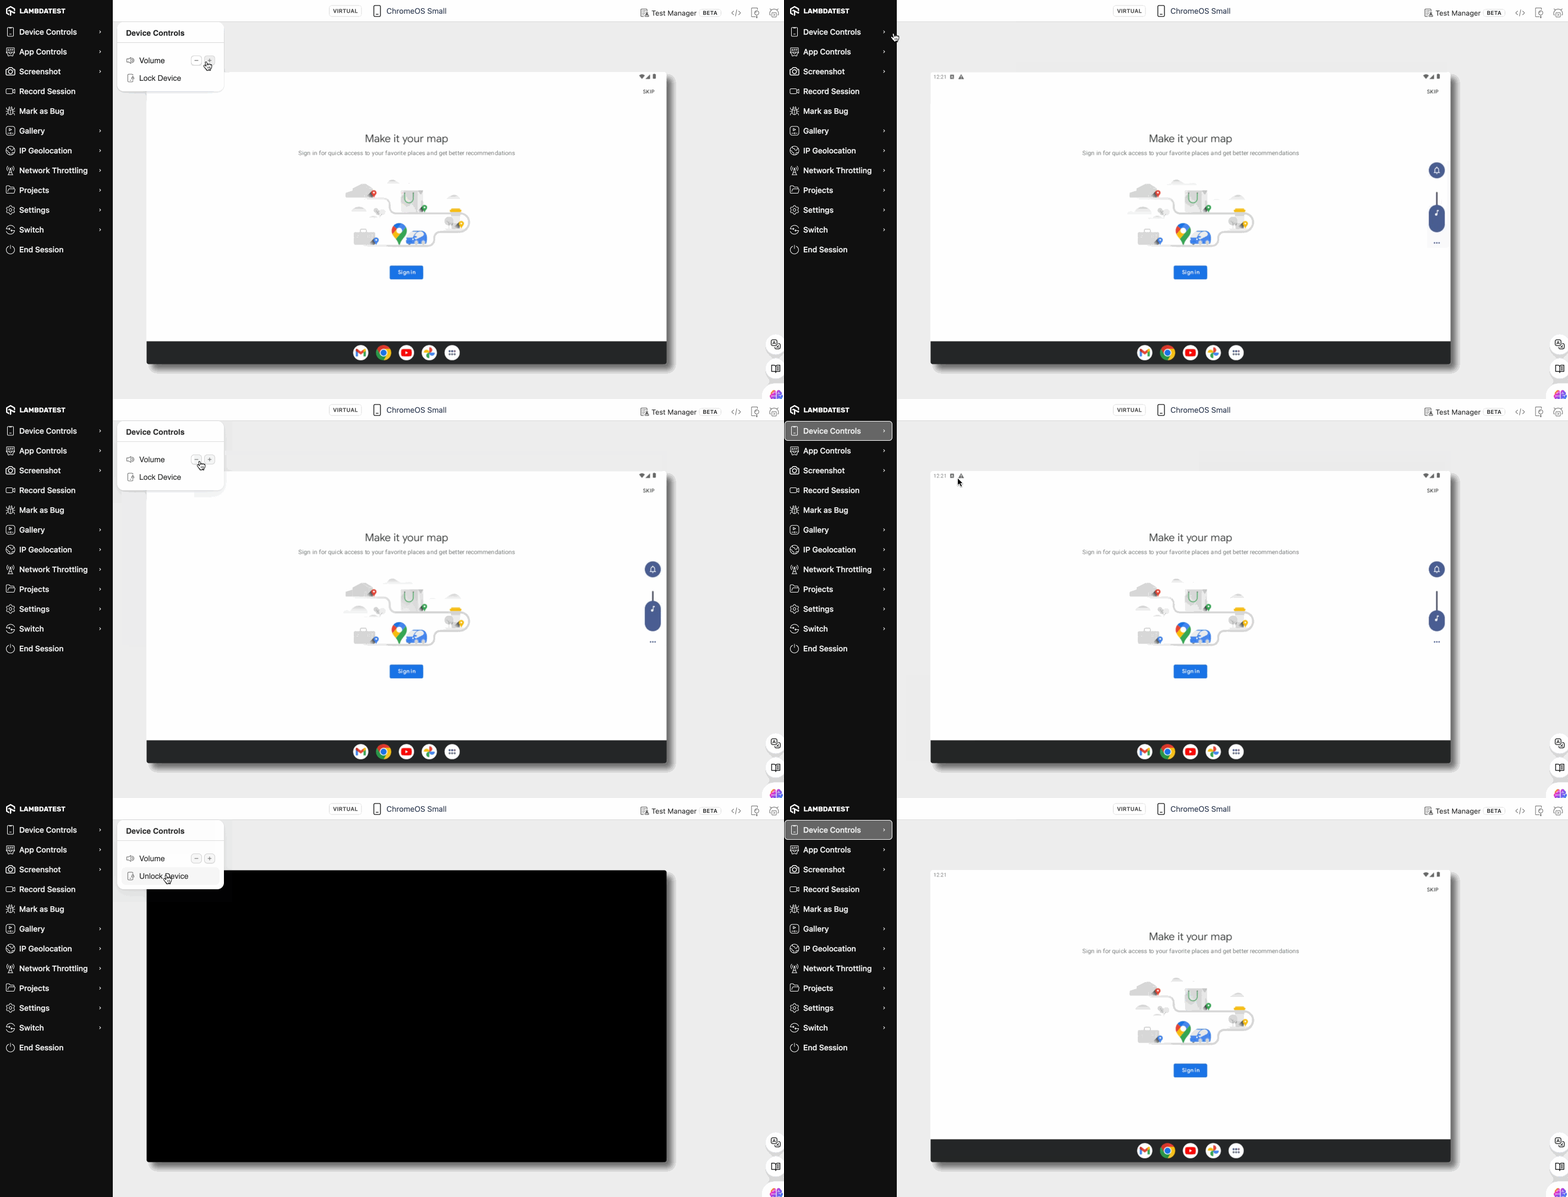
Device Controls
The Device Control feature allows you tp perform certain actions with your device within your current test session:
- Home: Use this option to navigate to the device's home screen during a manual session.
- Volume: Adjust the device volume directly within your testing session, ensuring optimal audio levels for your tests.
- Lock Device: Lock or unlock your device seamlessly during testing sessions without interrupting your workflow.
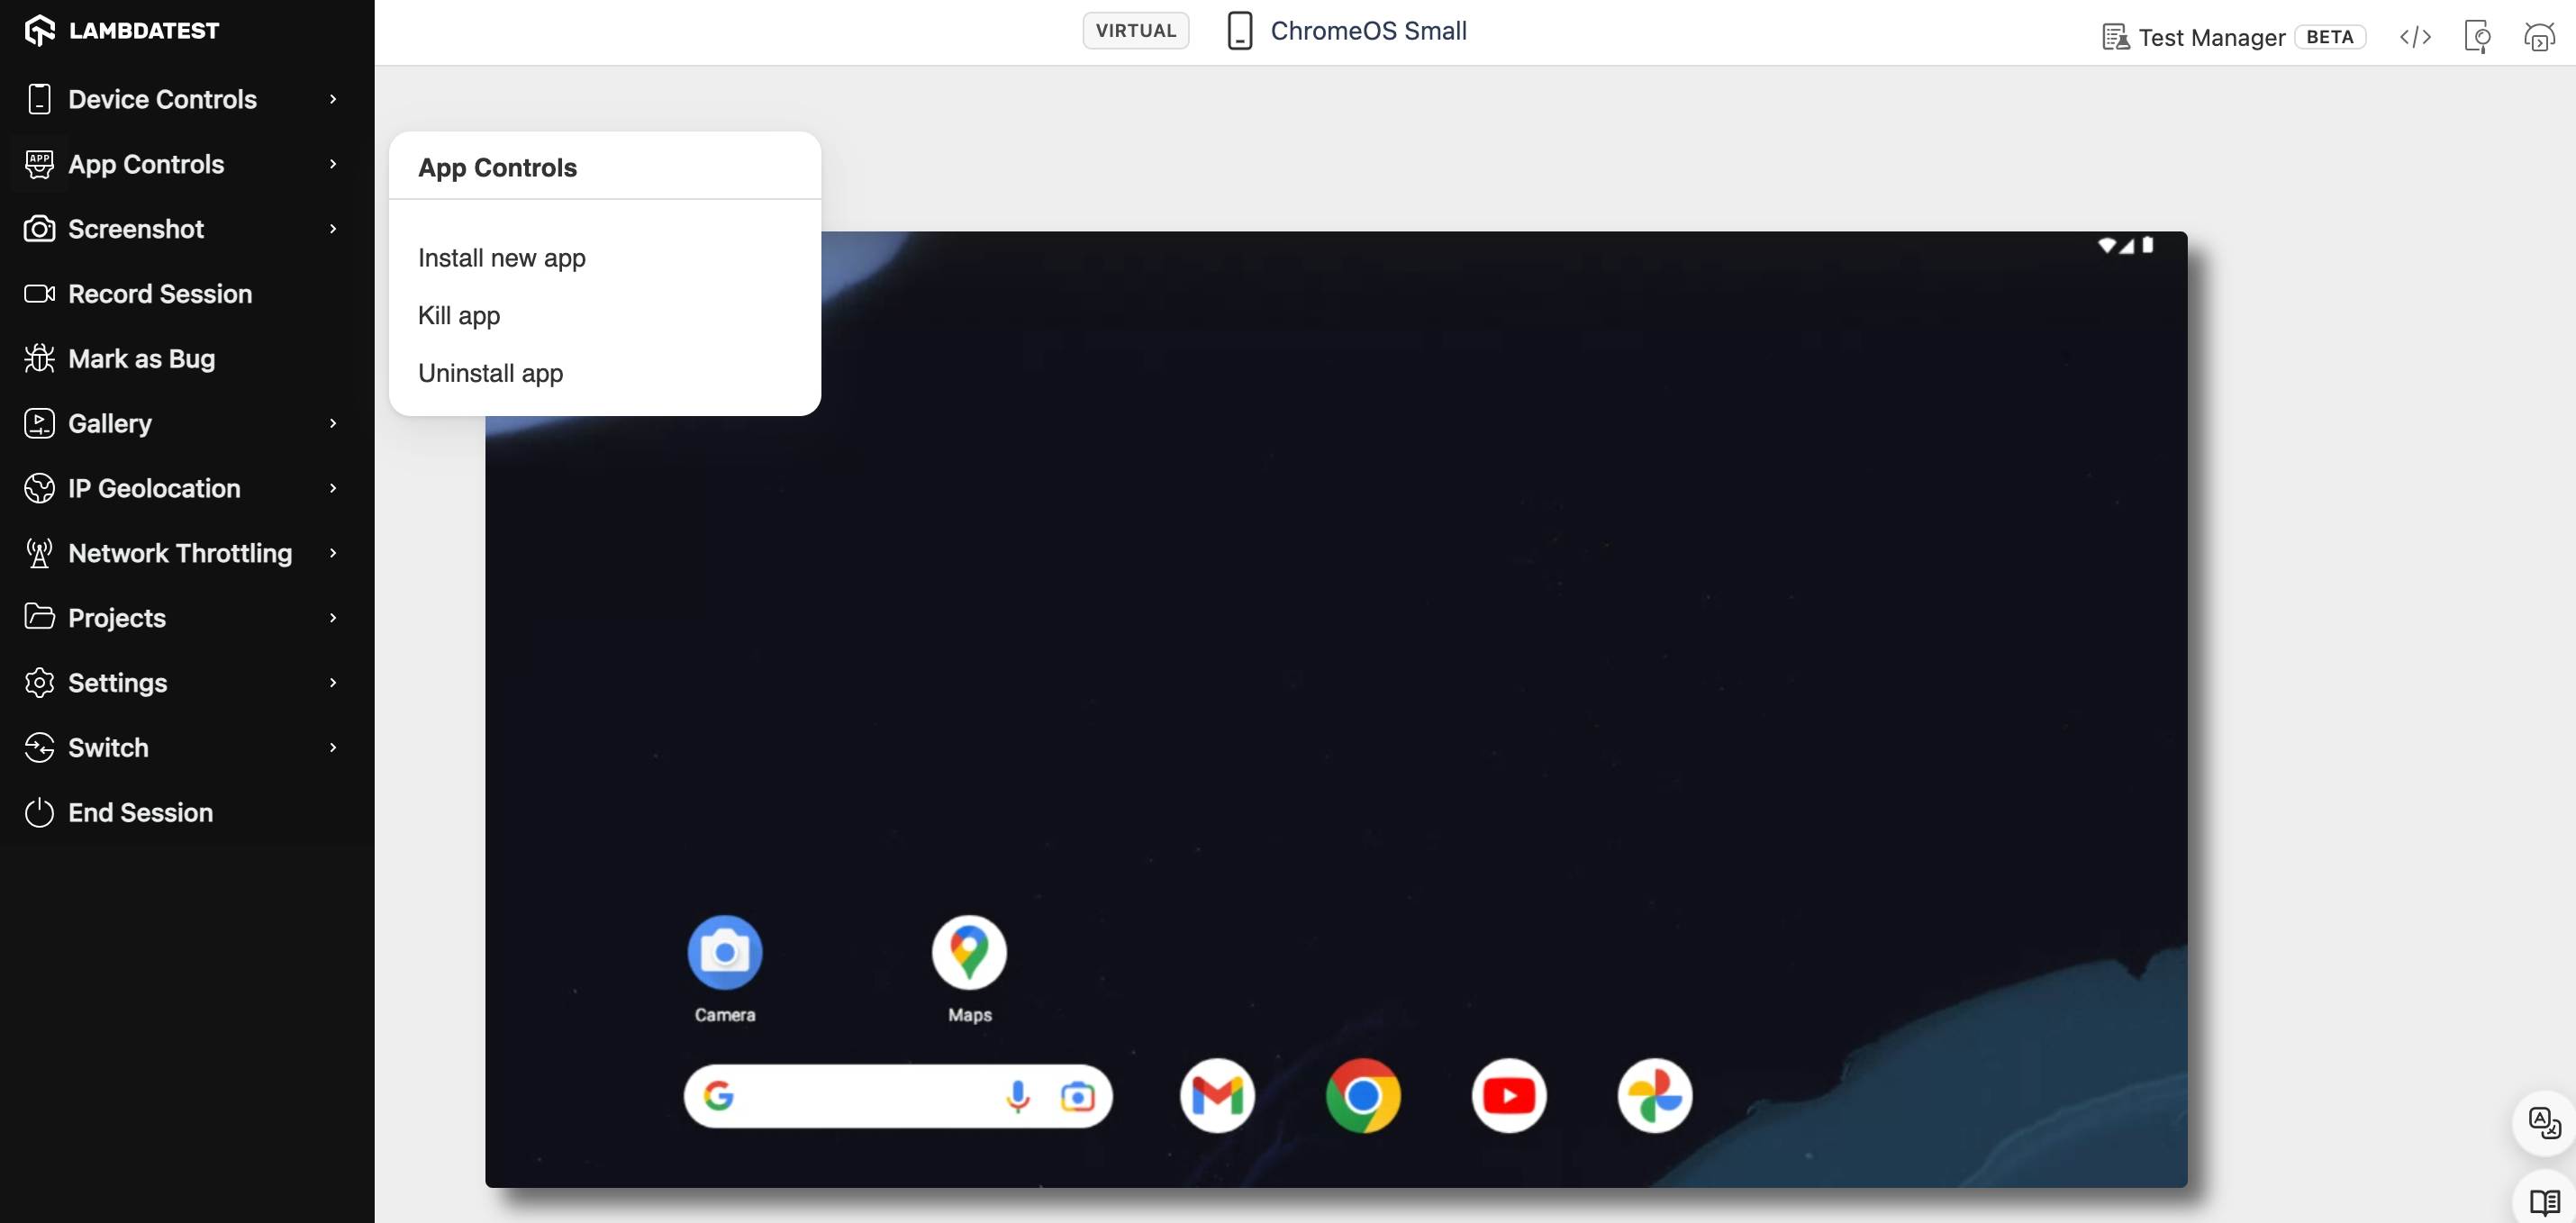
App Controls
This provide programmatic control over the applications installed within the emulator (e.g., install new app, kill the existing app, or uninstall the app). App Controls give you the power to do it all programmatically. This streamlines your testing process by eliminating the need for manual app manipulation within the emulator.
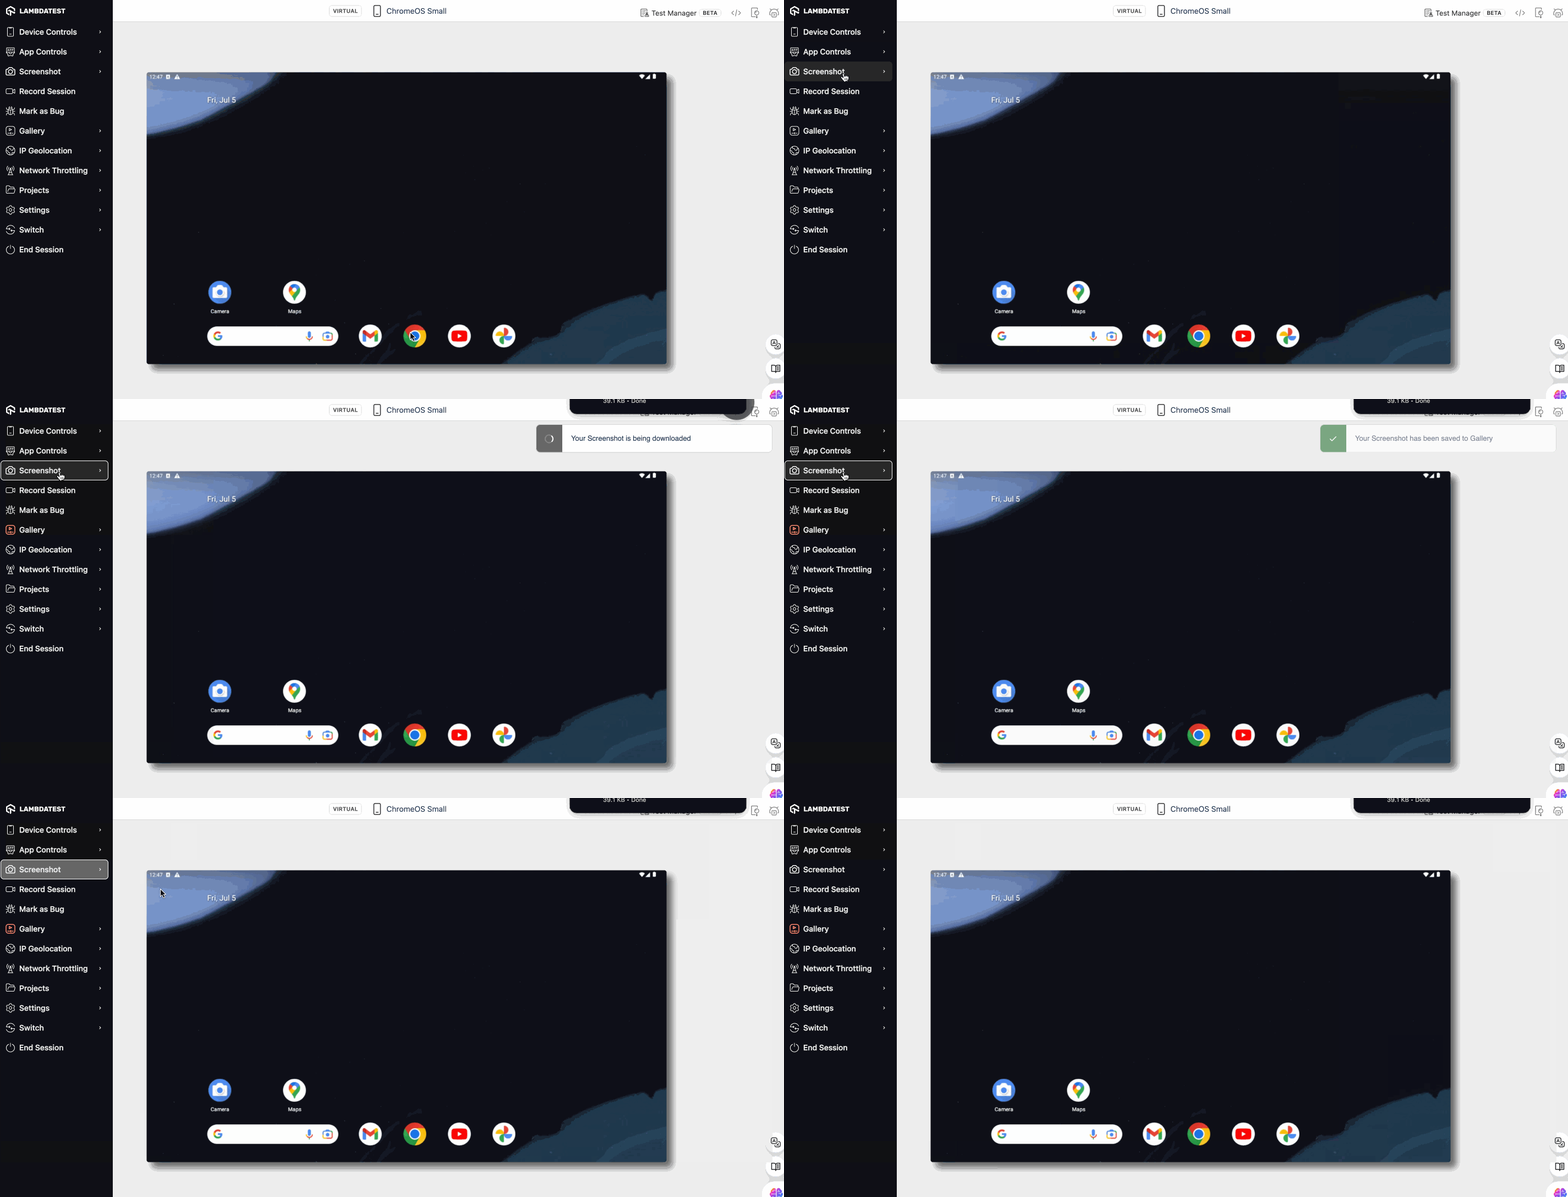
Screenshot
Screenshots remain a cornerstone for capturing static images of the current emulator screen. These screenshots serve as invaluable visual references throughout the testing process, aiding in bug reporting, test case documentation, and visual regression testing.
Record Session
This allows you to record a video of your testing session, providing a detailed playback for in-depth bug analysis, test case demonstrations, and comprehensive test case documentation.
Gallery
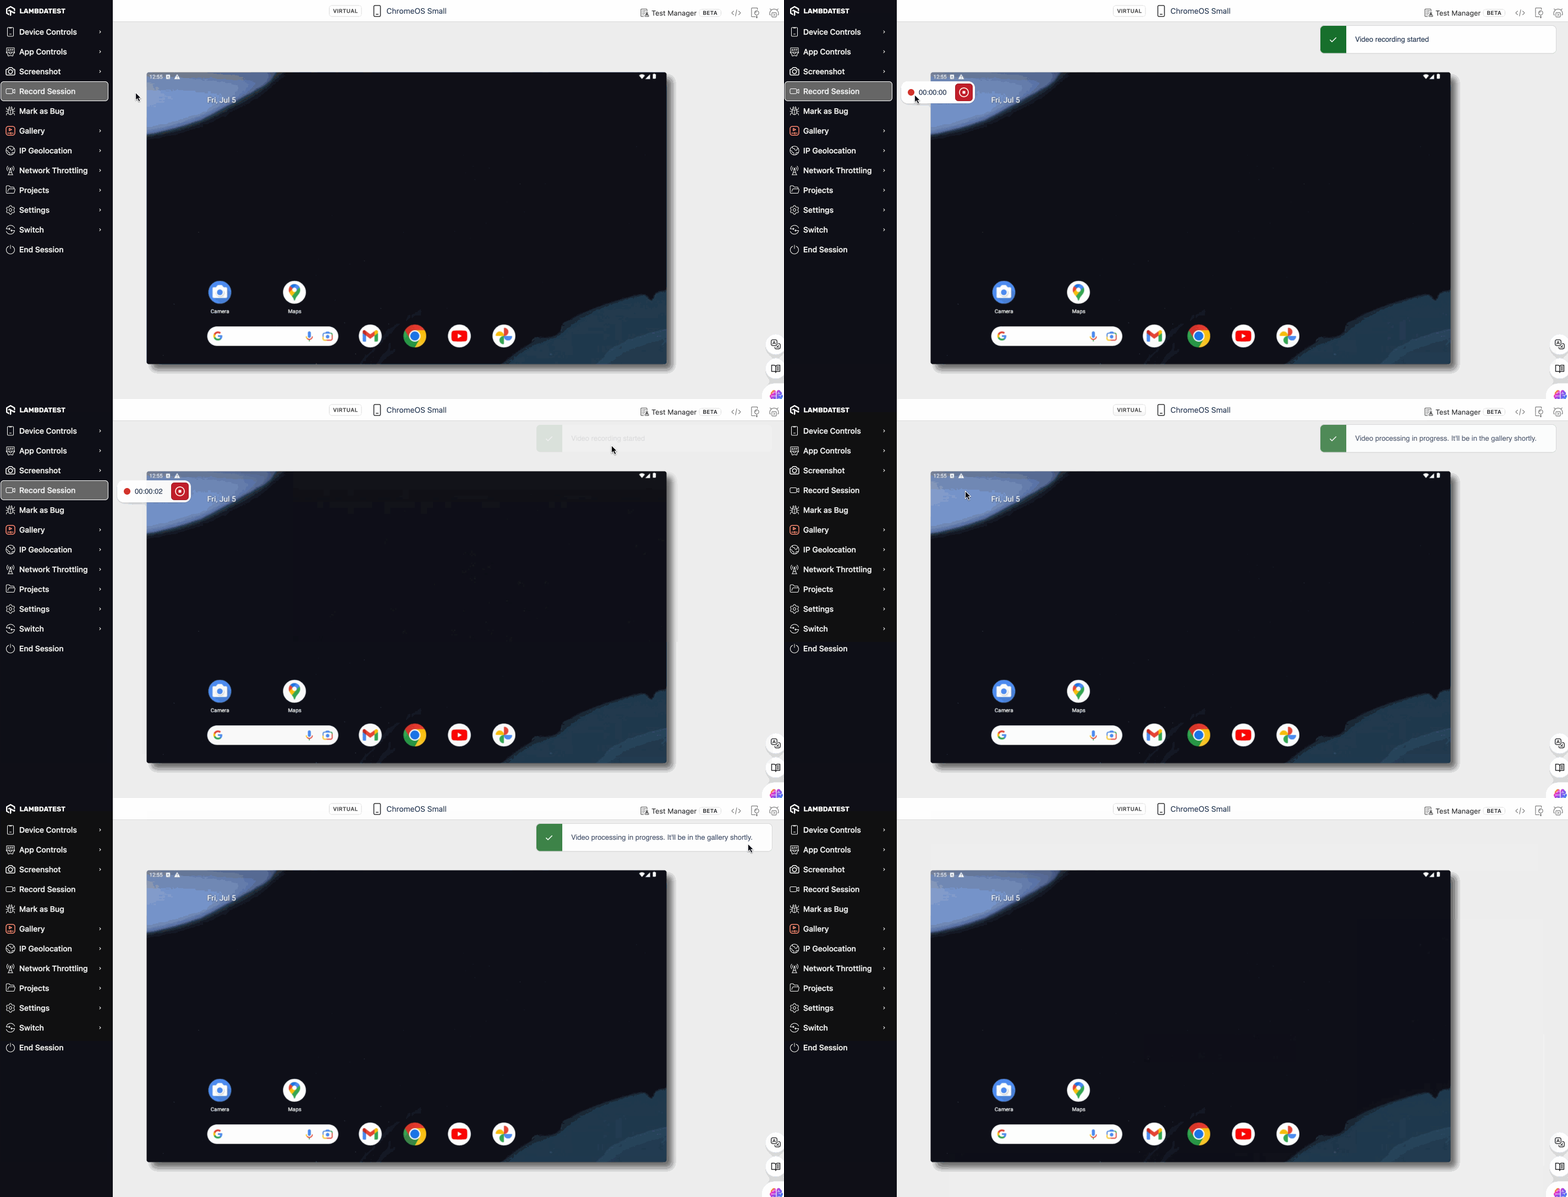
All screenshots and video recordings from test sessions are stored in the Gallery. To access, select Gallery from the left toolbar and you'll find the saved screenshots and videos. To download the screenshots or videos to your local machine, click on the Download icon. You can also mark them as bug by clicking on the Bug icon. To mark multiple screenshots as bugs, select the screenshots using the checkbox option, then click "Mark as Bug."
Mark as Bug
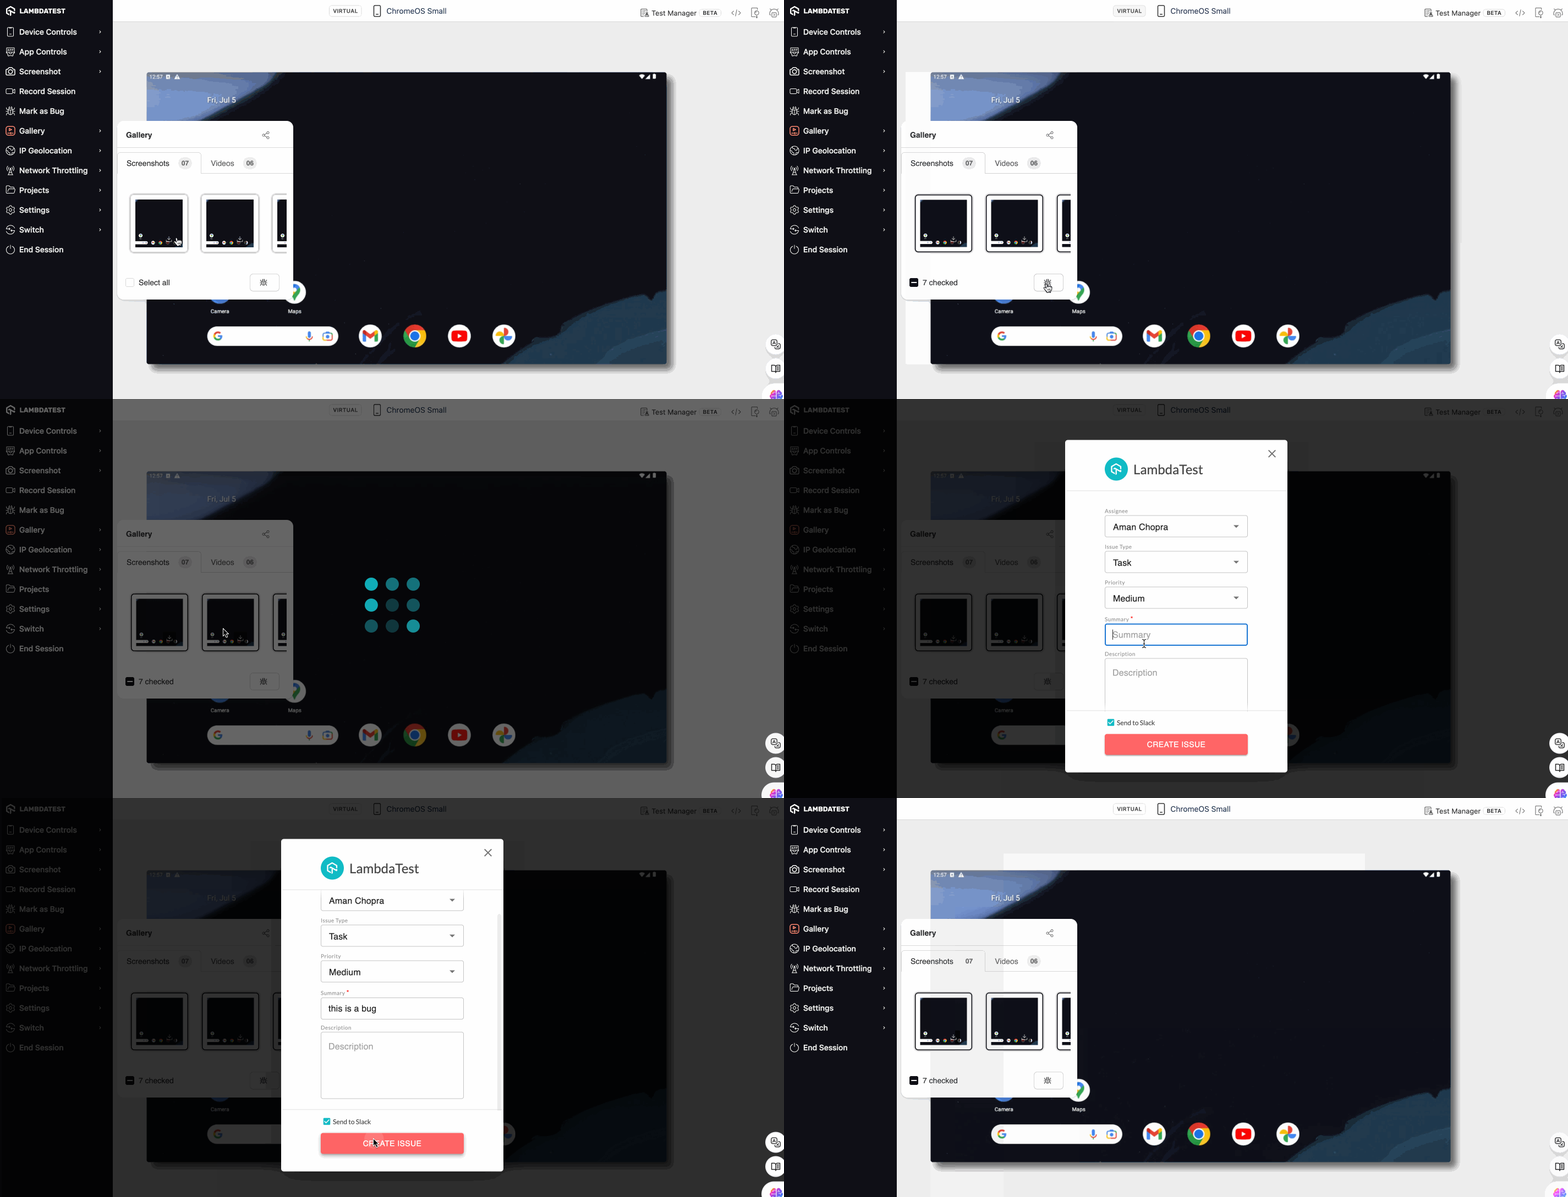
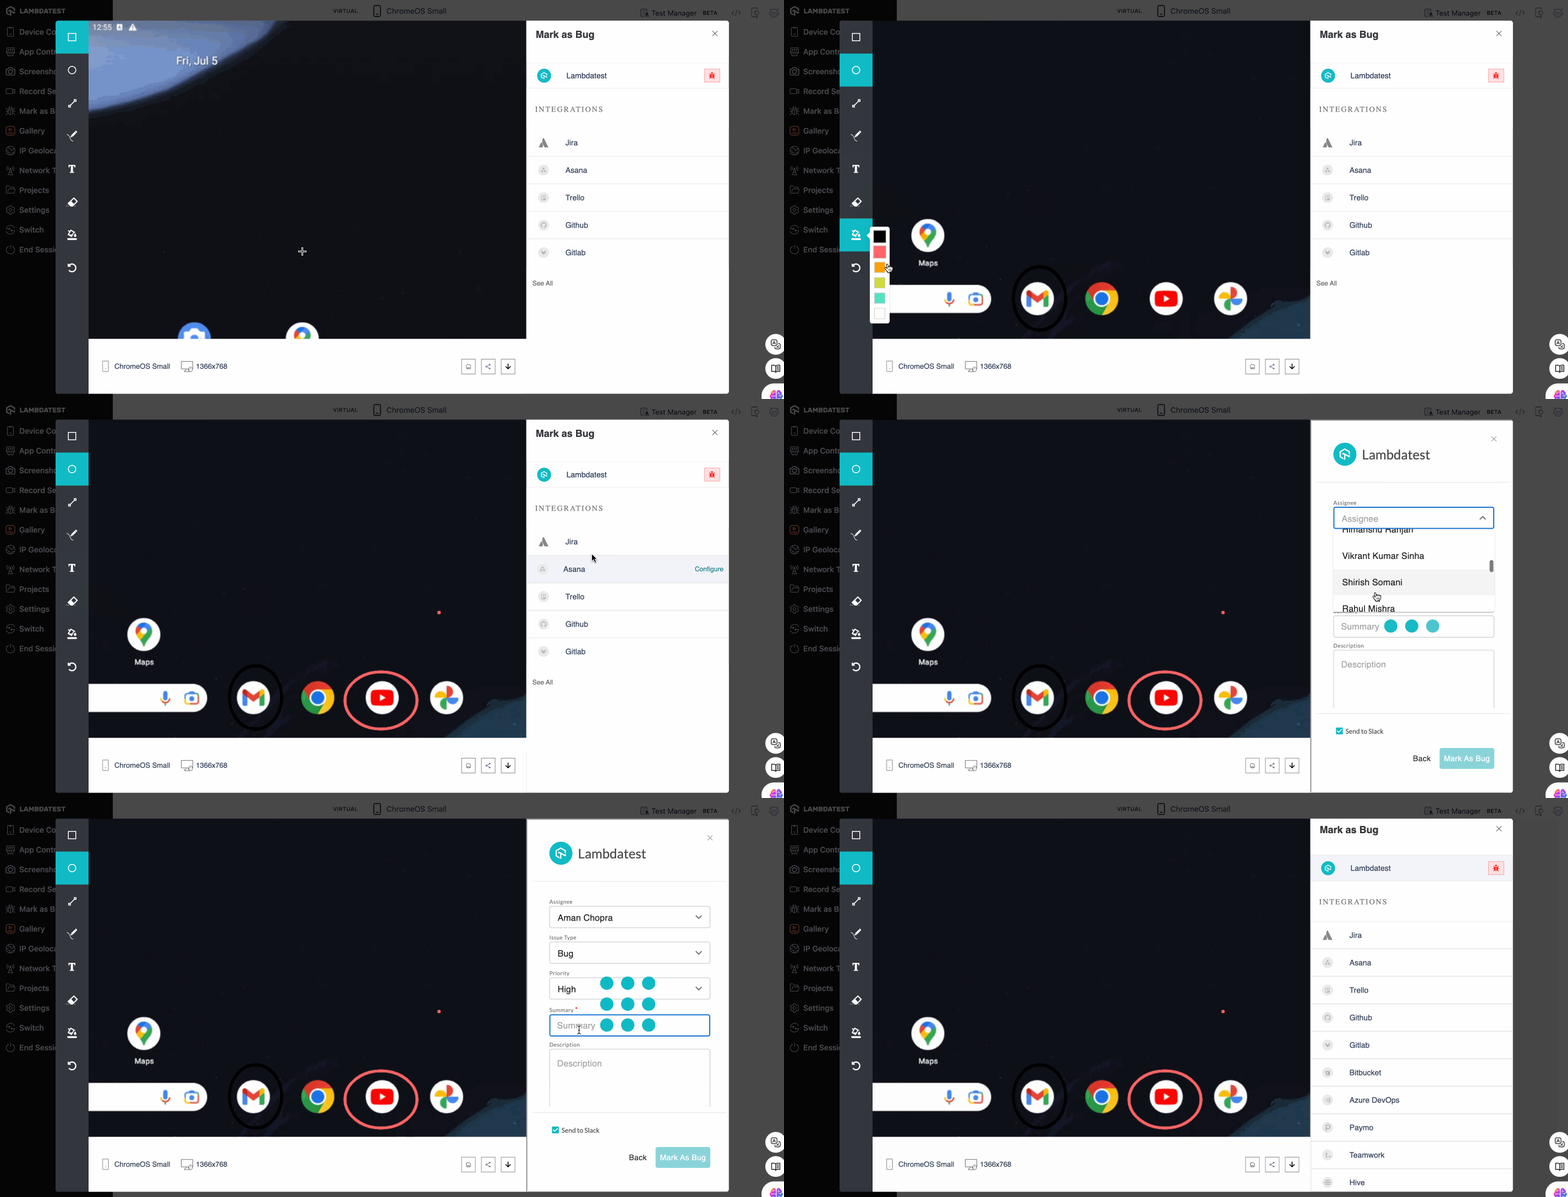
It empowers you to streamline bug reporting within the testing environment itself. Encounter a UI glitch? Simply capture a screenshot, optionally annotate it with relevant details using shapes, text, and color coding, and seamlessly report the bug via your preferred integrated project management tool. This integration eliminates the need for context switching and facilitates efficient bug reporting.
IP Geolocation
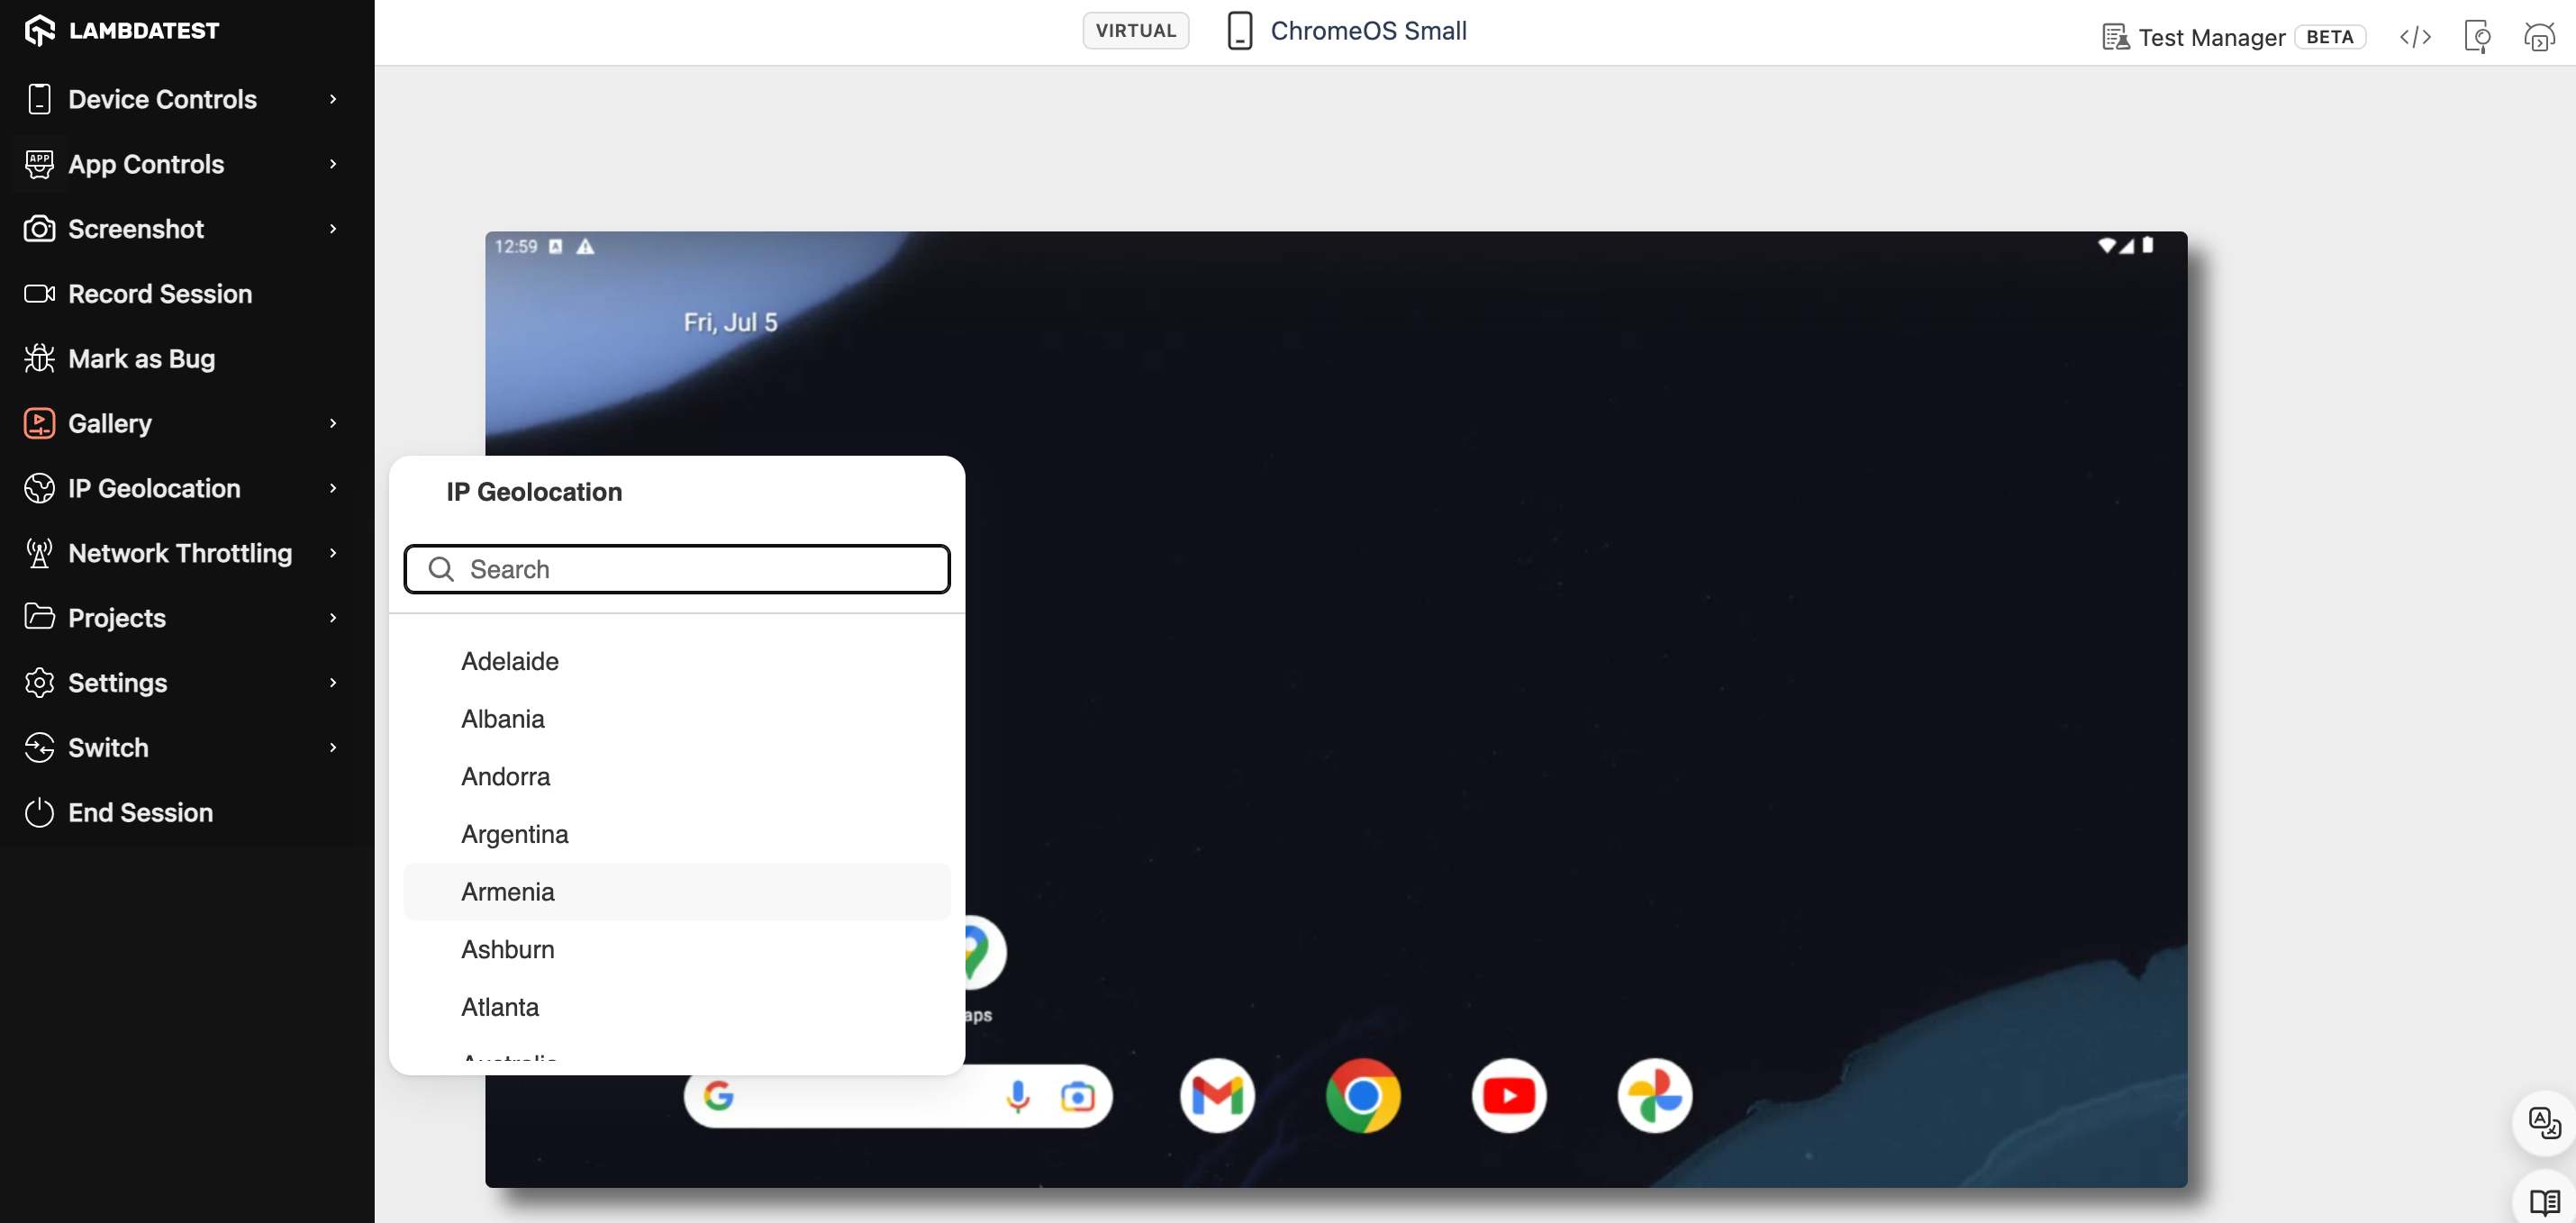
This transcends basic location selection. It allows you to spoof the IP address of your emulated device, simulating various geographical locations across over 45 countries. This enables you to test geo-restricted features, localized content delivery, and the overall user experience for a global audience.
Network Throttling
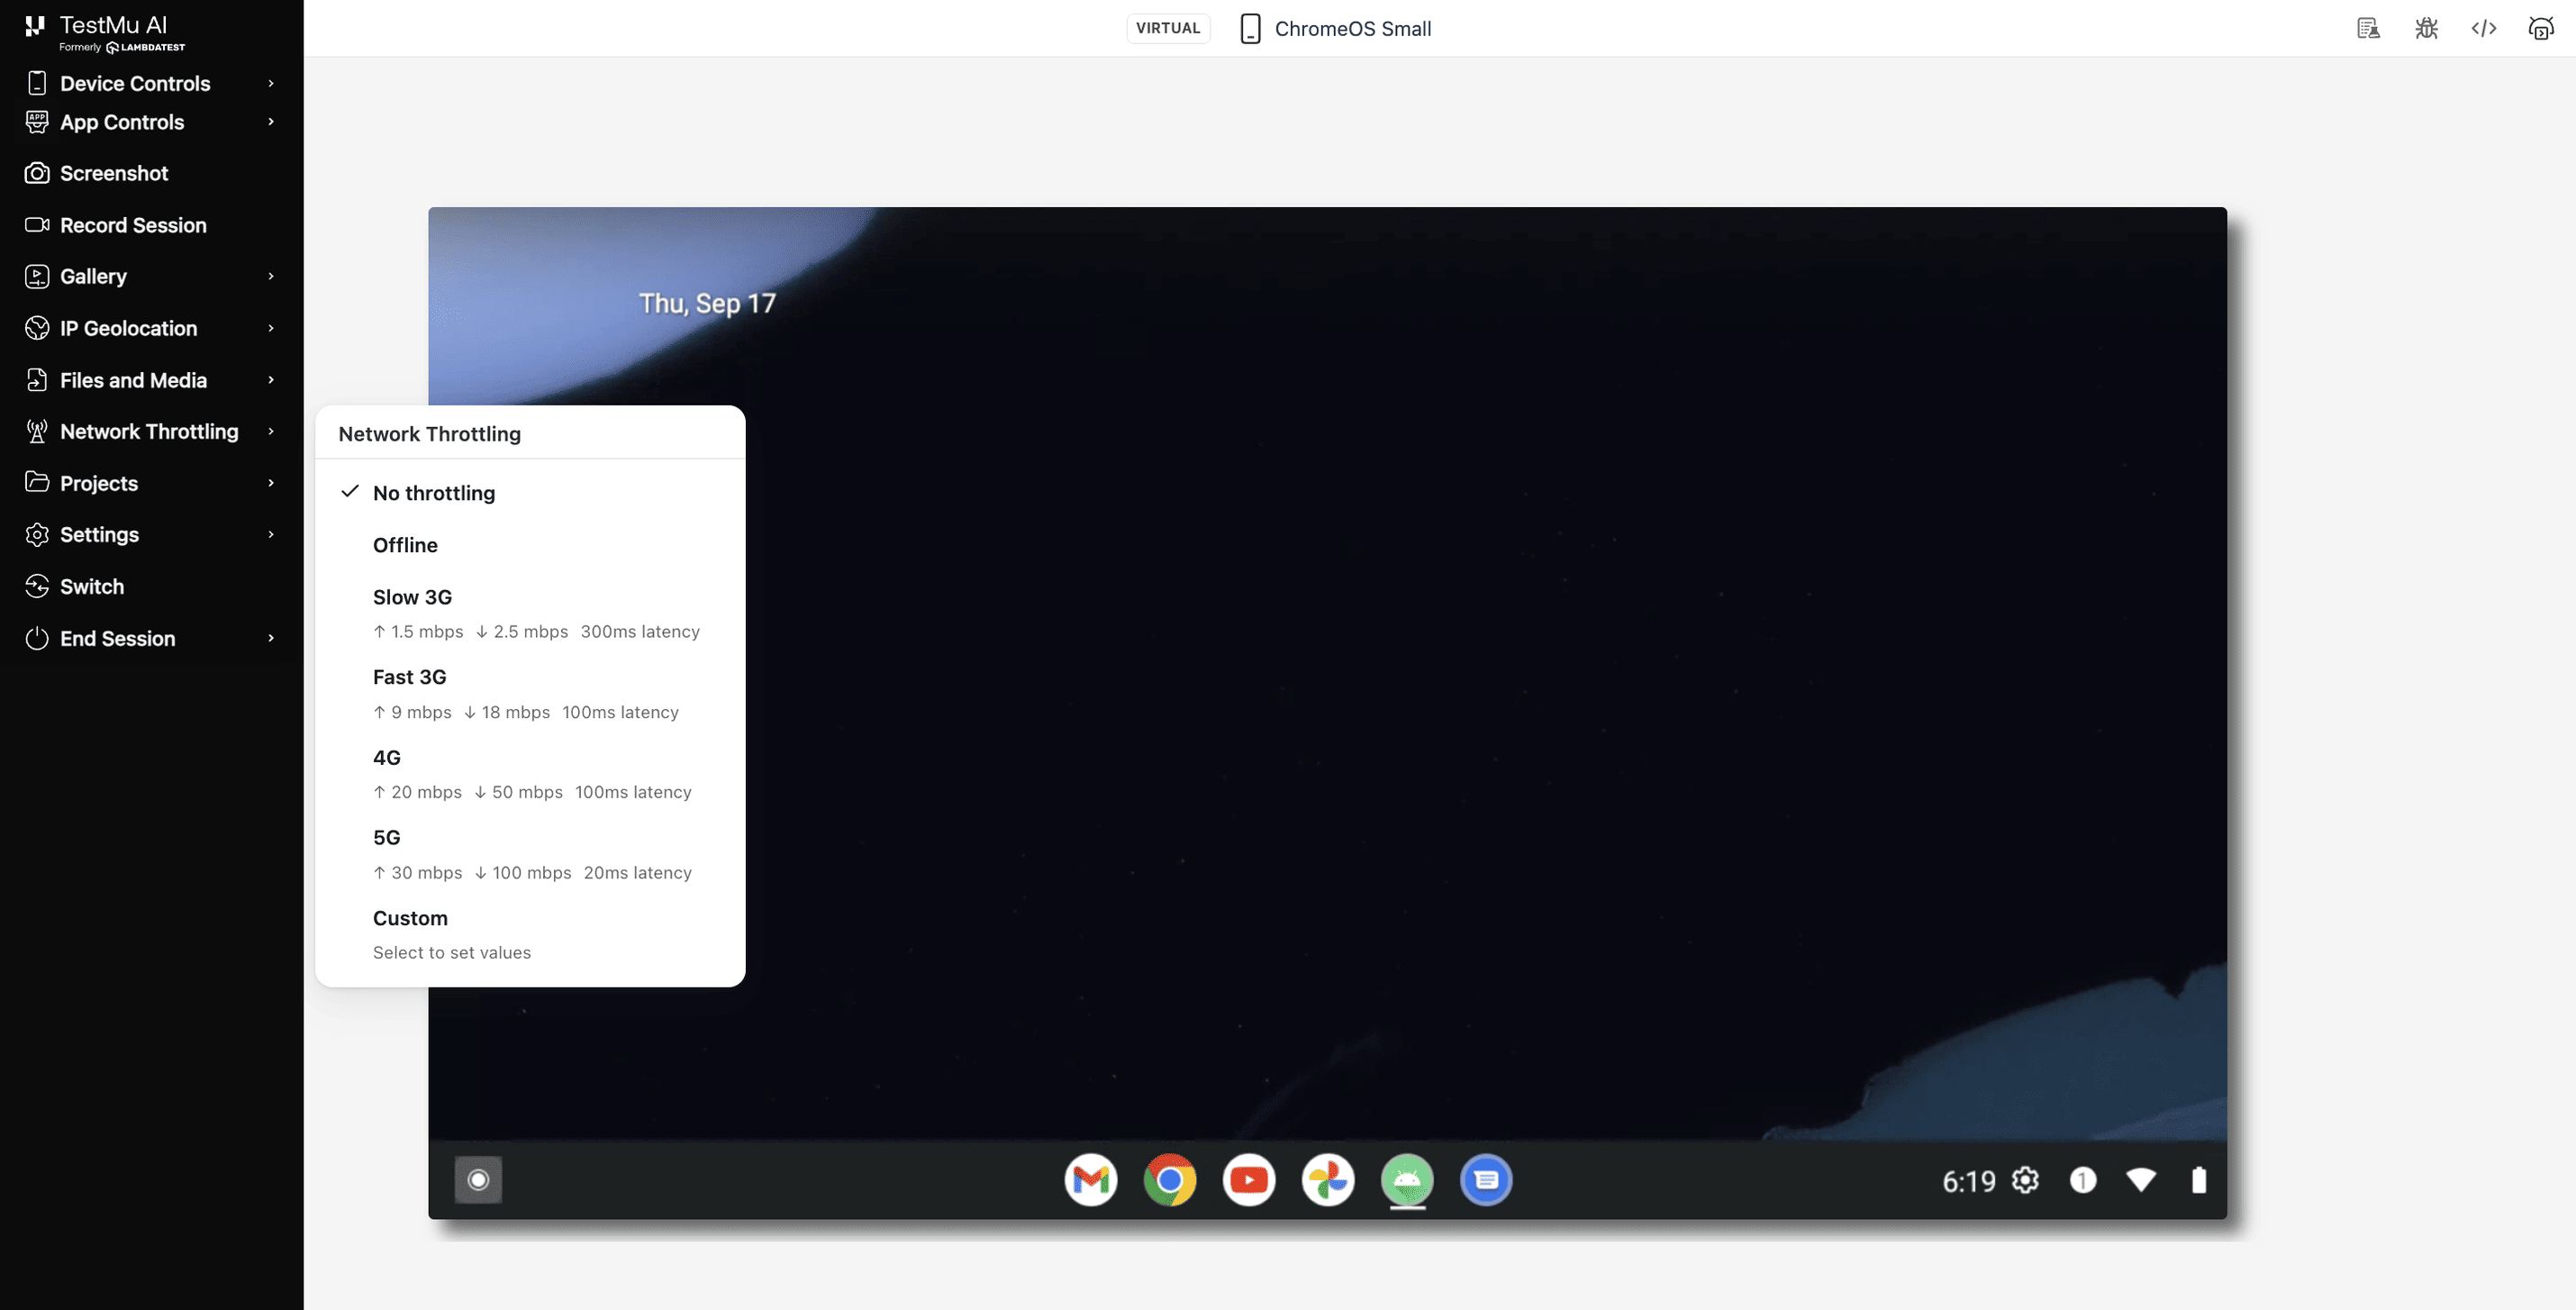
TestMu AI's network throttling feature empowers you to simulate real-world network conditions (Offline, Slow 3G, Fast 3G, 4G, 5G and Custom) during testing. This allows you to assess your application performance under varying internet speeds, ensuring a seamless user experience across different network environments. You can leverage predefined network profiles or craft custom settings for comprehensive testing.
Settings
The settings section offer the following features:
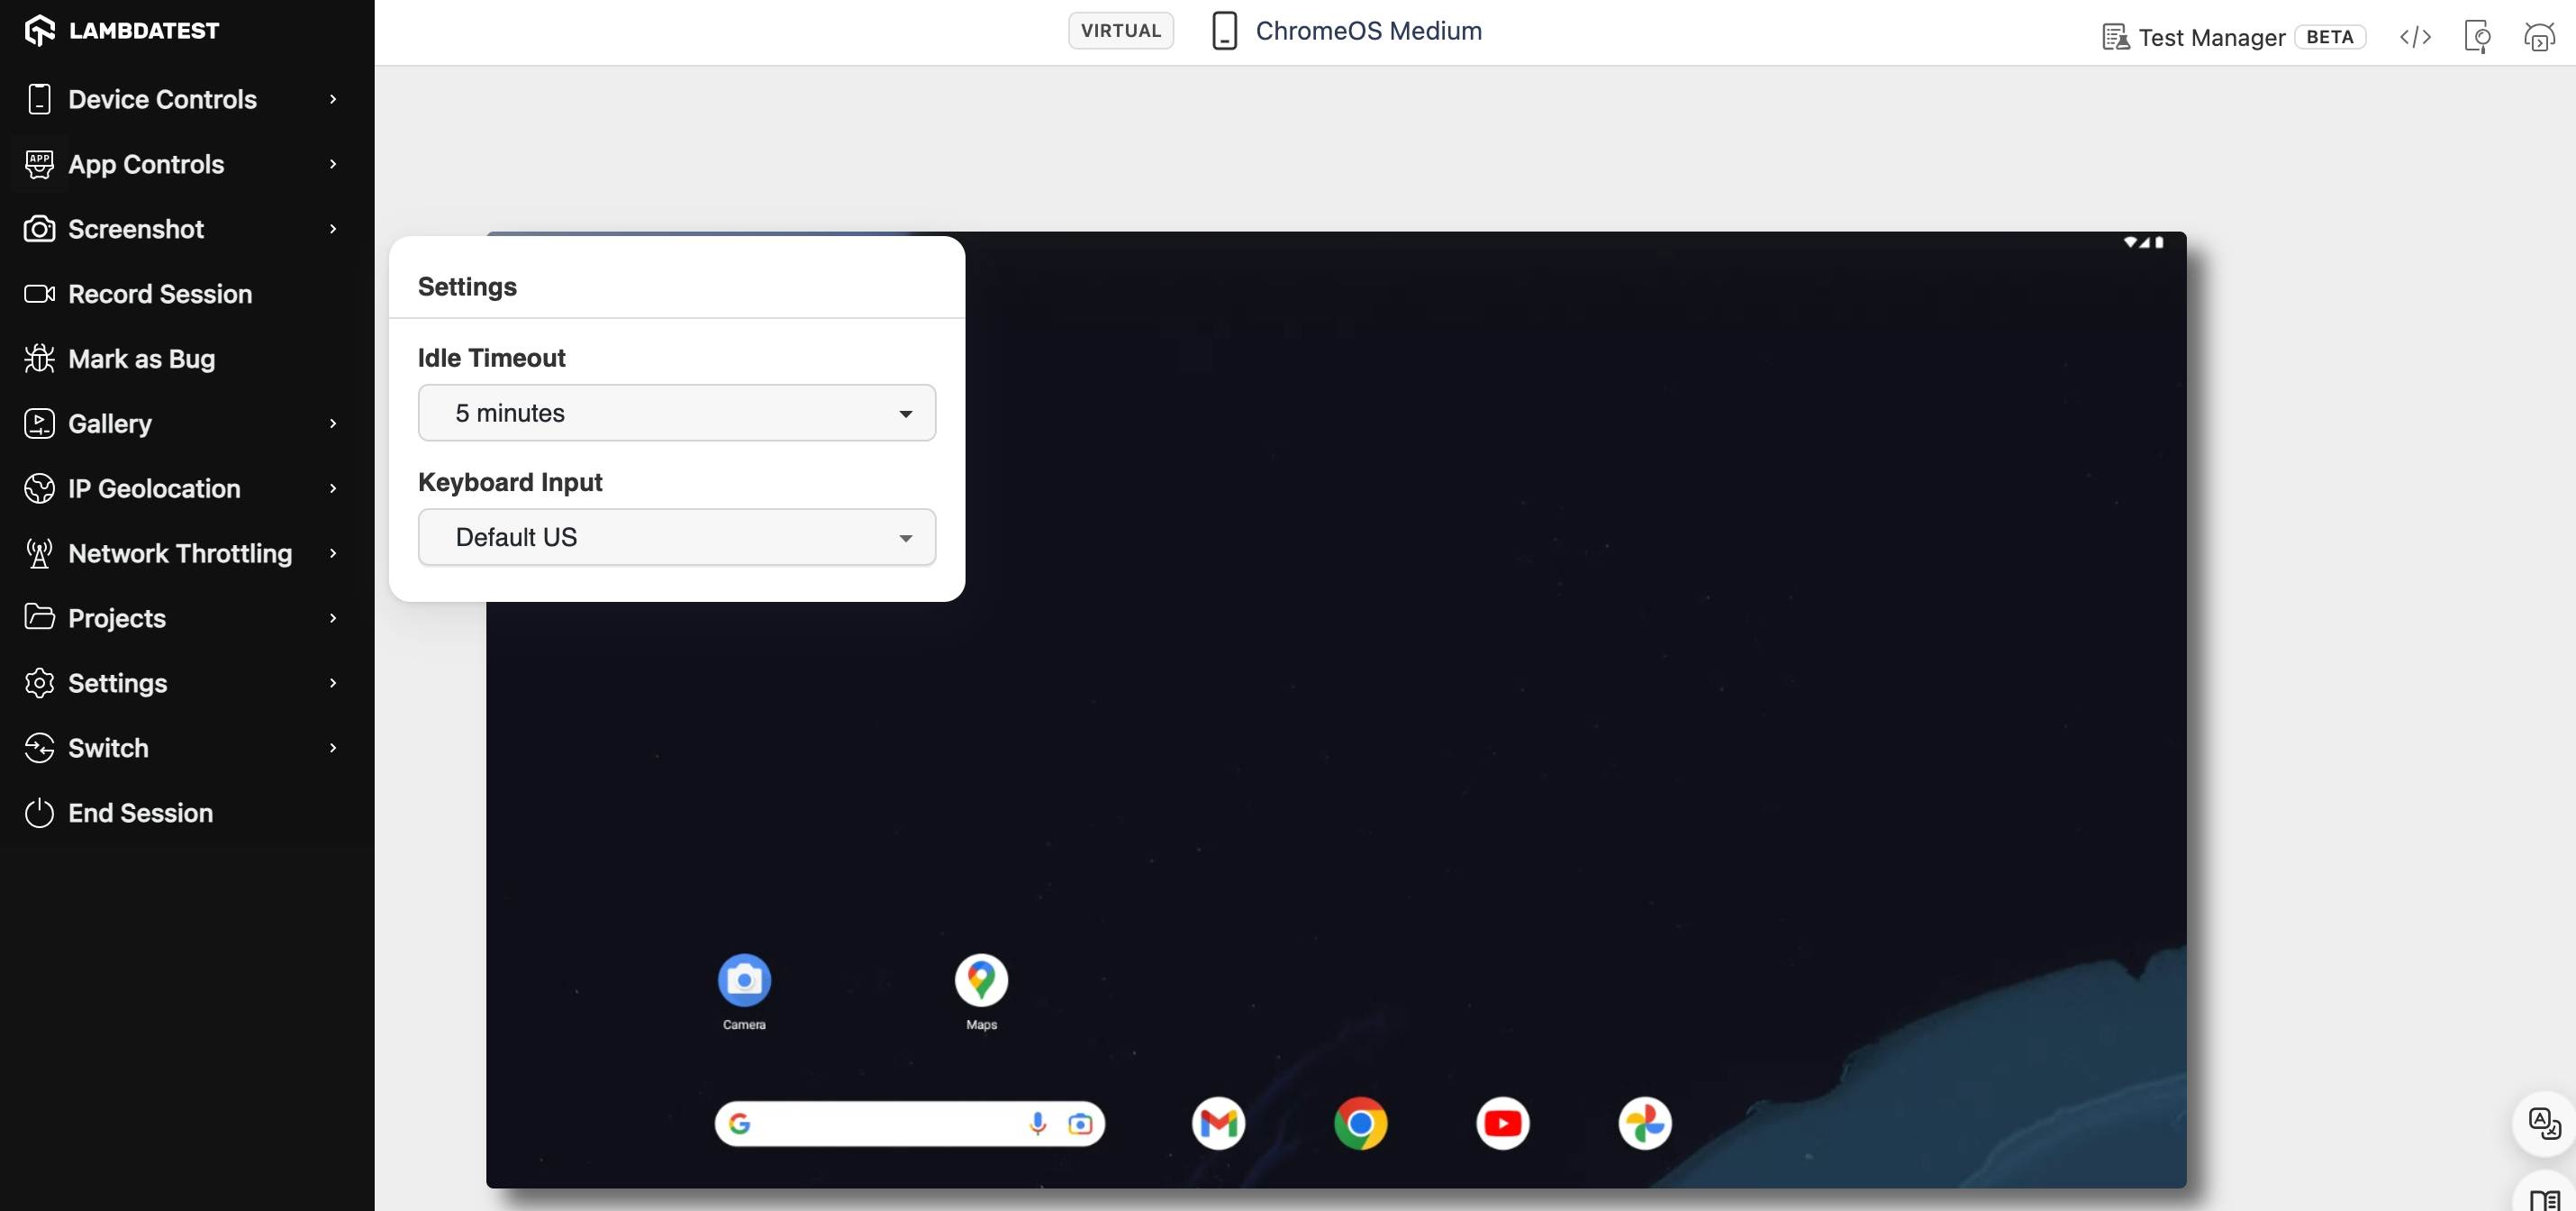
- Idle Timeout : This feature allows you to set the idle timeout for your test session. The default Idle Timeout is 5 minutes and the maximum limit is 60 minutes.
- Time Zone : With this feature, you can select the time zone of your preferred region that align with your testing needs.
- Keyboard Input : With this feature, you can change the language in your test session for a more localized testing experience.
Switch
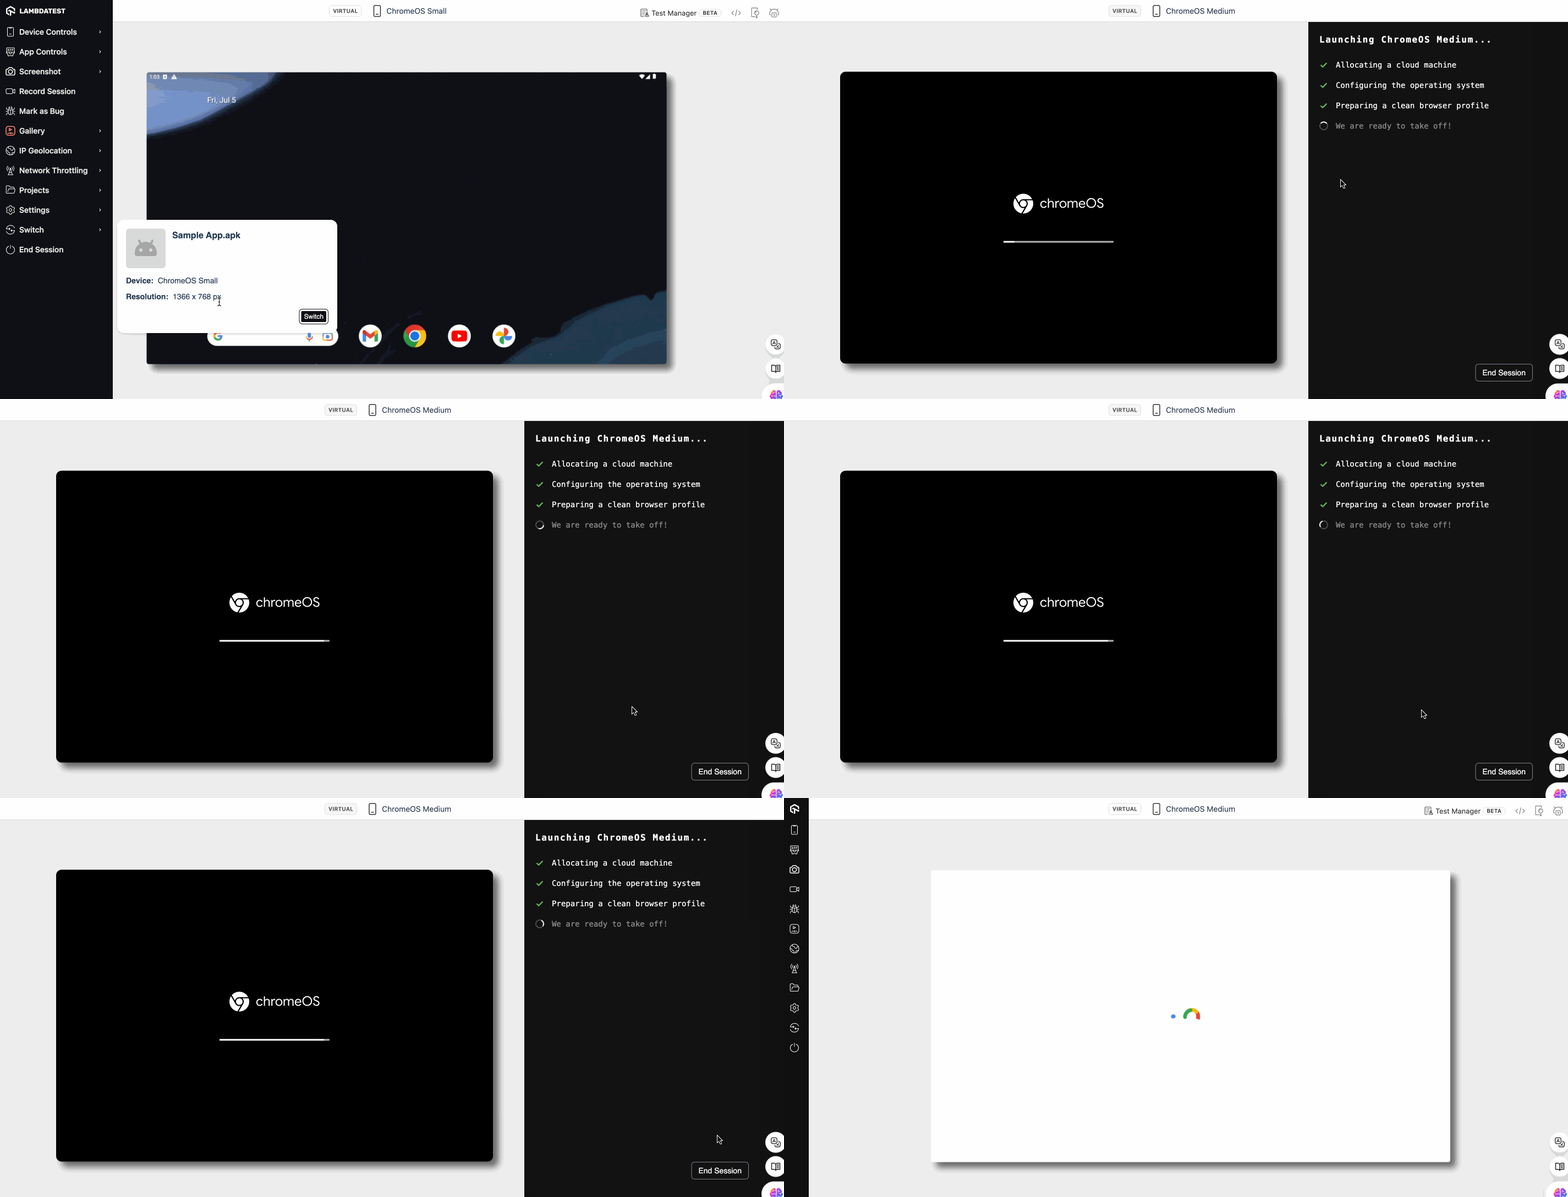
Switch allows you to seamlessly switch between multiple emulated devices within the same project. This eliminates the need to tear down and rebuild individual emulators, streamlining your testing workflow and enabling you to compare app behavior across different ChromeOS device configurations.
End Session
Terminates the current emulator instance, freeing up resources and allowing you to start a fresh session with a clean slate.
Advance Tools
UI Inspector
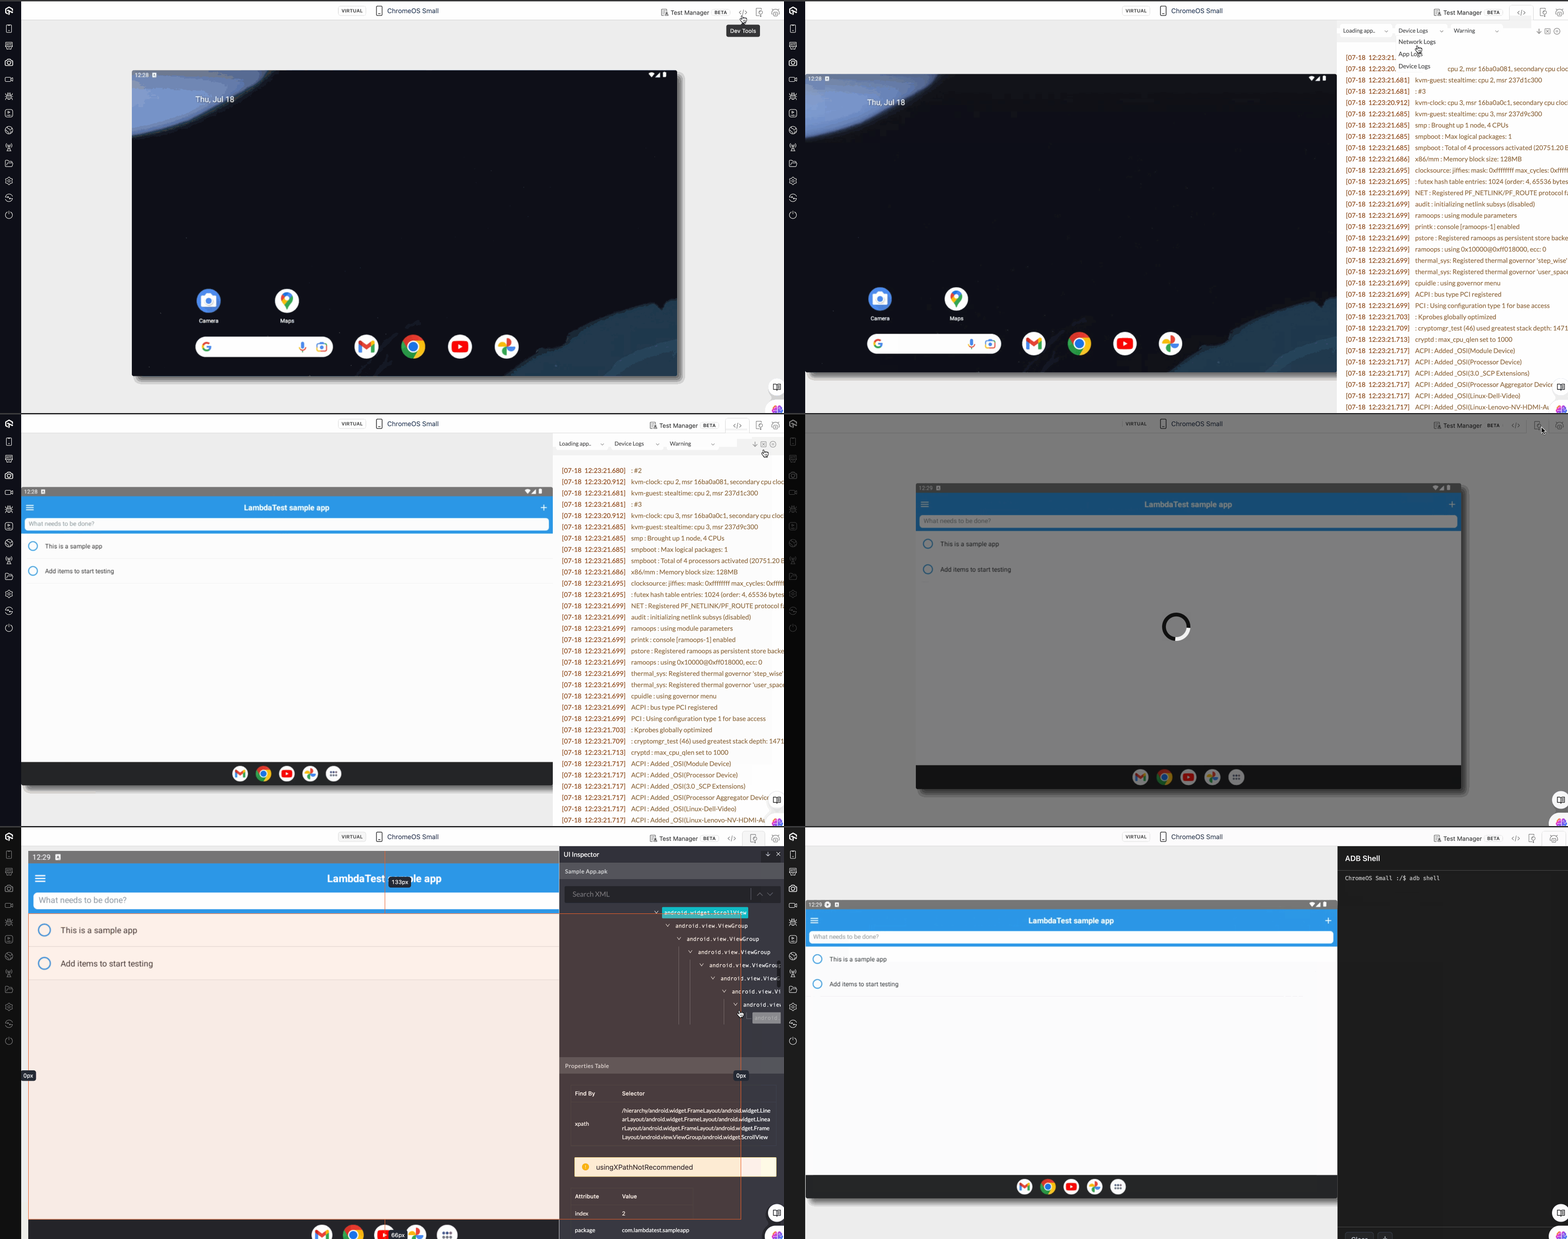
This is designed to examine and interact with the user interface (UI) elements of your mobile apps, or desktop applications. It acts like a behind-the-scenes detective, allowing you to delve into the inner workings of your app's interface.
DevTools
This provide access to all types of logs (Device, Network, and App) and you can also sort them as per their status (Activity, Warning, Debug, Error). You can also download these logs.
Adb Shell
It provides a Unix-like shell environment, allowing you to execute commands on the device itself. It is used for interacting with the Android operating system directly on a connected Android device or emulator.
 Chat with Us