Image Analyzer Testing With TestMu AI
The TestMu AI Agent Testing Platform tests an image agent by submitting prompts or images and scoring the returned output against the prompt and any criteria you define. Each image gets a Quality Score from 0 to 100, plus a breakdown of what matched and what did not. It covers image generation, content moderation, and photo validation.
You upload images by file or URL, define what a correct image looks like, and the platform scores them. A single run analyzes up to 50 images, which suits regression testing after a model update.
How to Run Your First Image Analyzer Test
Follow these five steps in the dashboard.
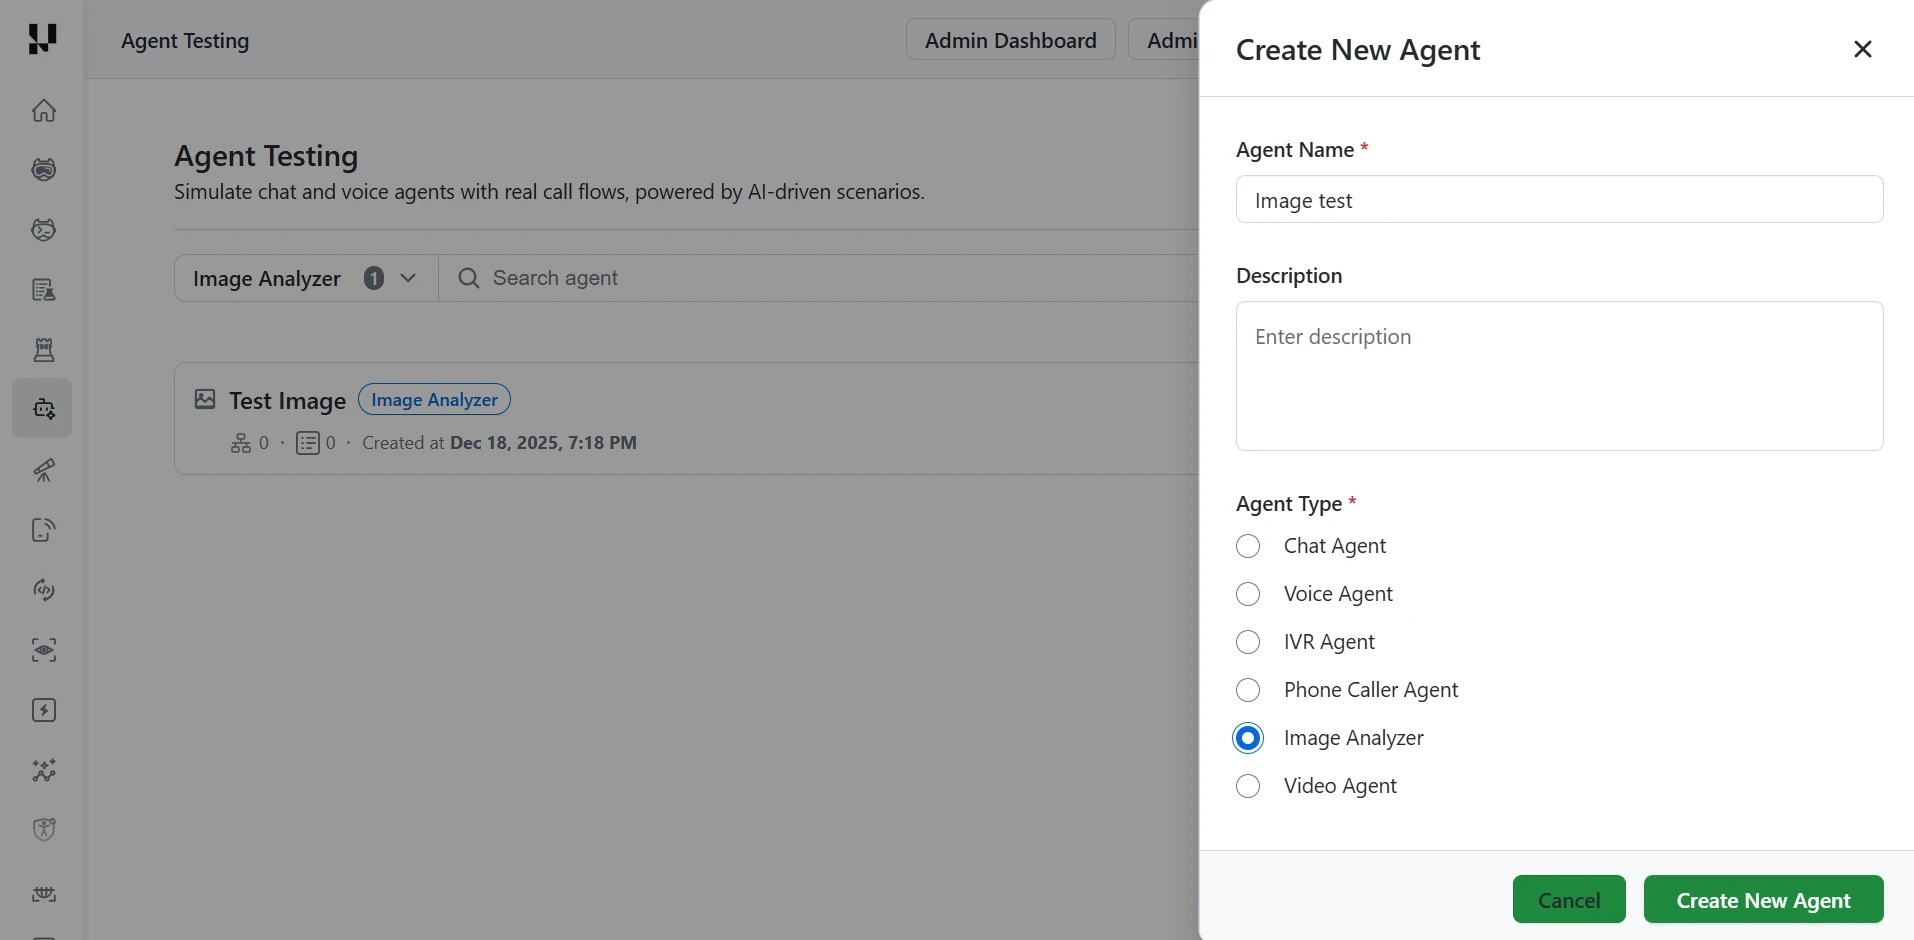
Step 1: Create the agent. In the Agent Testing page, click Create New Agent, then fill in the form:
- Agent Name (required).
- Description (optional).
- Agent Type (required): select Image Analyzer.
Click Create New Agent to confirm.
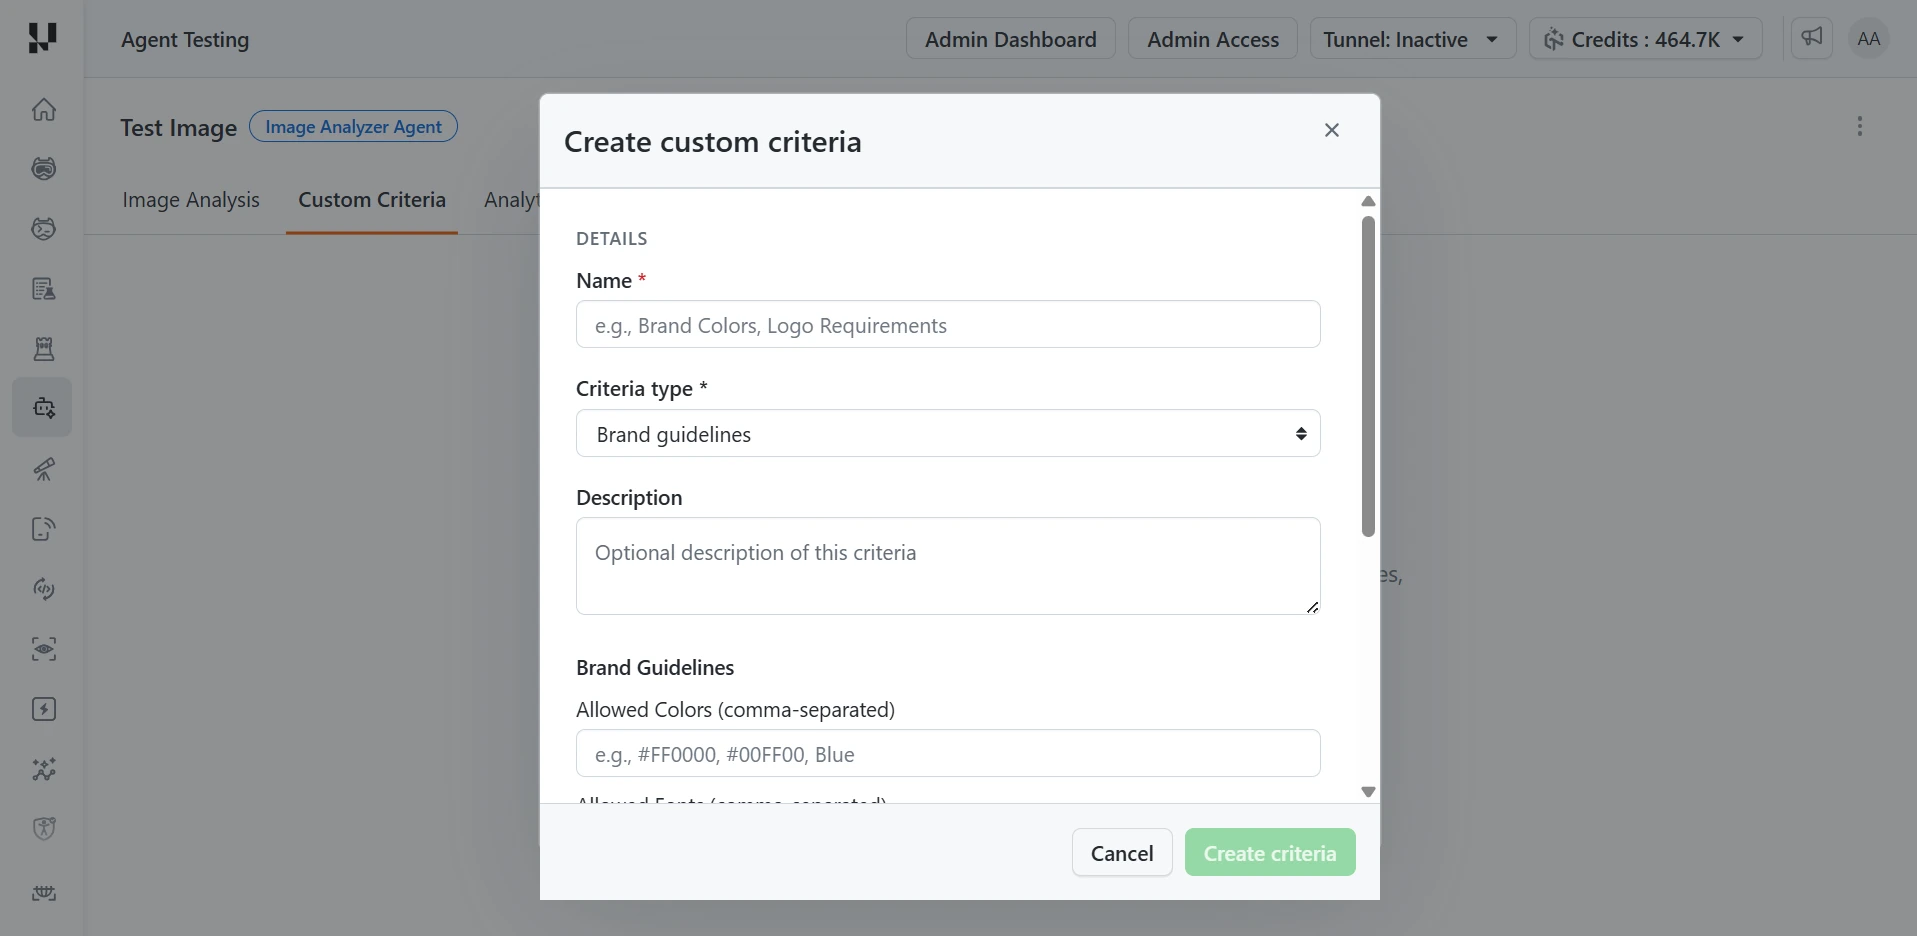
Step 2 (optional): Add custom criteria. Skip this step if the prompt alone defines a correct image. If your images must also follow brand guidelines or technical specifications, open the Custom Criteria tab and create the criteria before you analyze:
- Give each criterion a Name that says what it checks, such as Brand Colors, so its result is easy to find in an analysis.
- Choose the Criteria type: Brand guidelines, Technical specifications, or Custom rules. The fields below it change to match the type.
- Fill in the rules. Enter lists, such as allowed colors, as comma-separated values, for example
#FF0000, #00FF00, Blue. - Click Create criteria.
Every active criterion is checked on each analysis and returns a Pass, Fail, or Partial result, so switch off any criterion that doesn't apply to the images you're about to test. See Features for what each criteria type covers.
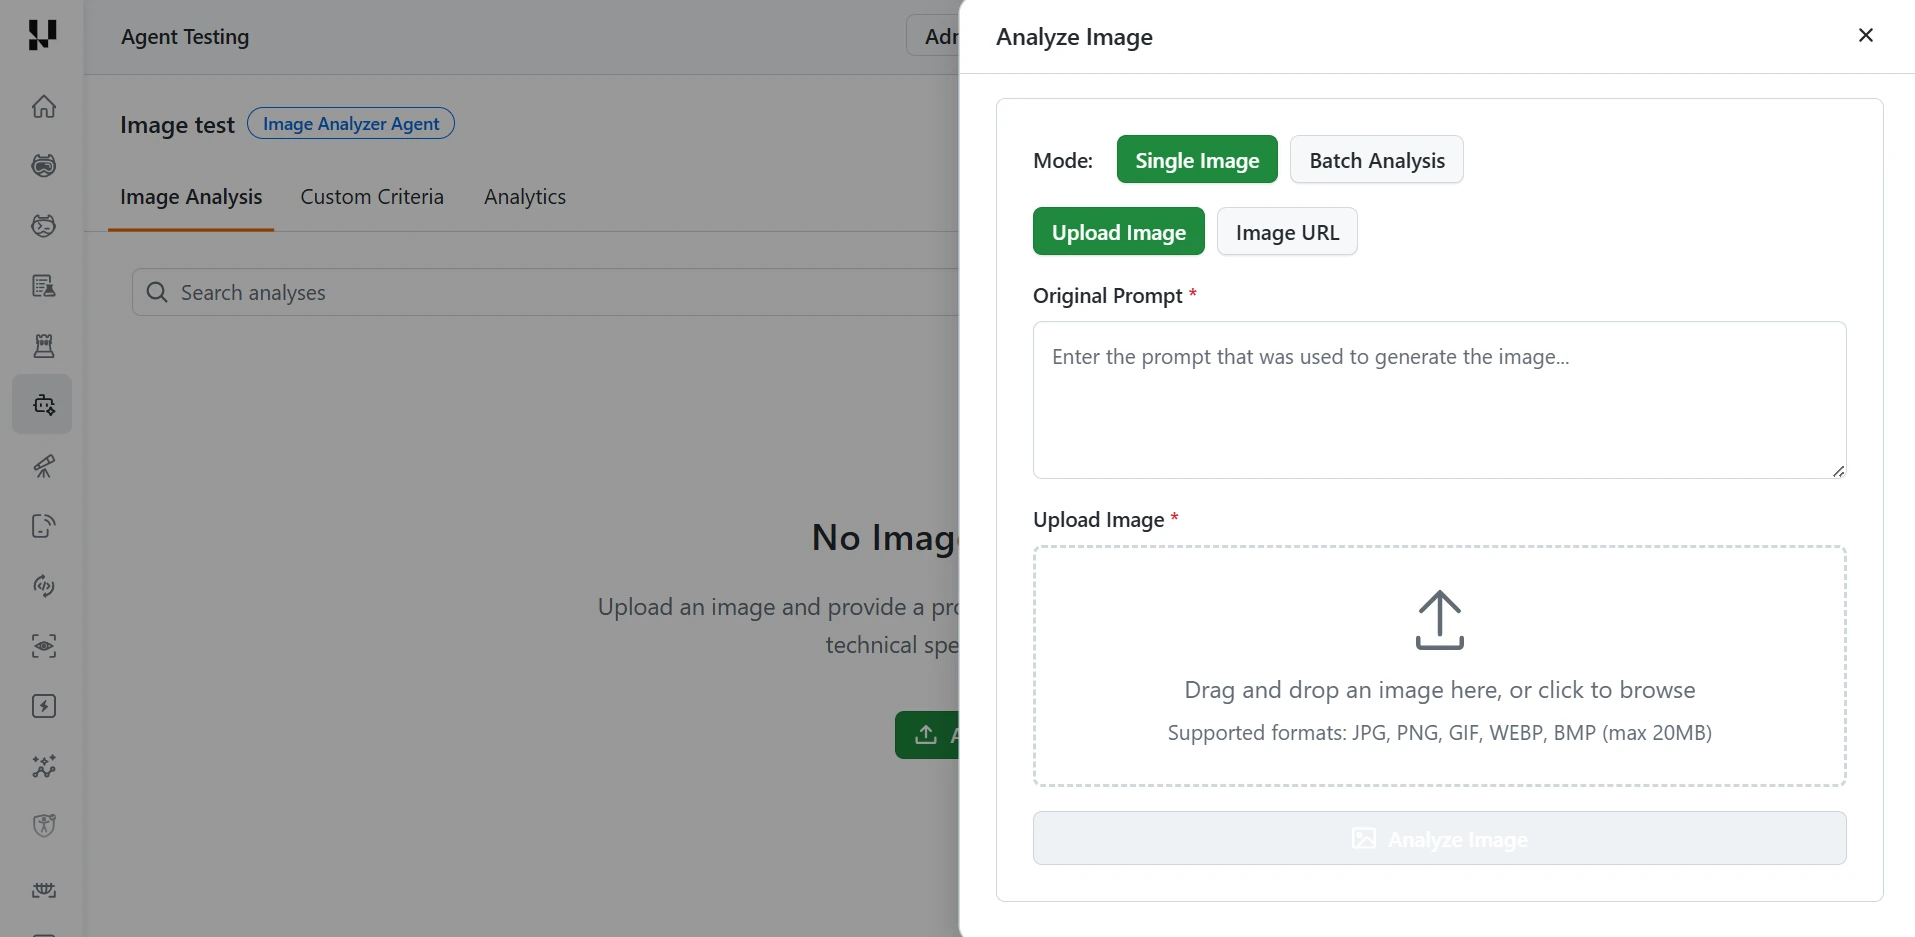
Step 3: Analyze an image. On the Image Analysis tab, click Analyze Image, then:
- Choose Single Image, or Batch Analysis to score up to 50 images in one run, for example after a model update.
- Add the image by Upload Image or Image URL.
- In Original Prompt, paste the exact prompt that generated the image. The Quality Score measures how well the image matches this prompt, so a paraphrased or shortened prompt changes what gets scored.
- Click Analyze Image. The button is available once both the prompt and the image are added.
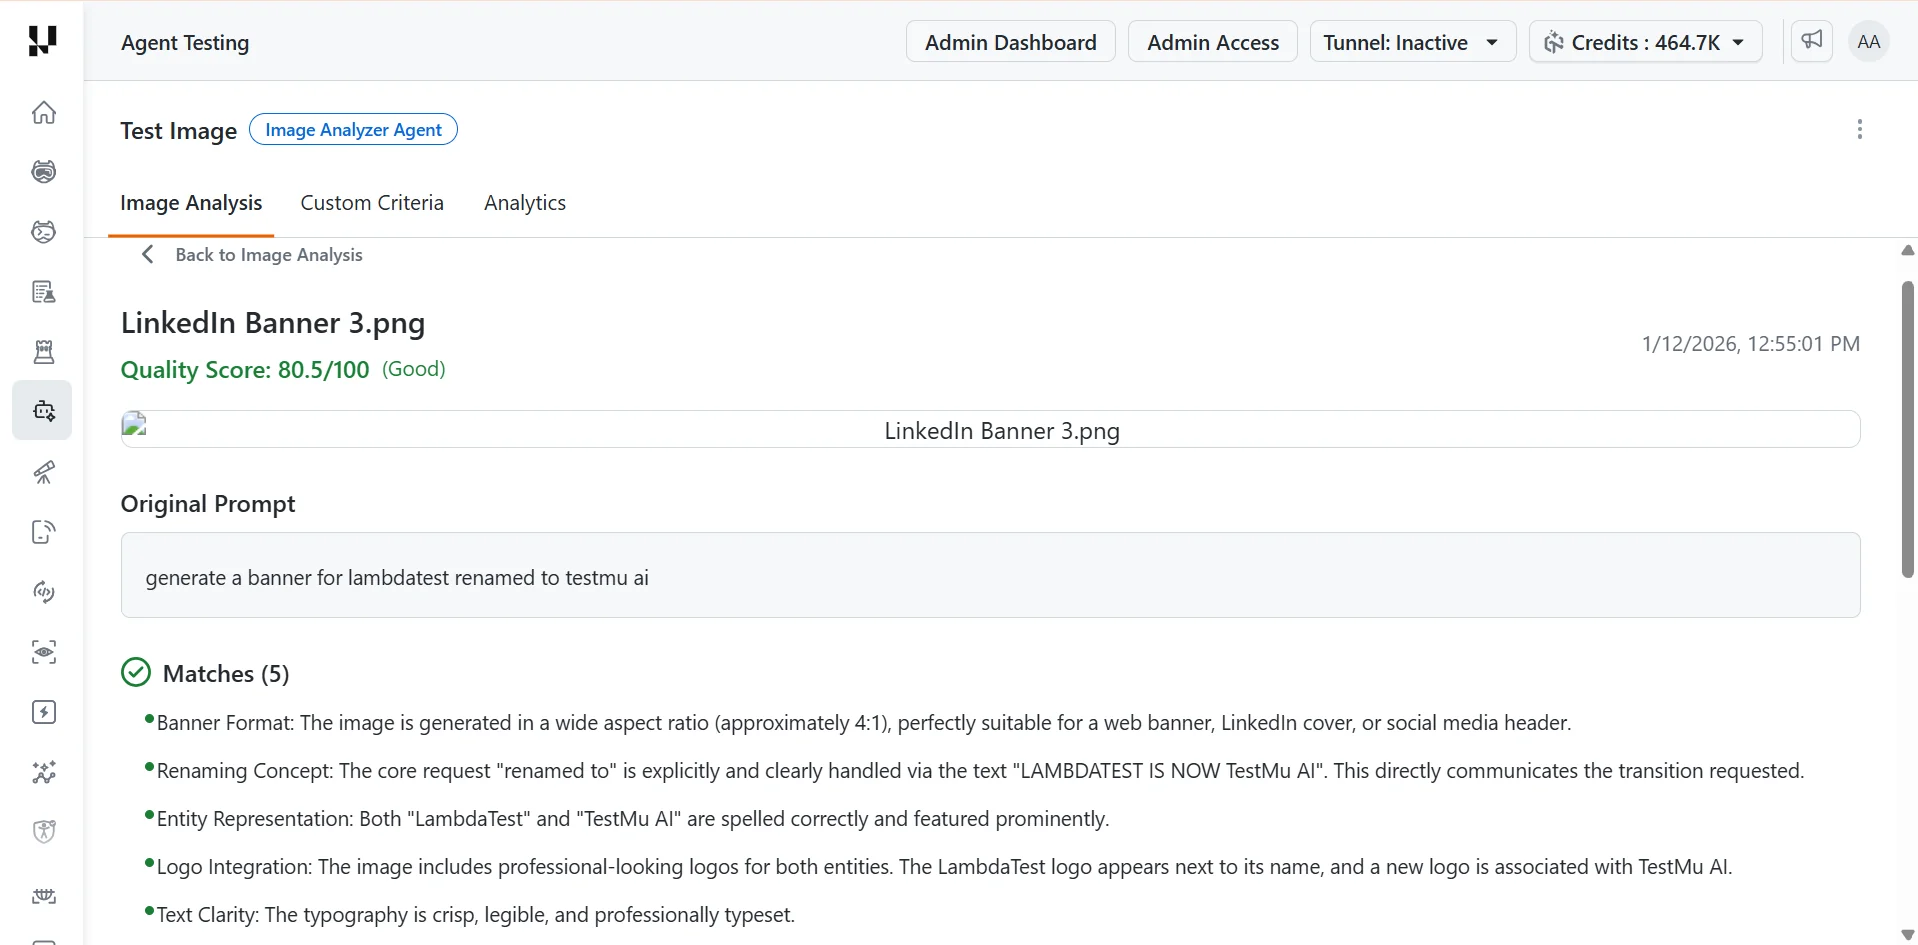
Step 4: Read the analysis. Open an analysis from the Image Analysis tab to see its Quality Score and the reasons behind it.
- Use the score band to decide whether the image is usable: 90 to 100 is excellent, 80 to 89 good, 60 to 79 fair, and 0 to 59 poor.
- Read Discrepancies first. They list what is missing or wrong compared with the prompt, which tells you what to fix in your model or prompt. Matches confirm what the image already gets right.
- If you added custom criteria, check each one's result. A Partial result means the image meets some but not all of the rule.
- Bookmark analyses you want to compare later, such as a baseline from before a model change.
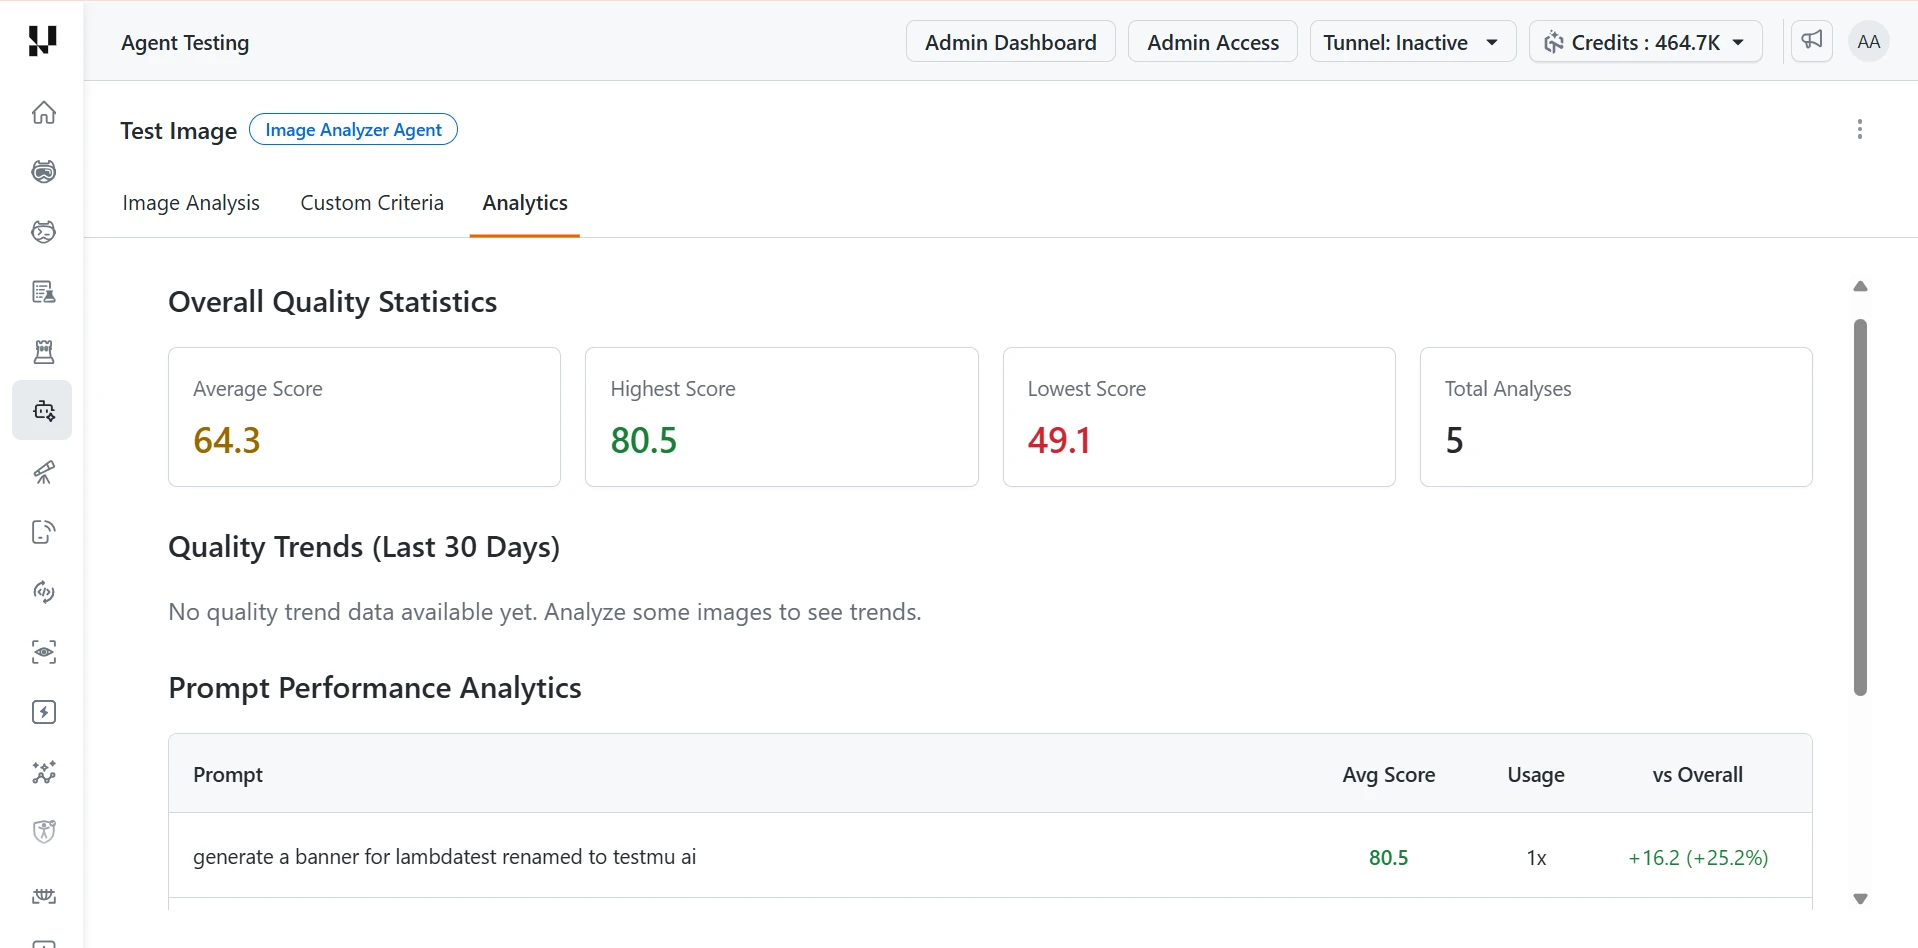
Step 5: Track quality across analyses. Open the Analytics tab once you have several analyses.
- Under Prompt Performance Analytics, the vs Overall column shows how far each prompt scores above or below your average. Start with the prompts furthest below average: they show where your model struggles most.
- After a model or prompt change, analyze the same prompts again and use the 30-day quality trend to confirm that scores went up.
Features
Image Analysis. Upload single images or batch-process up to 50 at once, by file upload, URL, or drag and drop. Supported formats are JPG, JPEG, PNG, GIF, WEBP, and BMP, with a maximum of 20 MB per image.
Custom Evaluation Criteria. Score images against your own rules, in three types, each toggleable active or inactive:
- Brand guidelines: allowed and prohibited colors, required fonts, and logo requirements.
- Technical specifications: dimensions (width by height), aspect ratio, allowed formats, maximum file size, and minimum resolution.
- Custom rules: freeform rule text and checklist items.
All criteria support create, edit, delete, and search by name, description, or type.
Analysis History. Search past analyses by image name or prompt, track status (Pending, Completed, Failed), open any analysis for full results, and bookmark important ones.
Analytics Dashboard. View overall statistics (average, highest, and lowest score, and total count), a 30-day quality trend with a daily bar chart, and the top 20 prompts ranked by average score.
Metrics
Each image is scored on a single Quality Score from 0 to 100, plus a set of qualitative outputs.
| Metric | Scale | What it measures |
|---|---|---|
| Quality Score | 0 to 100 | Overall image quality and prompt adherence |
| Matches | List | Elements that correctly match the original prompt |
| Discrepancies | List | Missing or incorrect elements versus the prompt |
| Overall Assessment | Text | Summary of how well the image matches the prompt |
| Detailed Observations | Text | In-depth analysis of specific image aspects |
Quality Score bands: 90 to 100 excellent, 80 to 89 good, 60 to 79 fair, and 0 to 59 poor. For each active custom criterion, results show a Pass, Fail, or Partial status with compliance details.
Related TestMu AI Guides
- See how the platform runs an evaluation end to end.
 Chat with Us