Getting Started With LT Browser 2.0
Note: This product is deprecated and as a result, no further support will be provided for this feature by the TestMu AI Organization.
LT Browser 2.0 is a Chromium-based mobile-friendly browser that enables web developers to build, test and debug their mobile websites for responsiveness across a wide range of 50+ pre-installed device viewports, including mobile, tablet, desktop and laptop.
The new LT Browser 2.0 boasts enhanced performance and several features that make it easier for you to create responsive websites for device viewports of all sizes.
The following new features are available in LT Browser 2.0:
- Based on latest version of Chromium.
- More clear and attractive UI.
- Interact and test with 6 devices simultaneously.
- Dedicated DevTools for different viewports.
- Test with unlimited custom device viewports.
- Generate and share multiple error reports.
- Use Chromium settings.
- Install Chrome extensions.
- Unlimited browser tabs to launch device viewports.
- Record with entire screen or browser tab.
To get started with LT Browser 2.0, download the below executable file based on your operating system.
Running Your First Responsive Test
- Open the LT Browser 2.0 and select your preferred device from the left device panel. By default, LT Browser 2.0 opens up with two viewports.
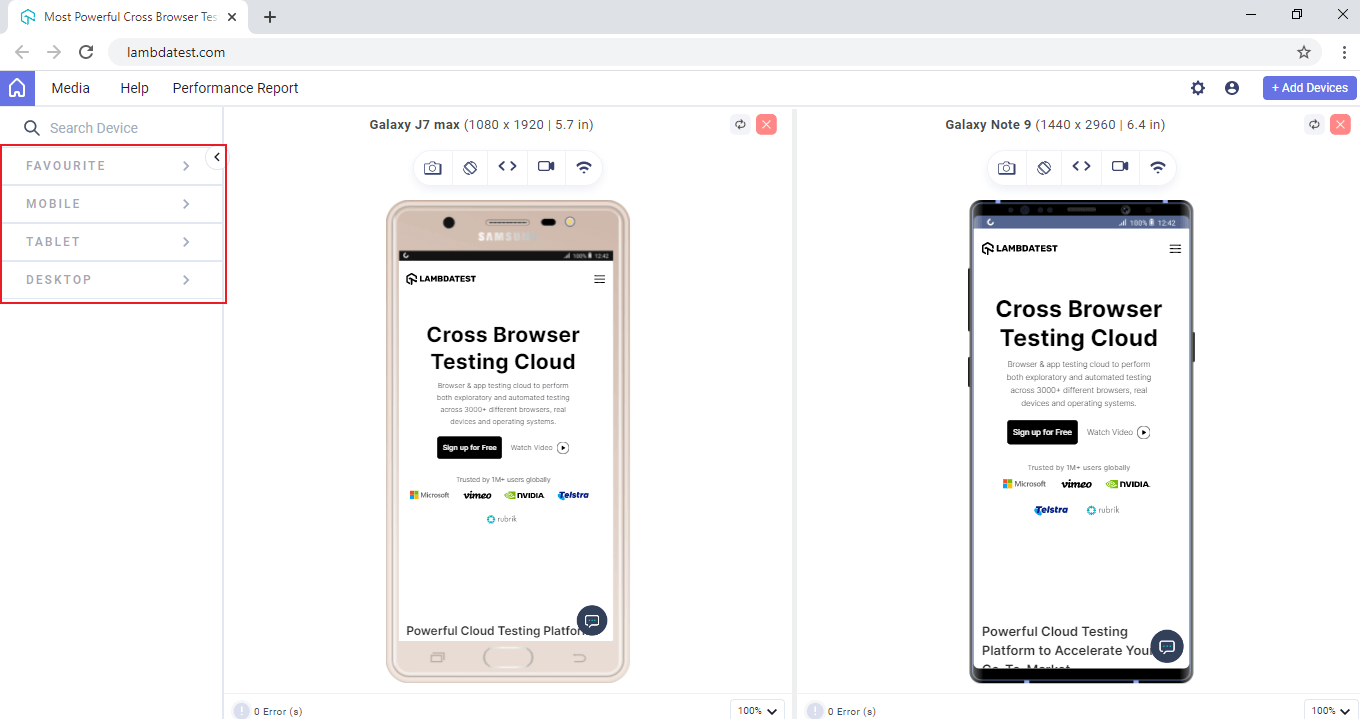
- Provide the testing URL in the address bar, and then press Enter.
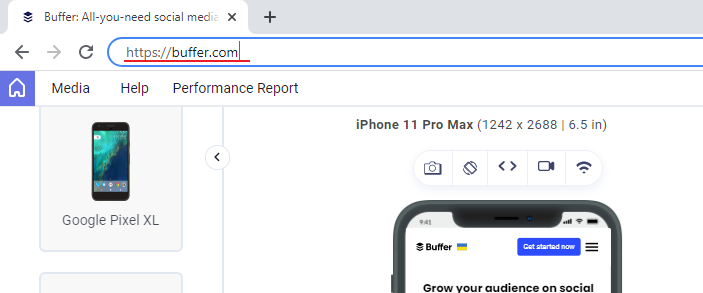
- It will launch the website on the selected device viewport.
Adding More Devices
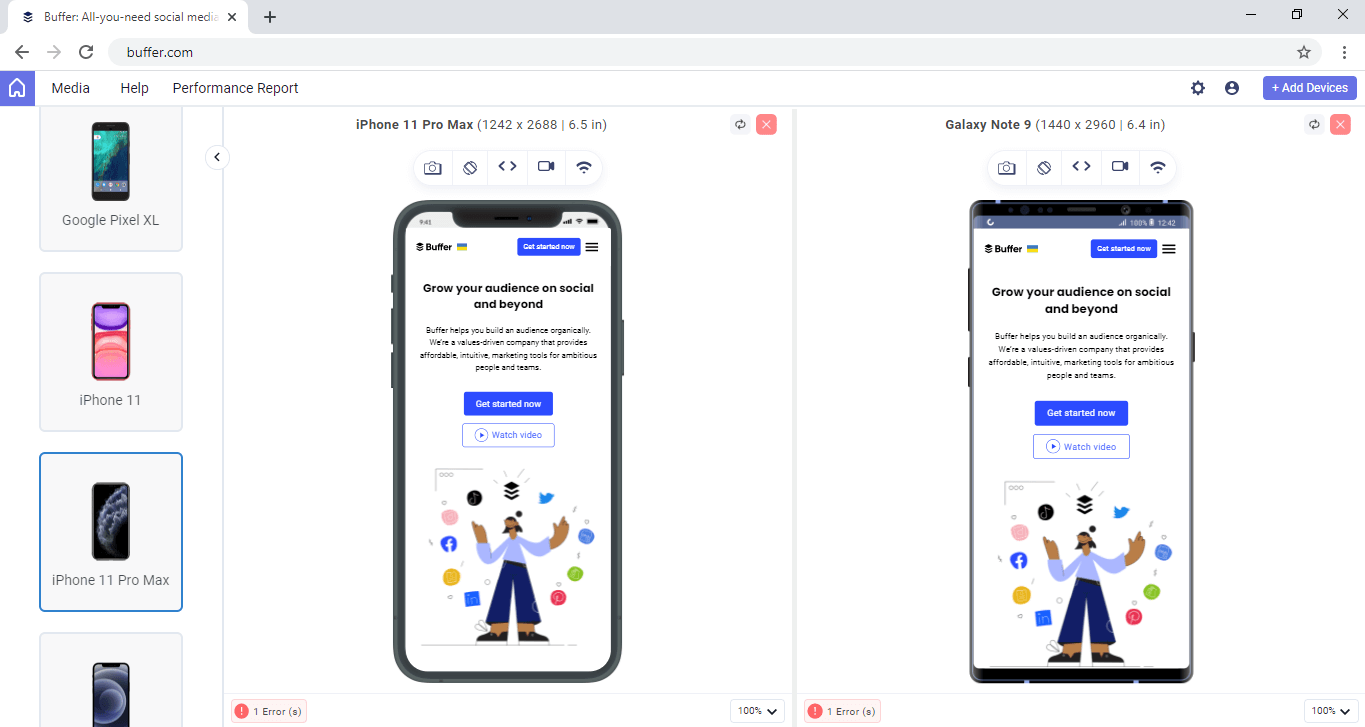
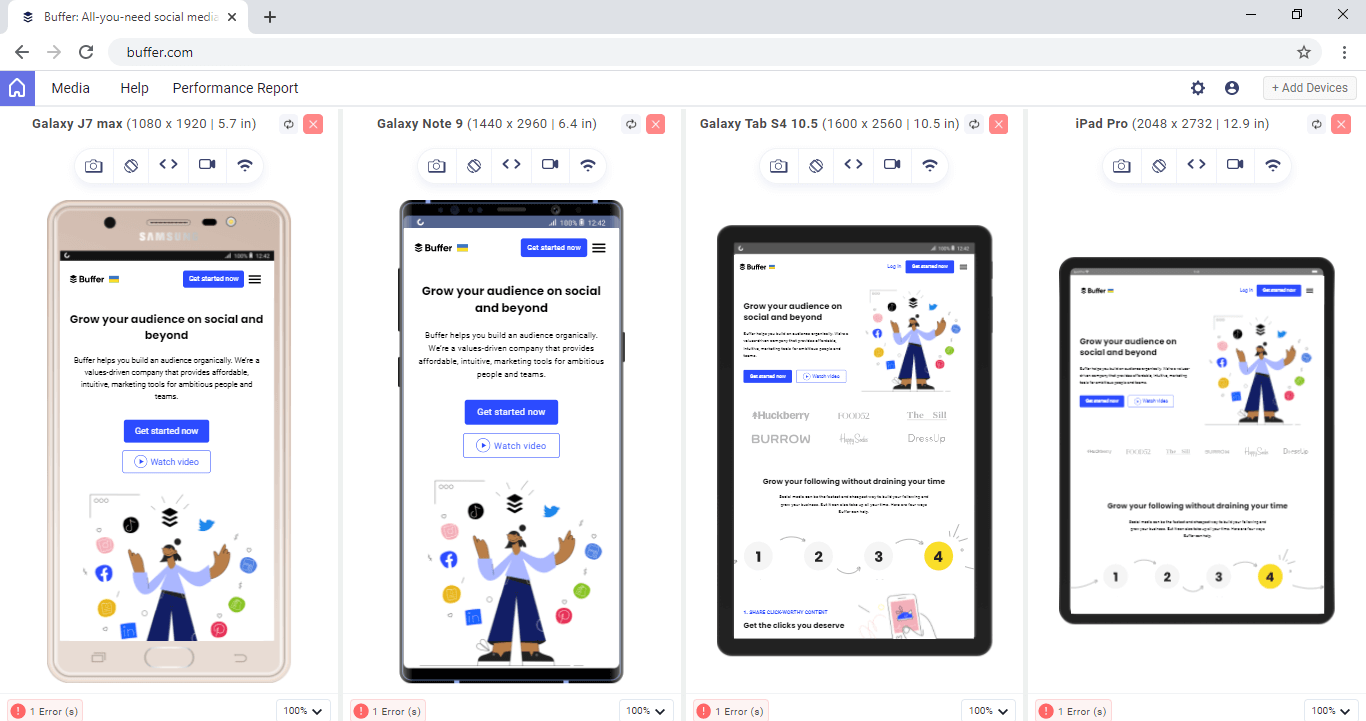
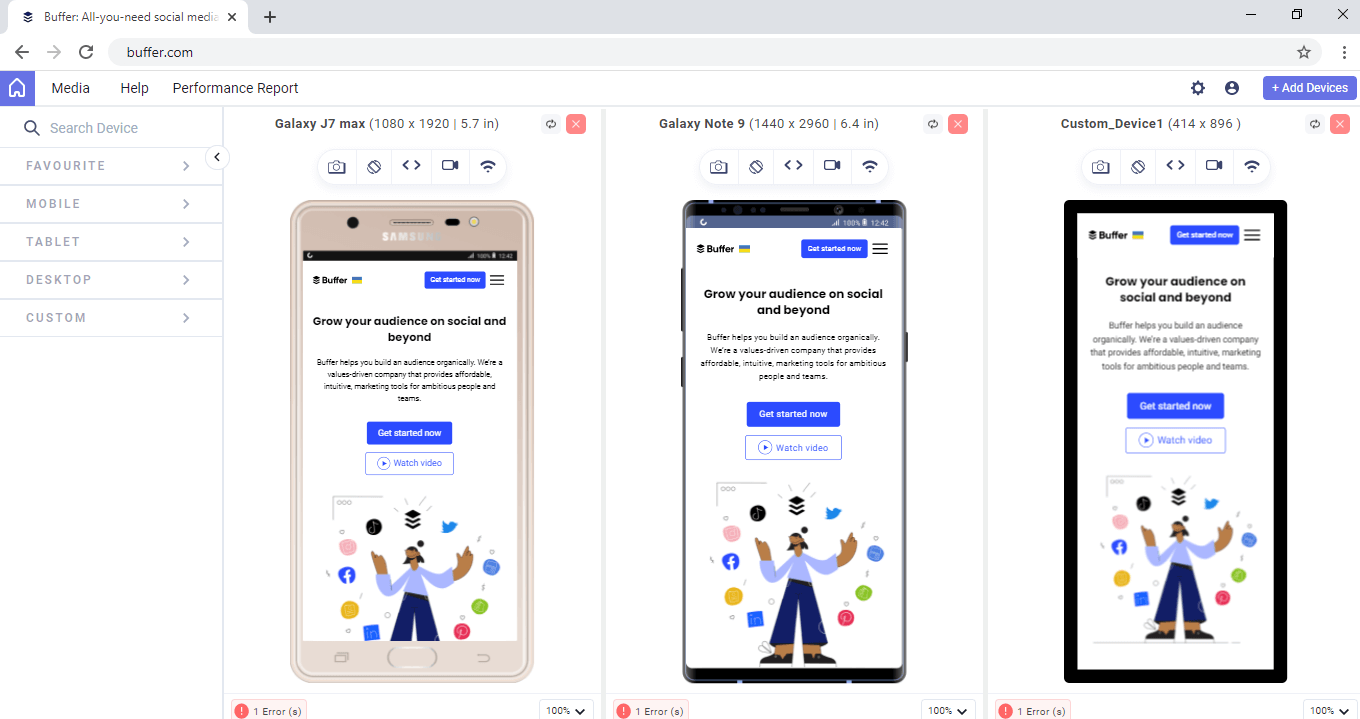
You can monitor different devices side by side by adding a device on the view screen. With LT Browser 2.0, you can interact with 6 device viewports at a time.
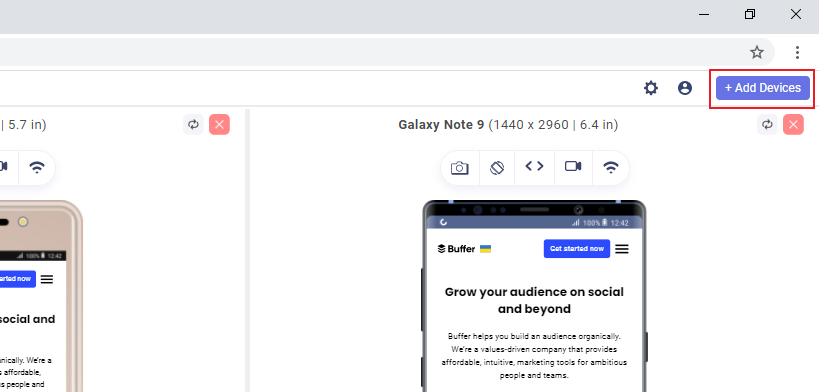
- To add more viewports, click + Add Devices.
- From the pop-up box, select your desired viewport that you want to test side-by-side and Click ADD DEVICES
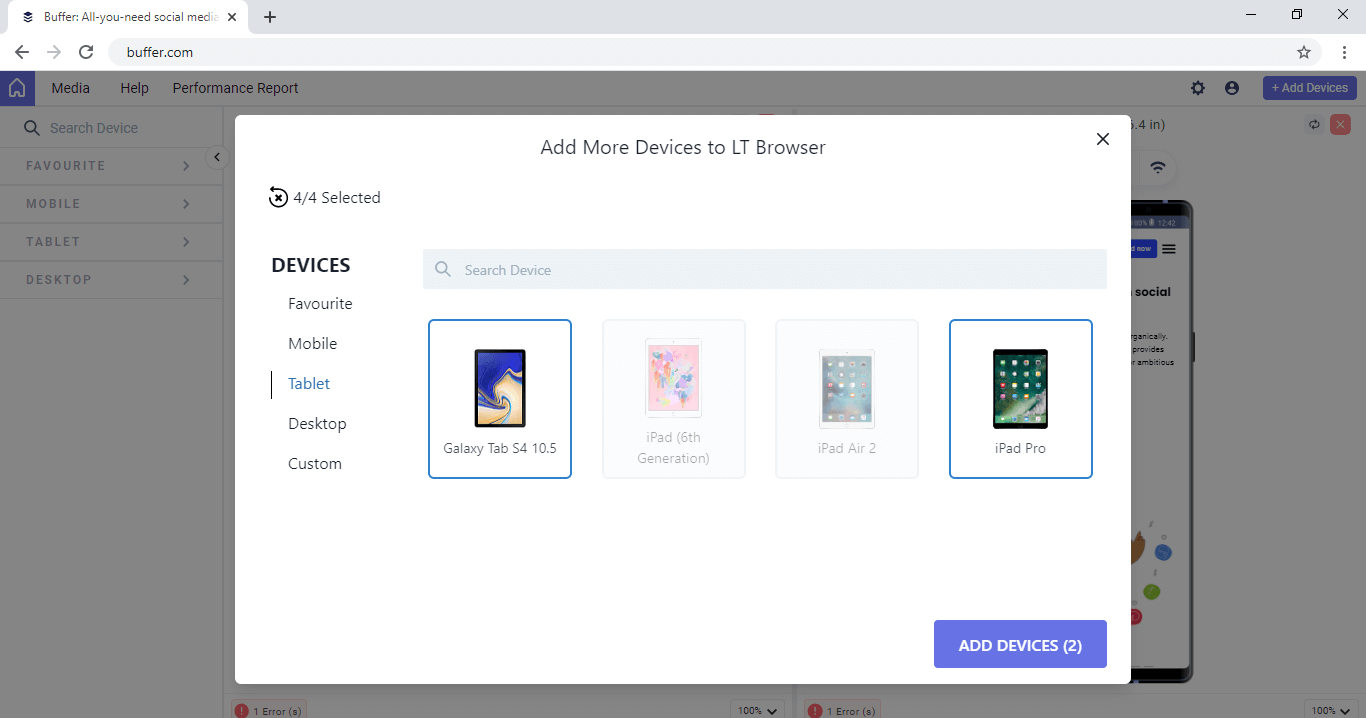
You can now find a new device viewport on the view screen. This will allow you to test responsive web design on four different viewport sizes.
Rotating Device
You can rotate devices from Portrait To Landscape view or vice versa. To rotate device, click on the rotate icon.
Adding A Custom Device
If a device does not match the viewport or device pixel ratio of your requirement, you can add a custom device viewport. With LT Browser 2.0, you can add unlimited custom viewports.
- To add custom viewport, click + Add Devices .
- Select the Custom tab and click + New Device.
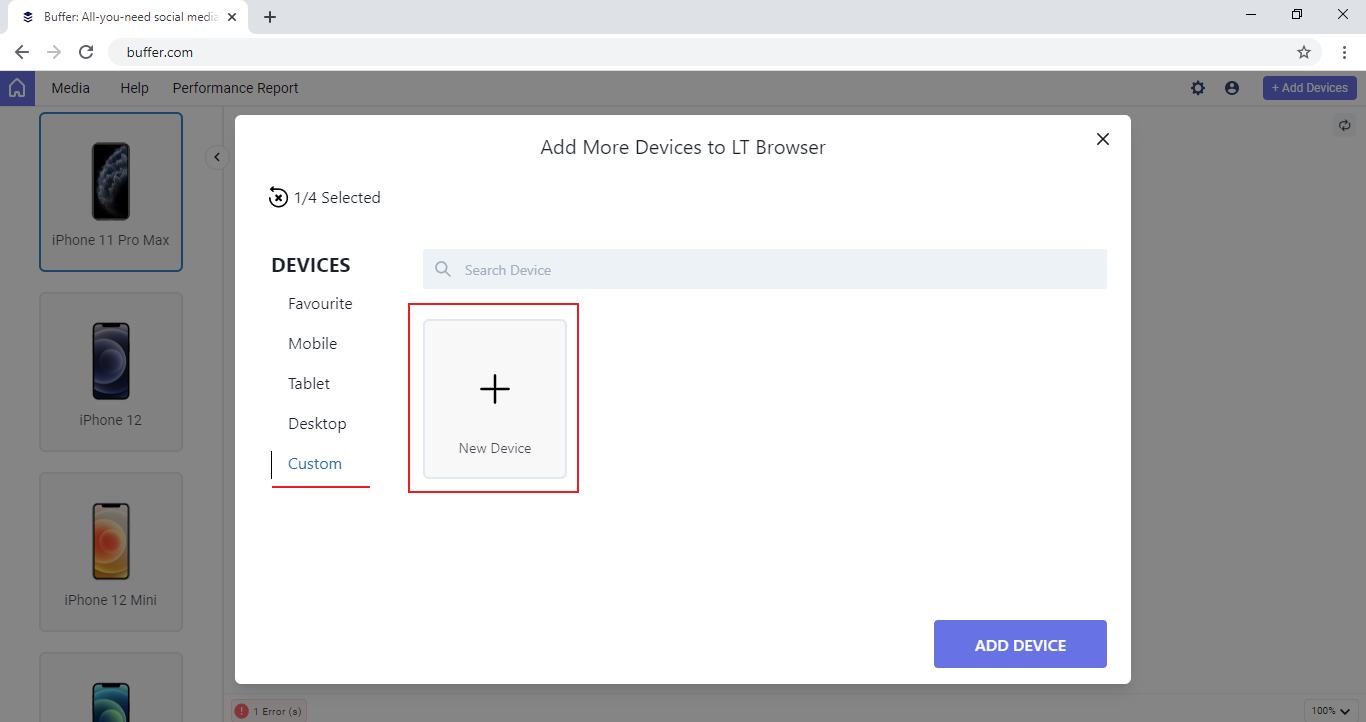
- A pop-up box will appear where you need to specify the following viewport details.
- Device Name
- View Port Specifications (Width and Height)
- Device Pixel Ratio
- User Agent String
- Device Platform
After entering the viewport details, click ADD DEVICE
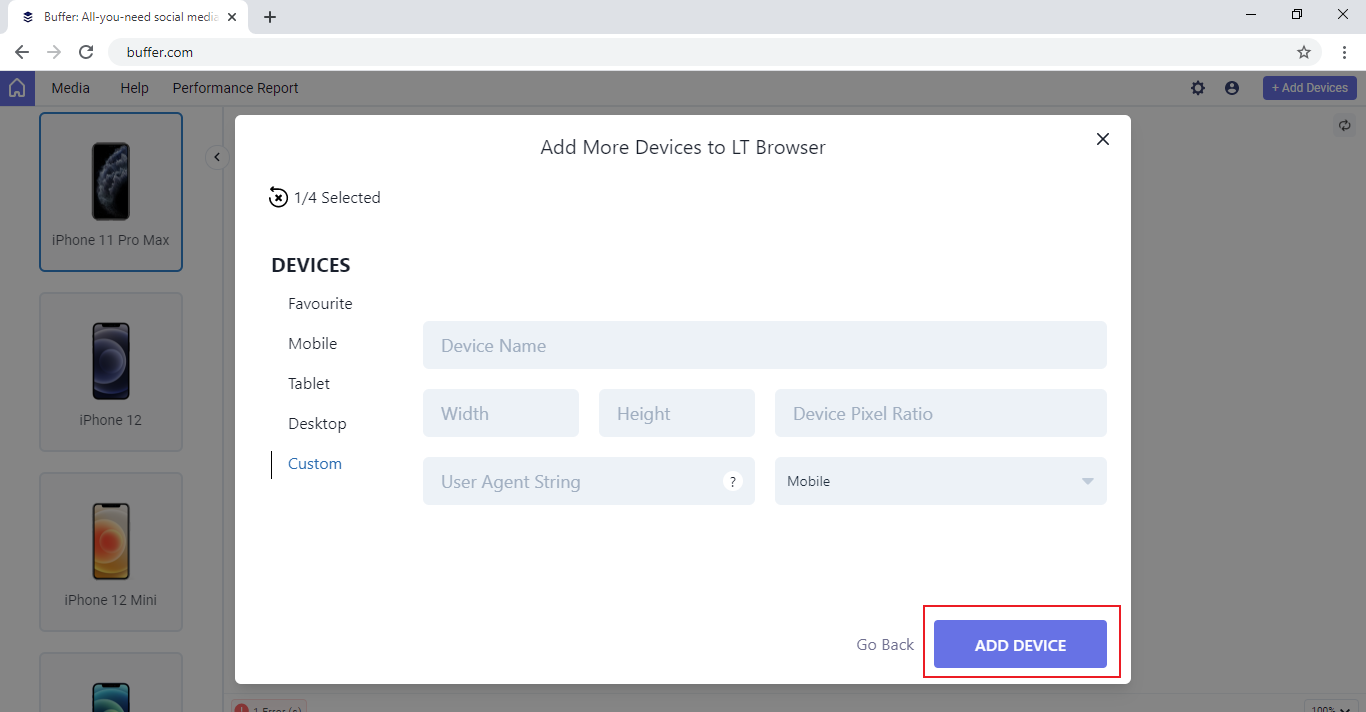
It will add your custom device based on the provided viewport details.
Searching For A Specific Device
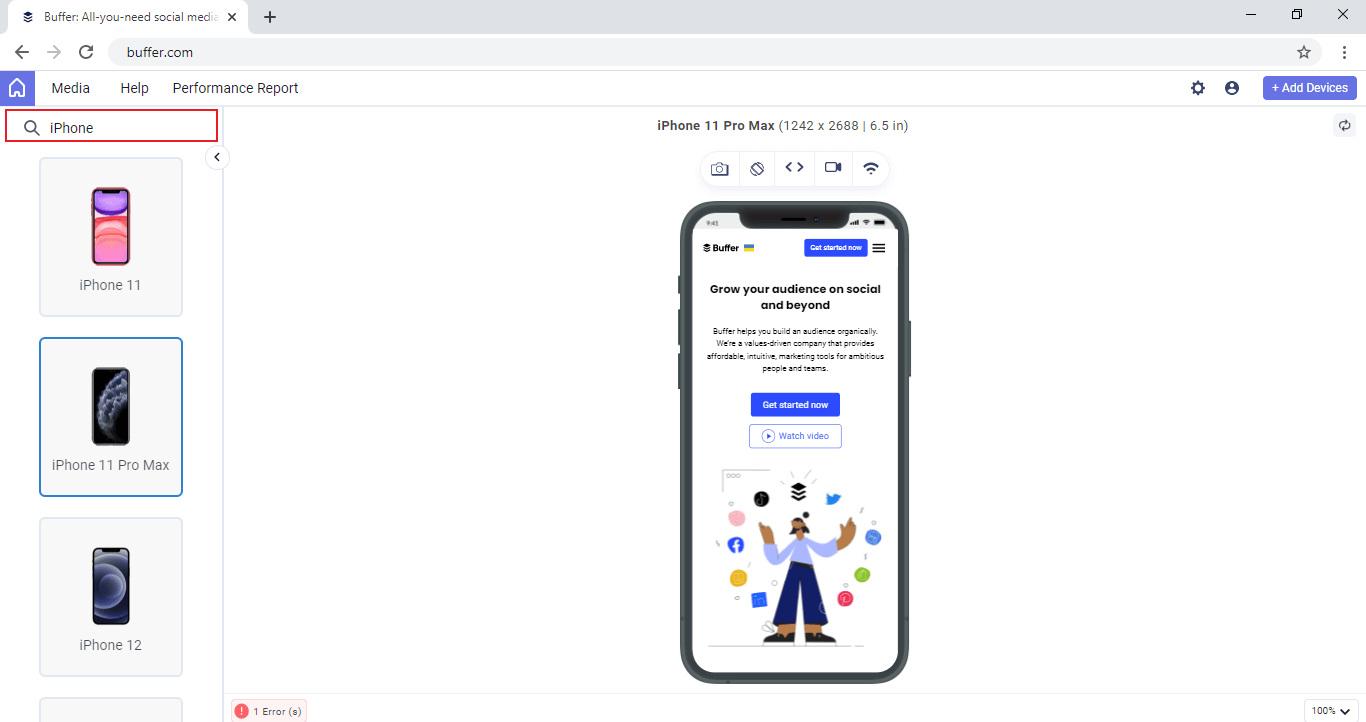
LT Browser 2.0 includes a search bar at the top-left of the screen to enable you to instantly locate any device from the device panel. Enter the brand of the device, select a device from the list and it will appear instantly on-screen.
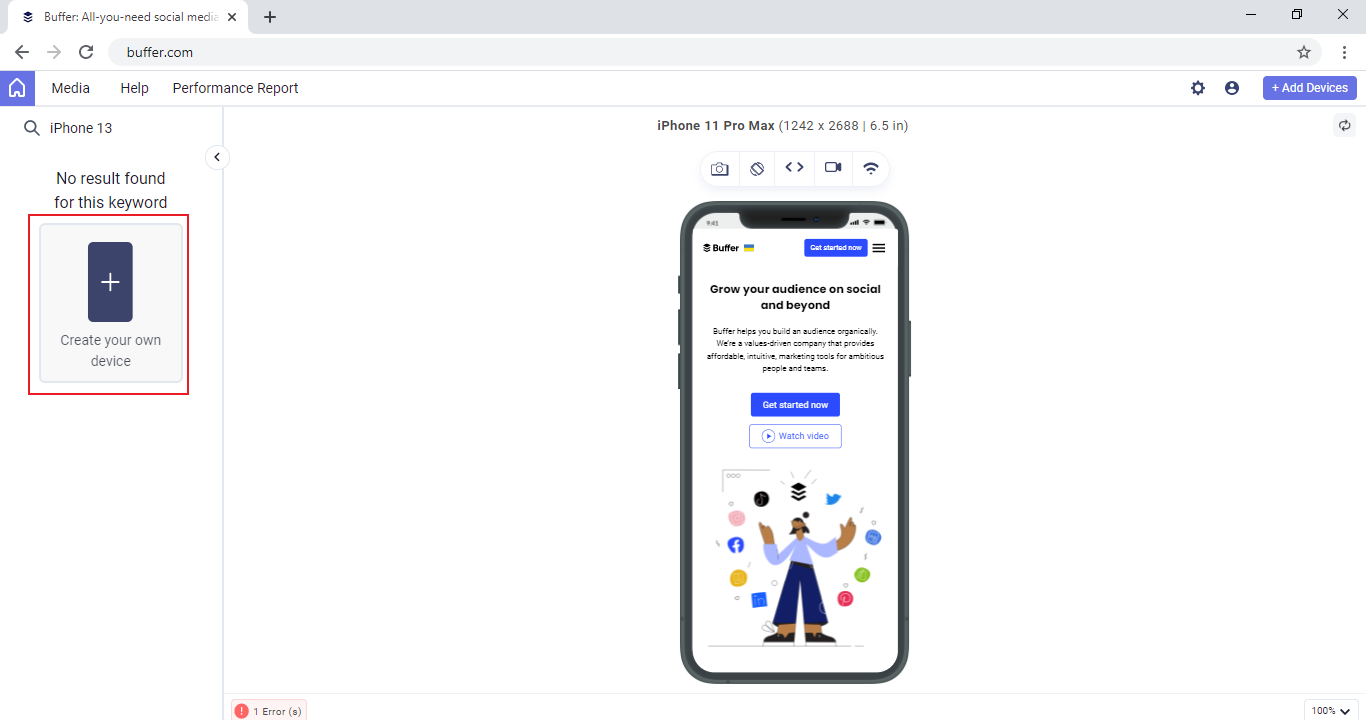
If you search for a device viewport which is not yet listed in the LT Browser 2.0 device panel, you will see Create your own device option that allows you to add your own custom device.
Generating Performance Report
With LT Browser 2.0, you can view the performance report of your page instantly powered by Google Lighthouse. The Performance Report allows you to get a holistic view of your website or web app and gain actionable insights to improve your mobile web experience.
With Performance Report you can view:
-
Desktop and Mobile Score
-
Performance Metrics
-
Runtime Settings
-
To generate a performance report, enter the desired URL in the address bar and press Enter.
-
Click on Performance tab in the header.
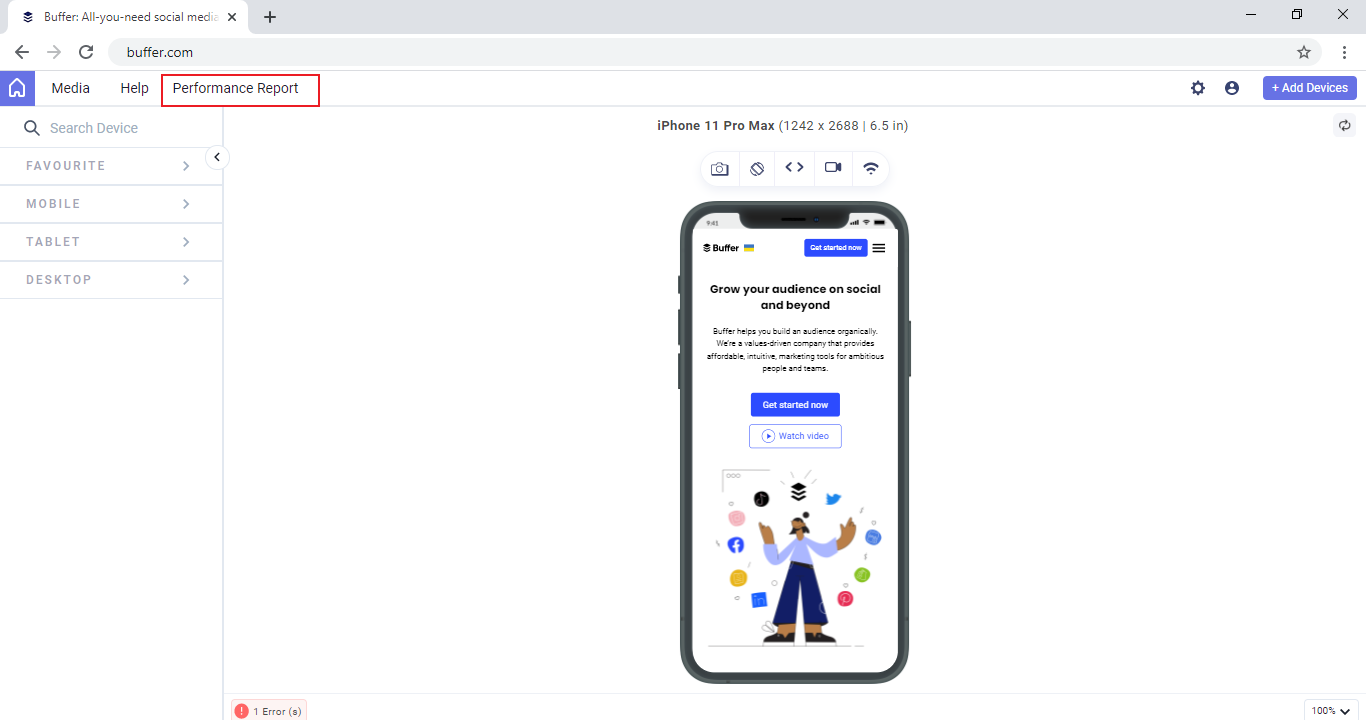
It will take a few seconds for the Performance Report to generate.
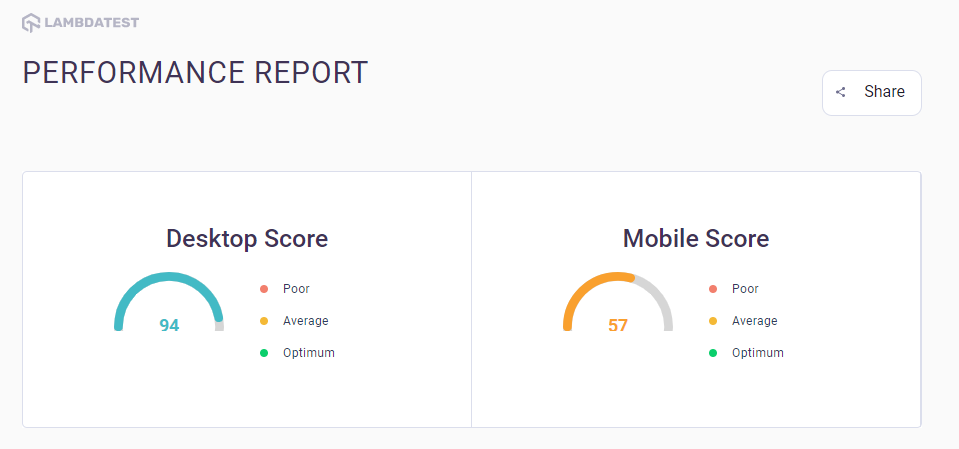
Desktop and Mobile Score
The Desktop and Mobile Score contains the universal score of the desktop and mobile scores. The score has three fields - Poor, Average, and Optimum.
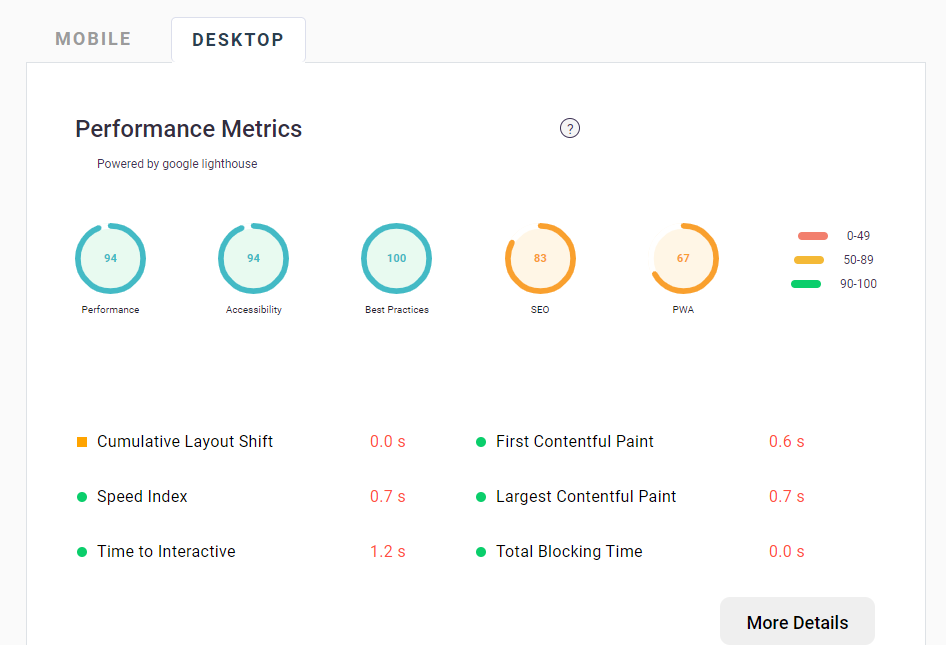
Performance Metrics
You can view Desktop and Mobile Score based on different parameters like Accessibility, Best Practices, SEO, and Progressive Web App (PWA). The Opportunities and Diagnostics section help you with guidelines to load your page faster.
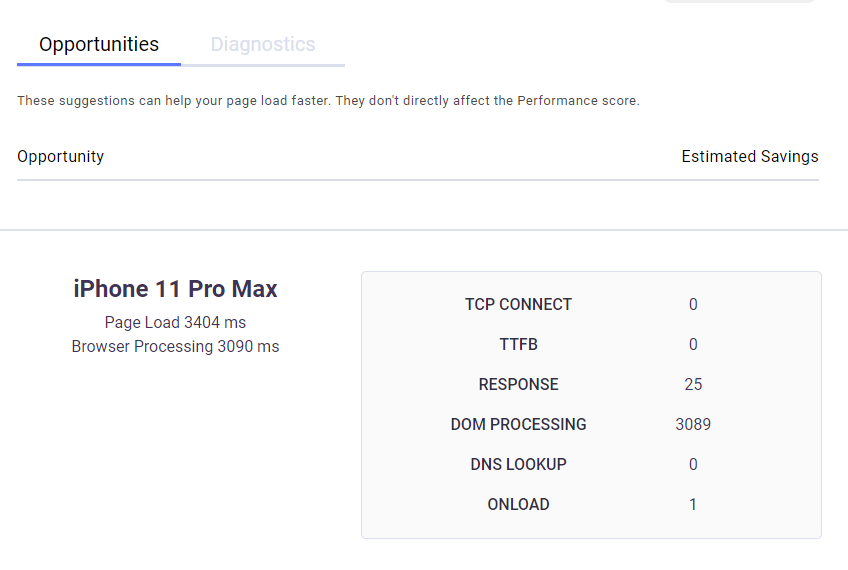
Towards the bottom, you can find the device resolution used to generate performance report along with the loading time. Also, view the DOM and Browser processing duration of your web page. These timestamps will change as per your choice of network simulation.
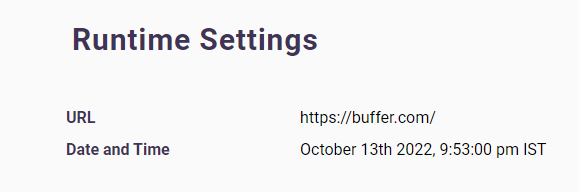
Runtime Settings
In Runtime Settings, you'll find the URL of the entered website, time, and date.
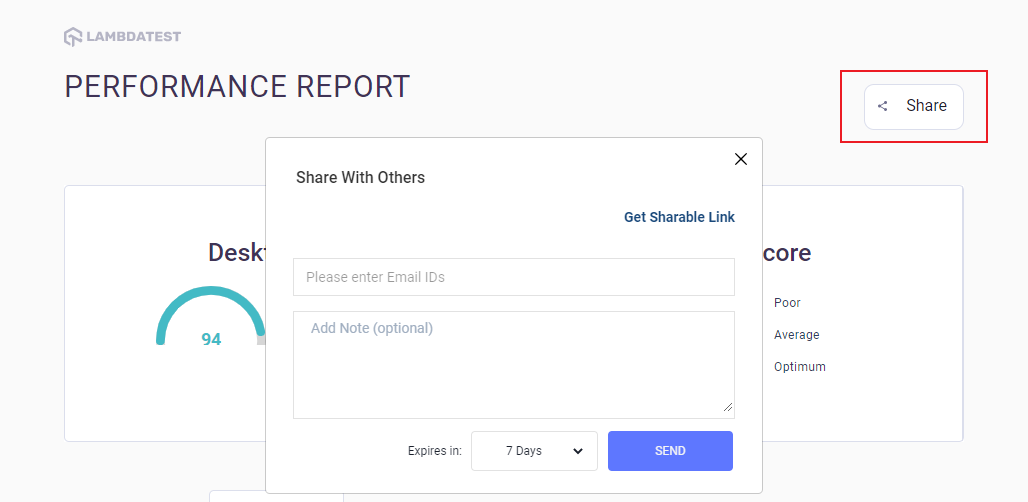
You can also share your performance report with your team members via e-mail or a shareable link. To share you report, click the Share icon.
Network Throttling
LT Browser 2.0 allows you to test your mobile website view over different types of network connections, including fast 3G, slow 3G, online and even offline. You can change your network profile to test its functionality when exposed to different network environments.
- To test your website's performance over different network environments, click the Network Throttling icon.
- Select the network environment from the network list.
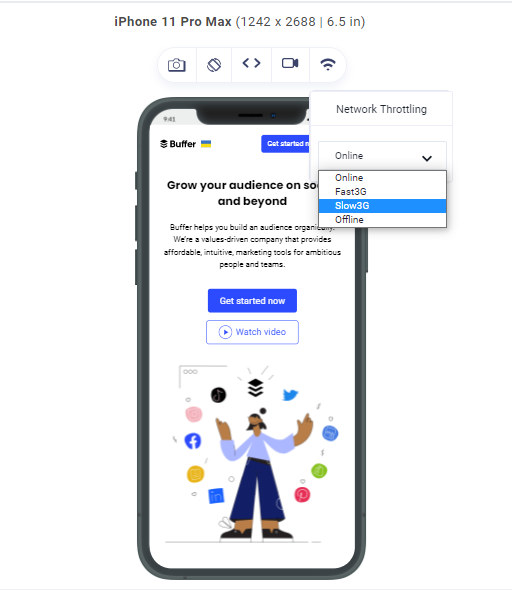
Once you are done with selecting the network, you can test your mobile view of your website over the selected network.
Sync Devices
Sync Devices synchronize your scrolls across multiple devices. It lets you scroll through different devices so that scrolling on one device will scroll the same amount on another device. Using Sync Devices, you can compare your website side-by-side over other devices via mirrored interactions.
Using LT Browser 2.0, you can compare your website view on multiple device viewports.
Navigate to the Settings icon and click Sync Devices.
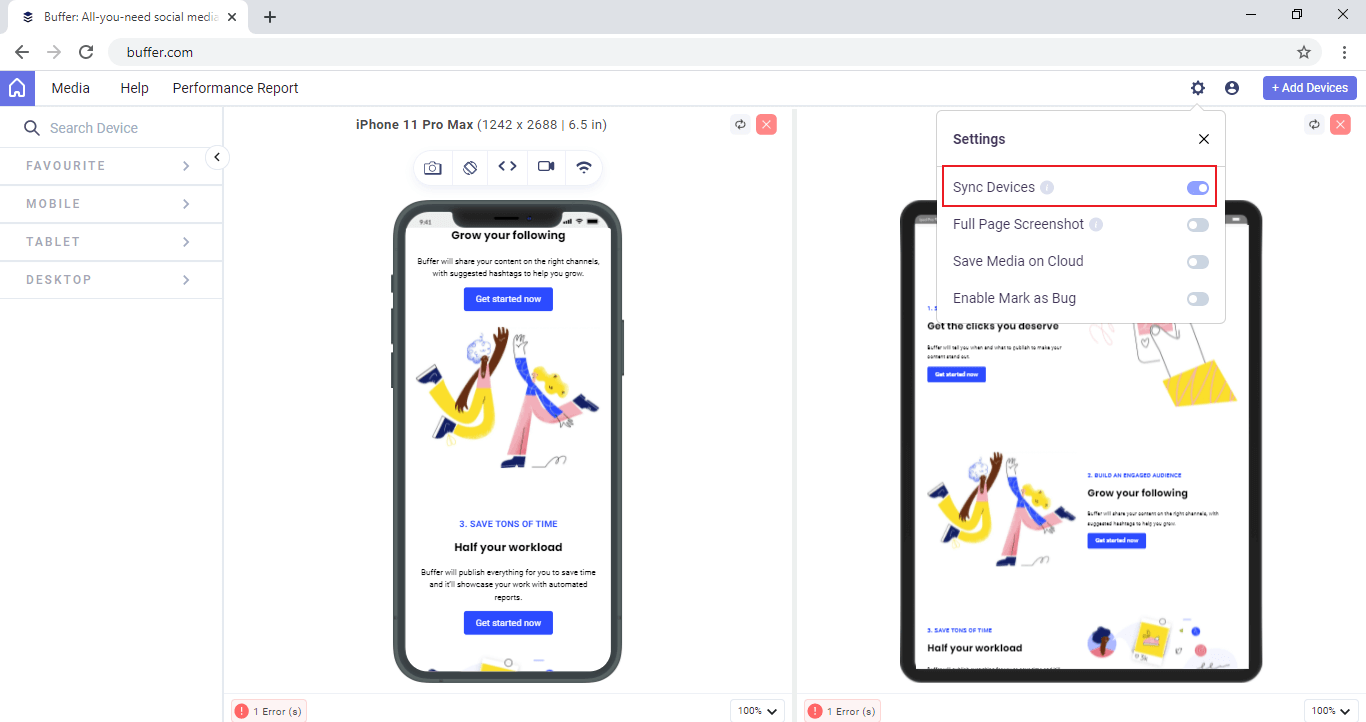
You can now compare your website view side-by-side on different viewports.
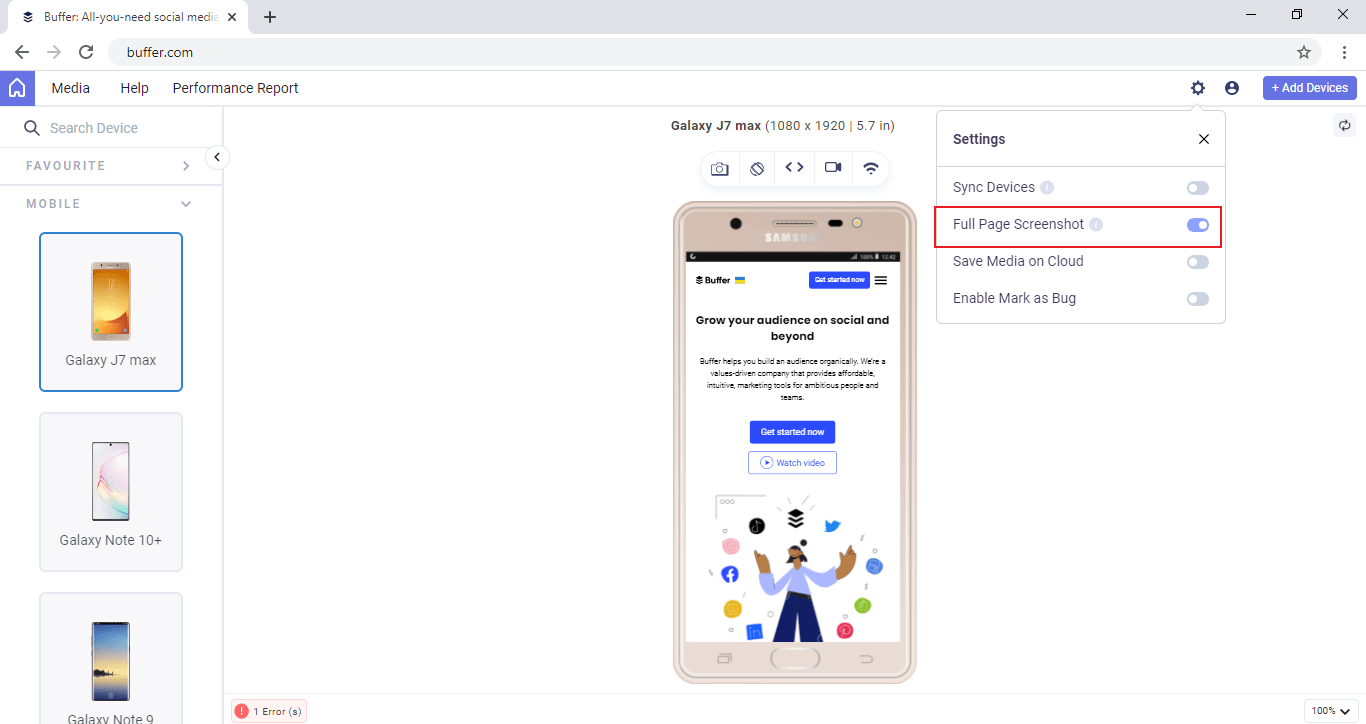
Capturing Full-Page Screenshots Of Websites
With Full Page Screenshot feature, capture full-page screenshots of your website's long content and compare it across multiple devices.
- Navigate to the Settings icon and click Full Page Screenshot.
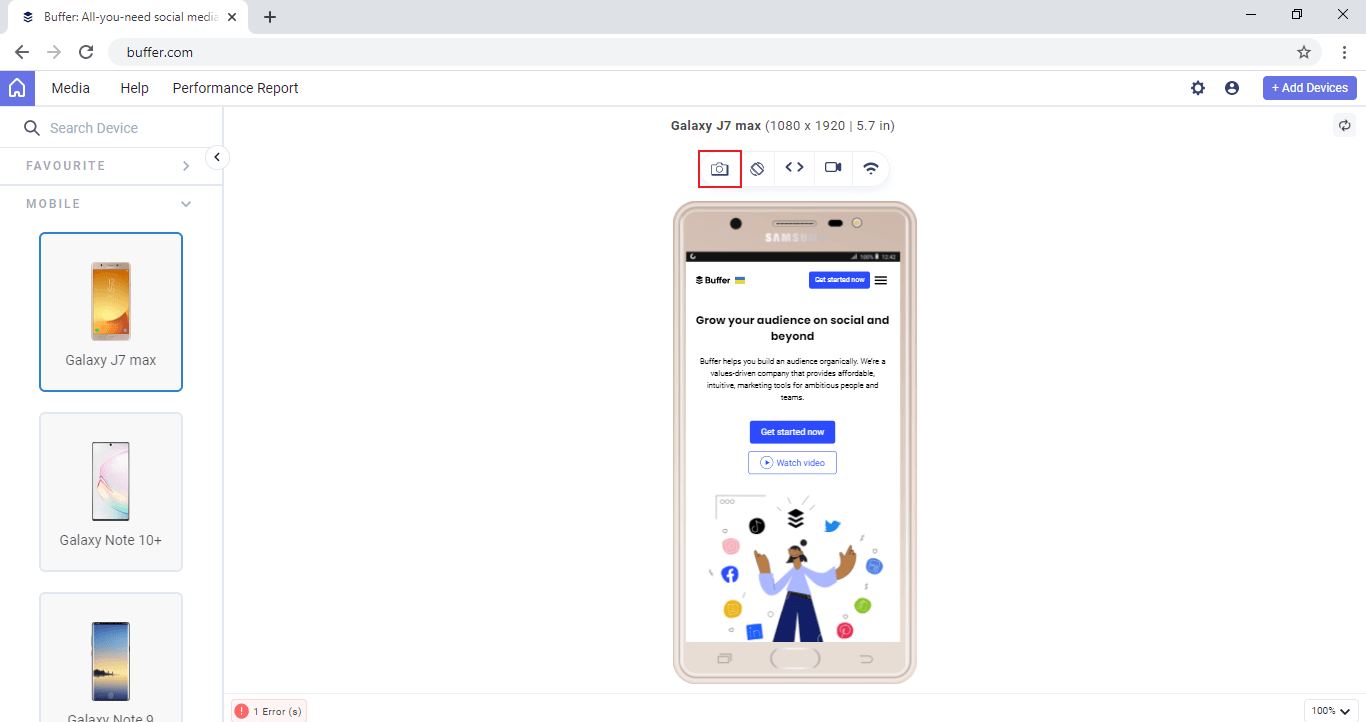
- Click on the Camera icon.
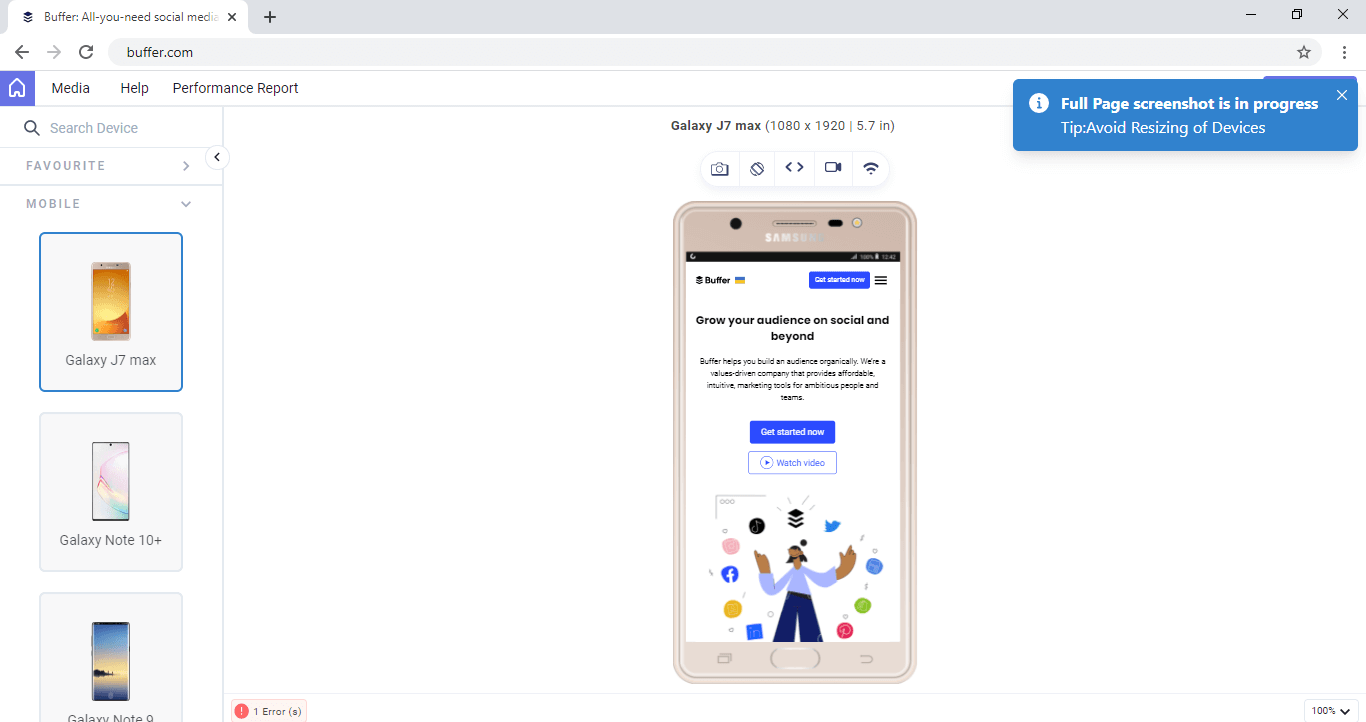
Upon clicking on the Screenshot icon, you will receive a prompt message stating Full Page screenshot is in progress.
- Once the screenshots are captured, it will guide you to the page where you can download your full-page screenshots into the LT Browser 2.0 by pressing the 'Save' button or you can download your screenshots into your local machine by clicking on the 'Arrow' button.
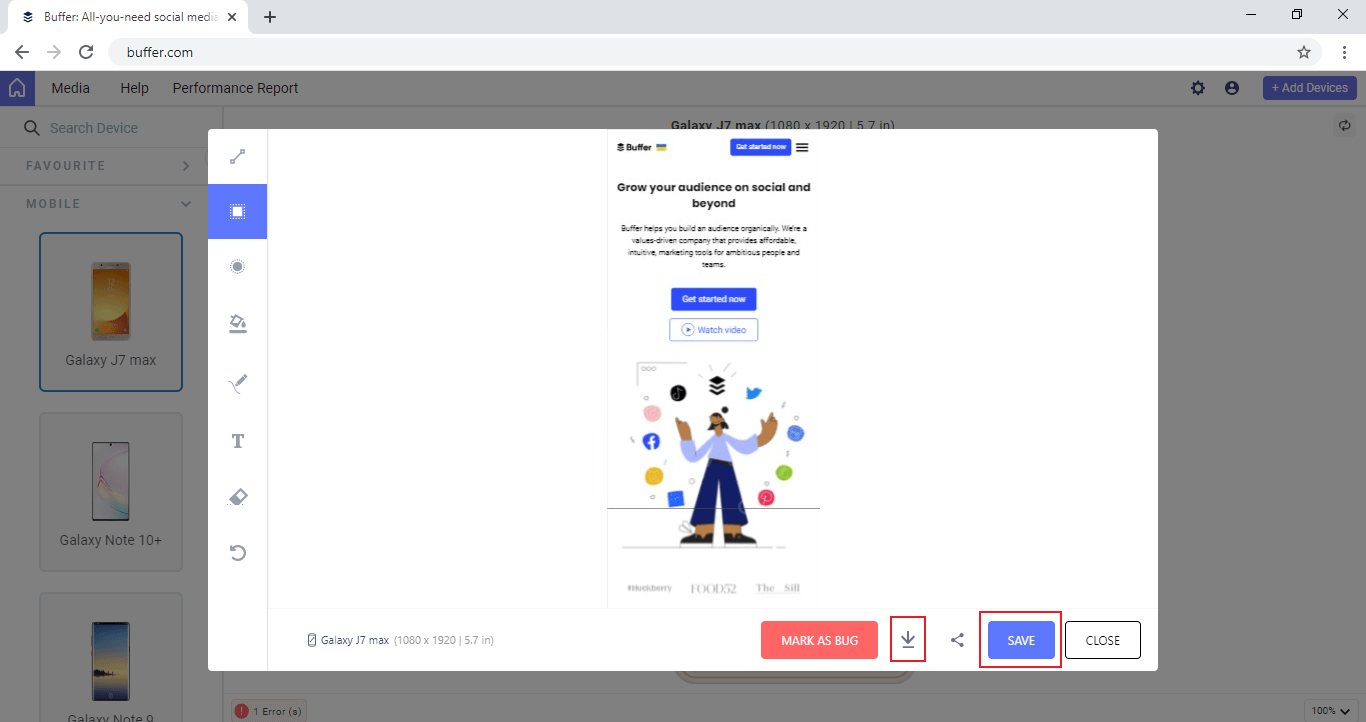
To save screenshots on local system, enable Save Media on Cloud option from the Settings icon on the top-right.
Viewing Error Reports
Error report lets you check for web-page errors, such as services that fail to load, and alerts you when the issue occurs. With LT Browser 2.0, you can view multiple errors across different device viewports.
-
To view error reports for websites, launch your website on your preferred viewports.
-
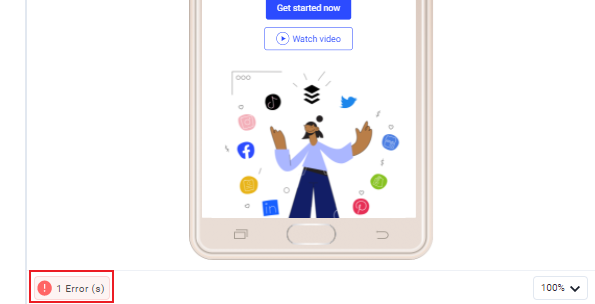
If your website has errors, you will see a red error icon below the viewport of your device. Click on the error icon to view the error reports.
LT Browser 2.0 allows you to mark errors in an error report as bugs. To do this, select the error that you want to mark and click Mark as Bug.
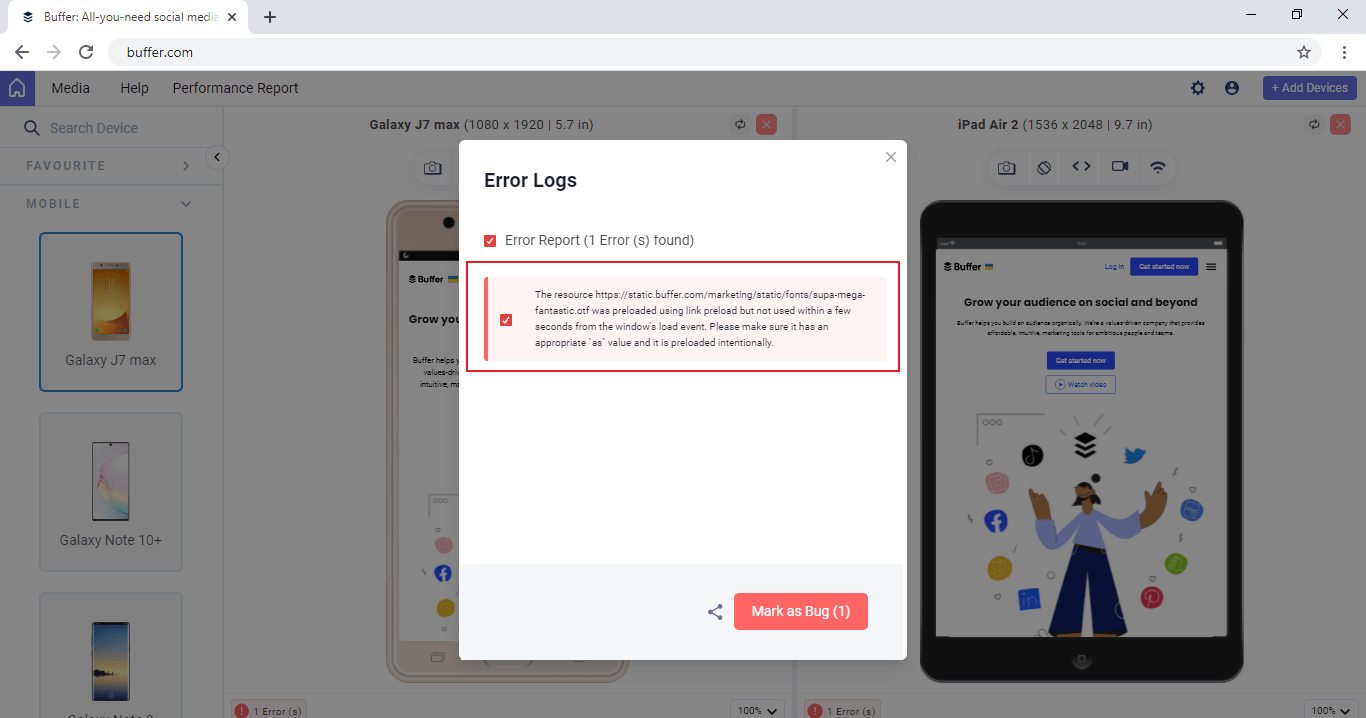
You can also share error reports with your teammates and colleagues by clicking on Share icon.
Installing Chrome Extensions
LT Browser 2.0 enables you to install your favorite Chrome extensions directly from the Chrome web store.
- Navigate to More tools > Extensions from the top-right of the LT Browser 2.0.
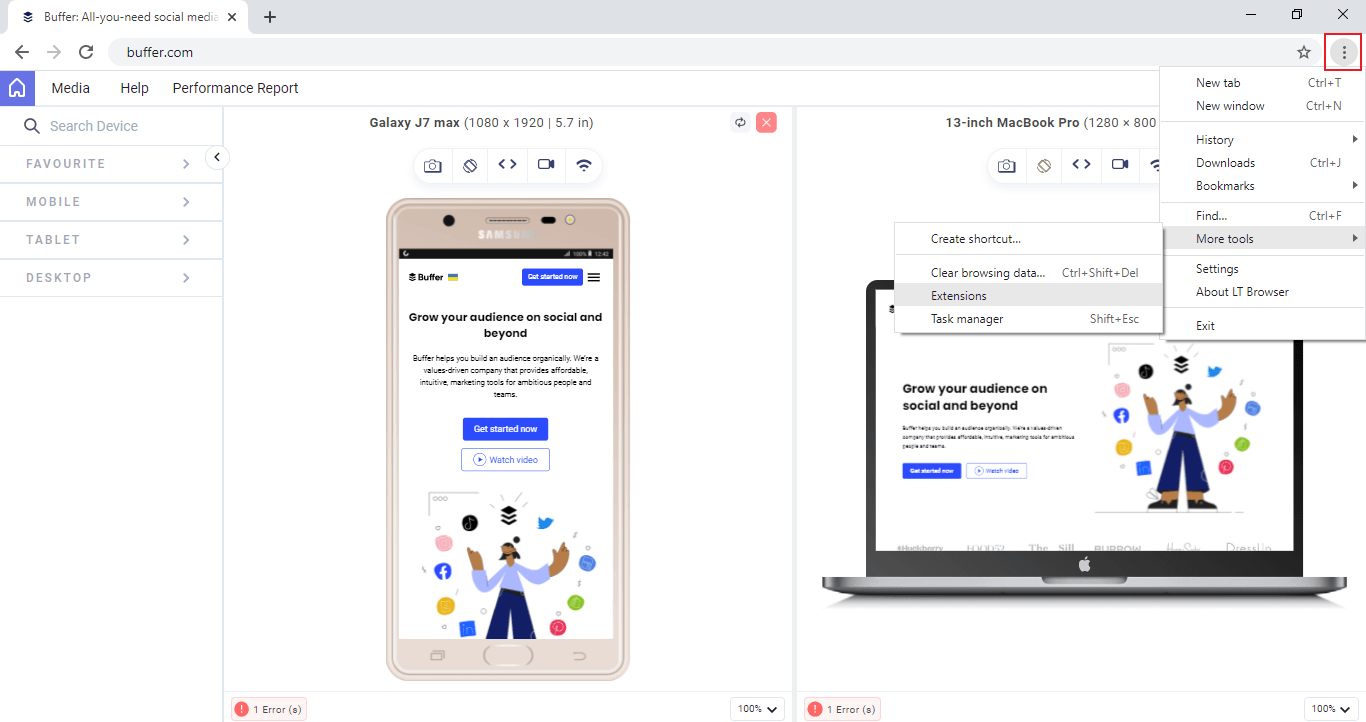
It will guide you to the below screen.
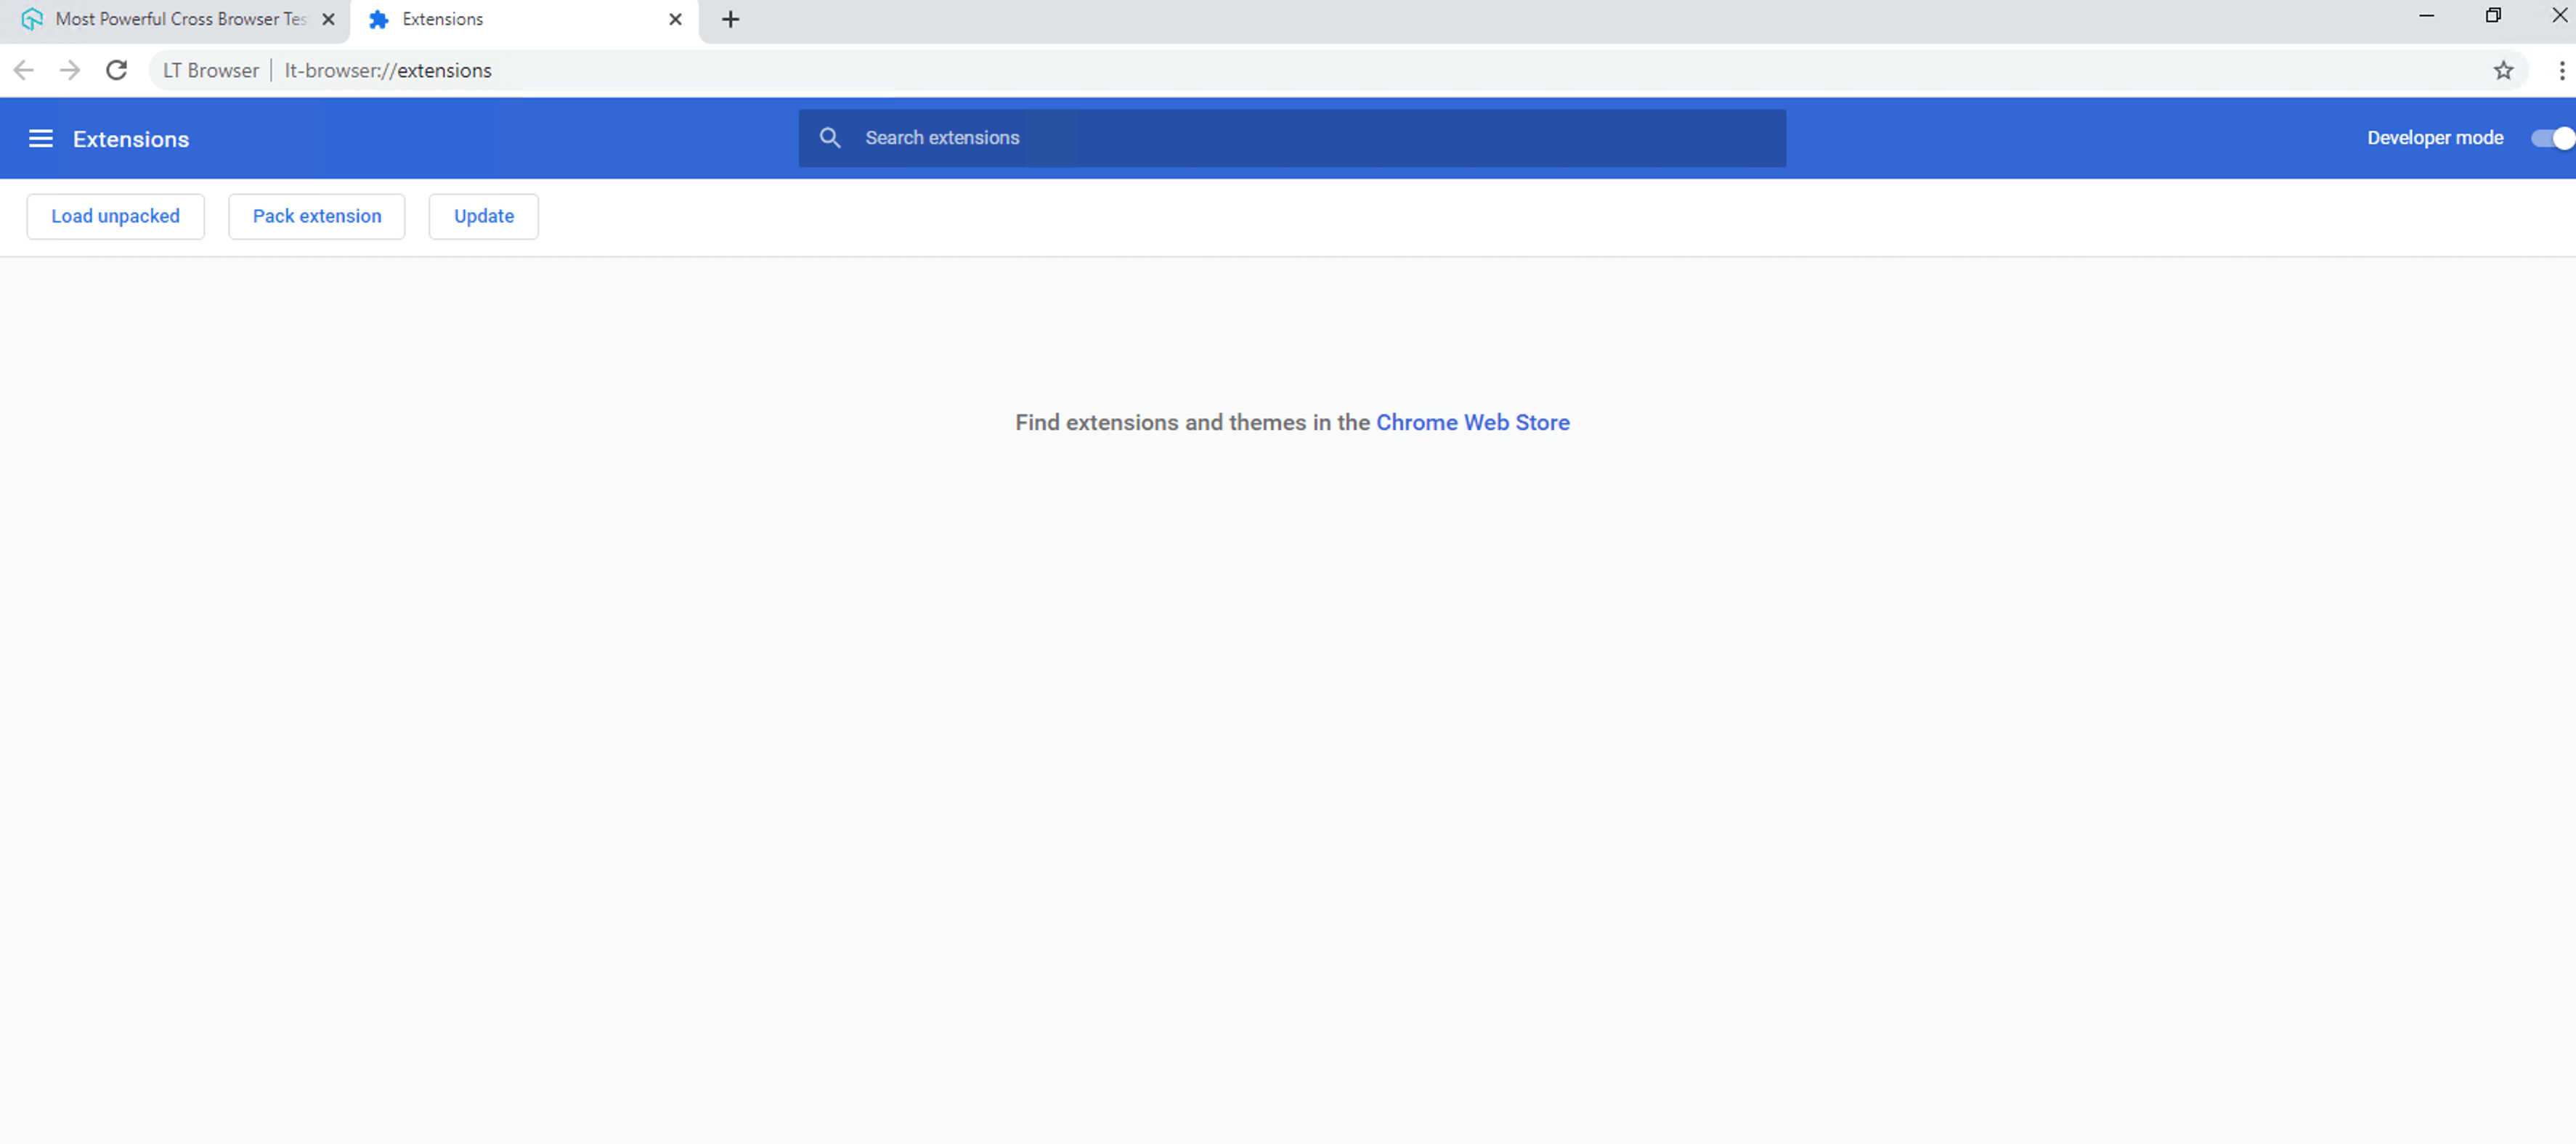
-
You can either search for your favorite Chrome extensions or drag and drop the CRX file from your local system to the Extensions page.
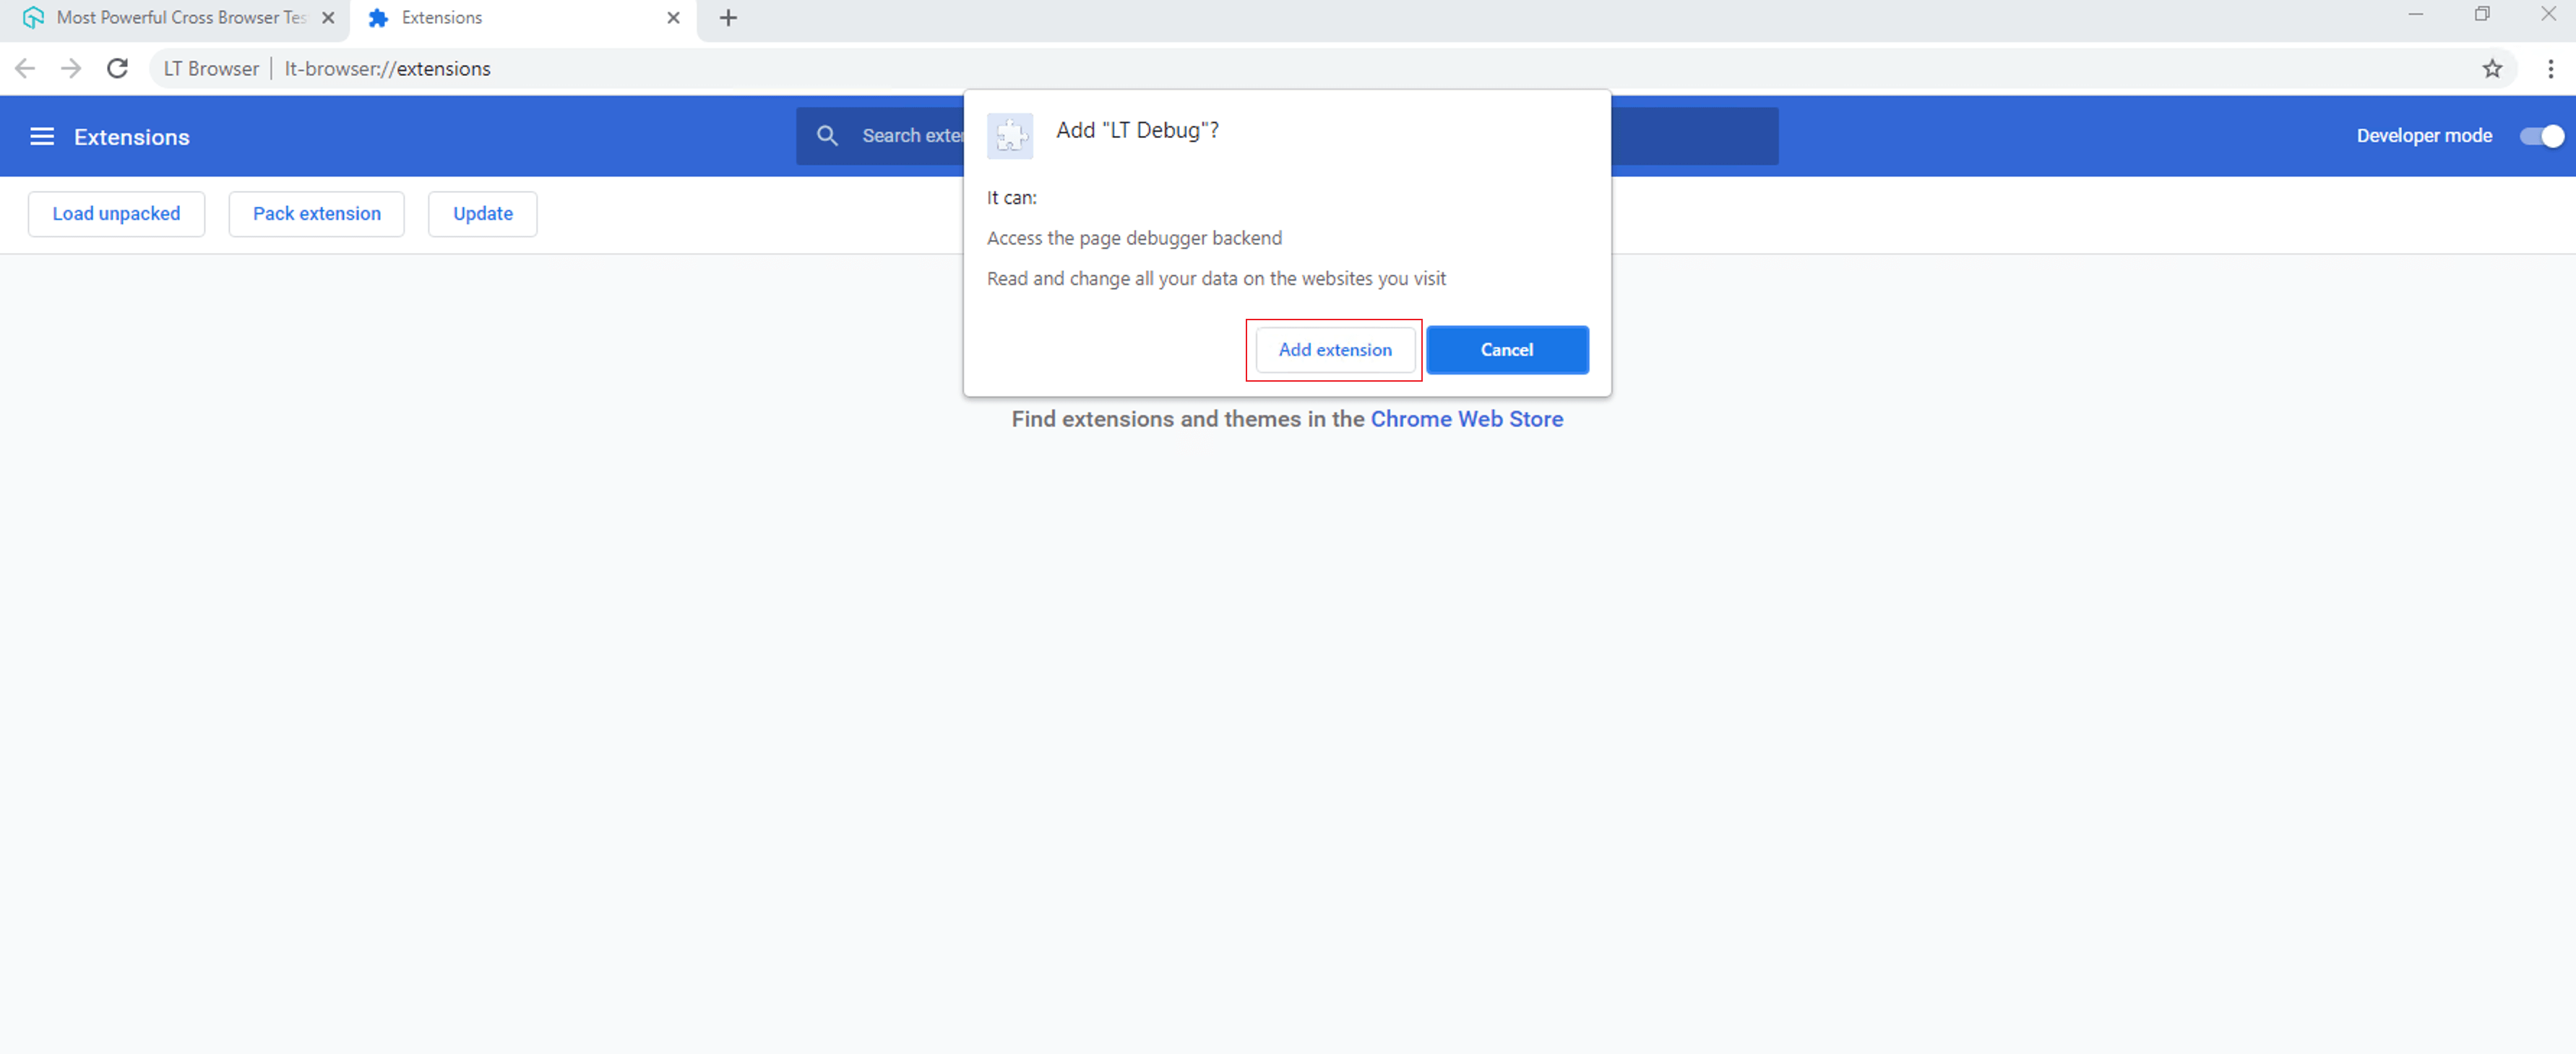
-
Once you drop the file, click Add extension to confirm the installation.
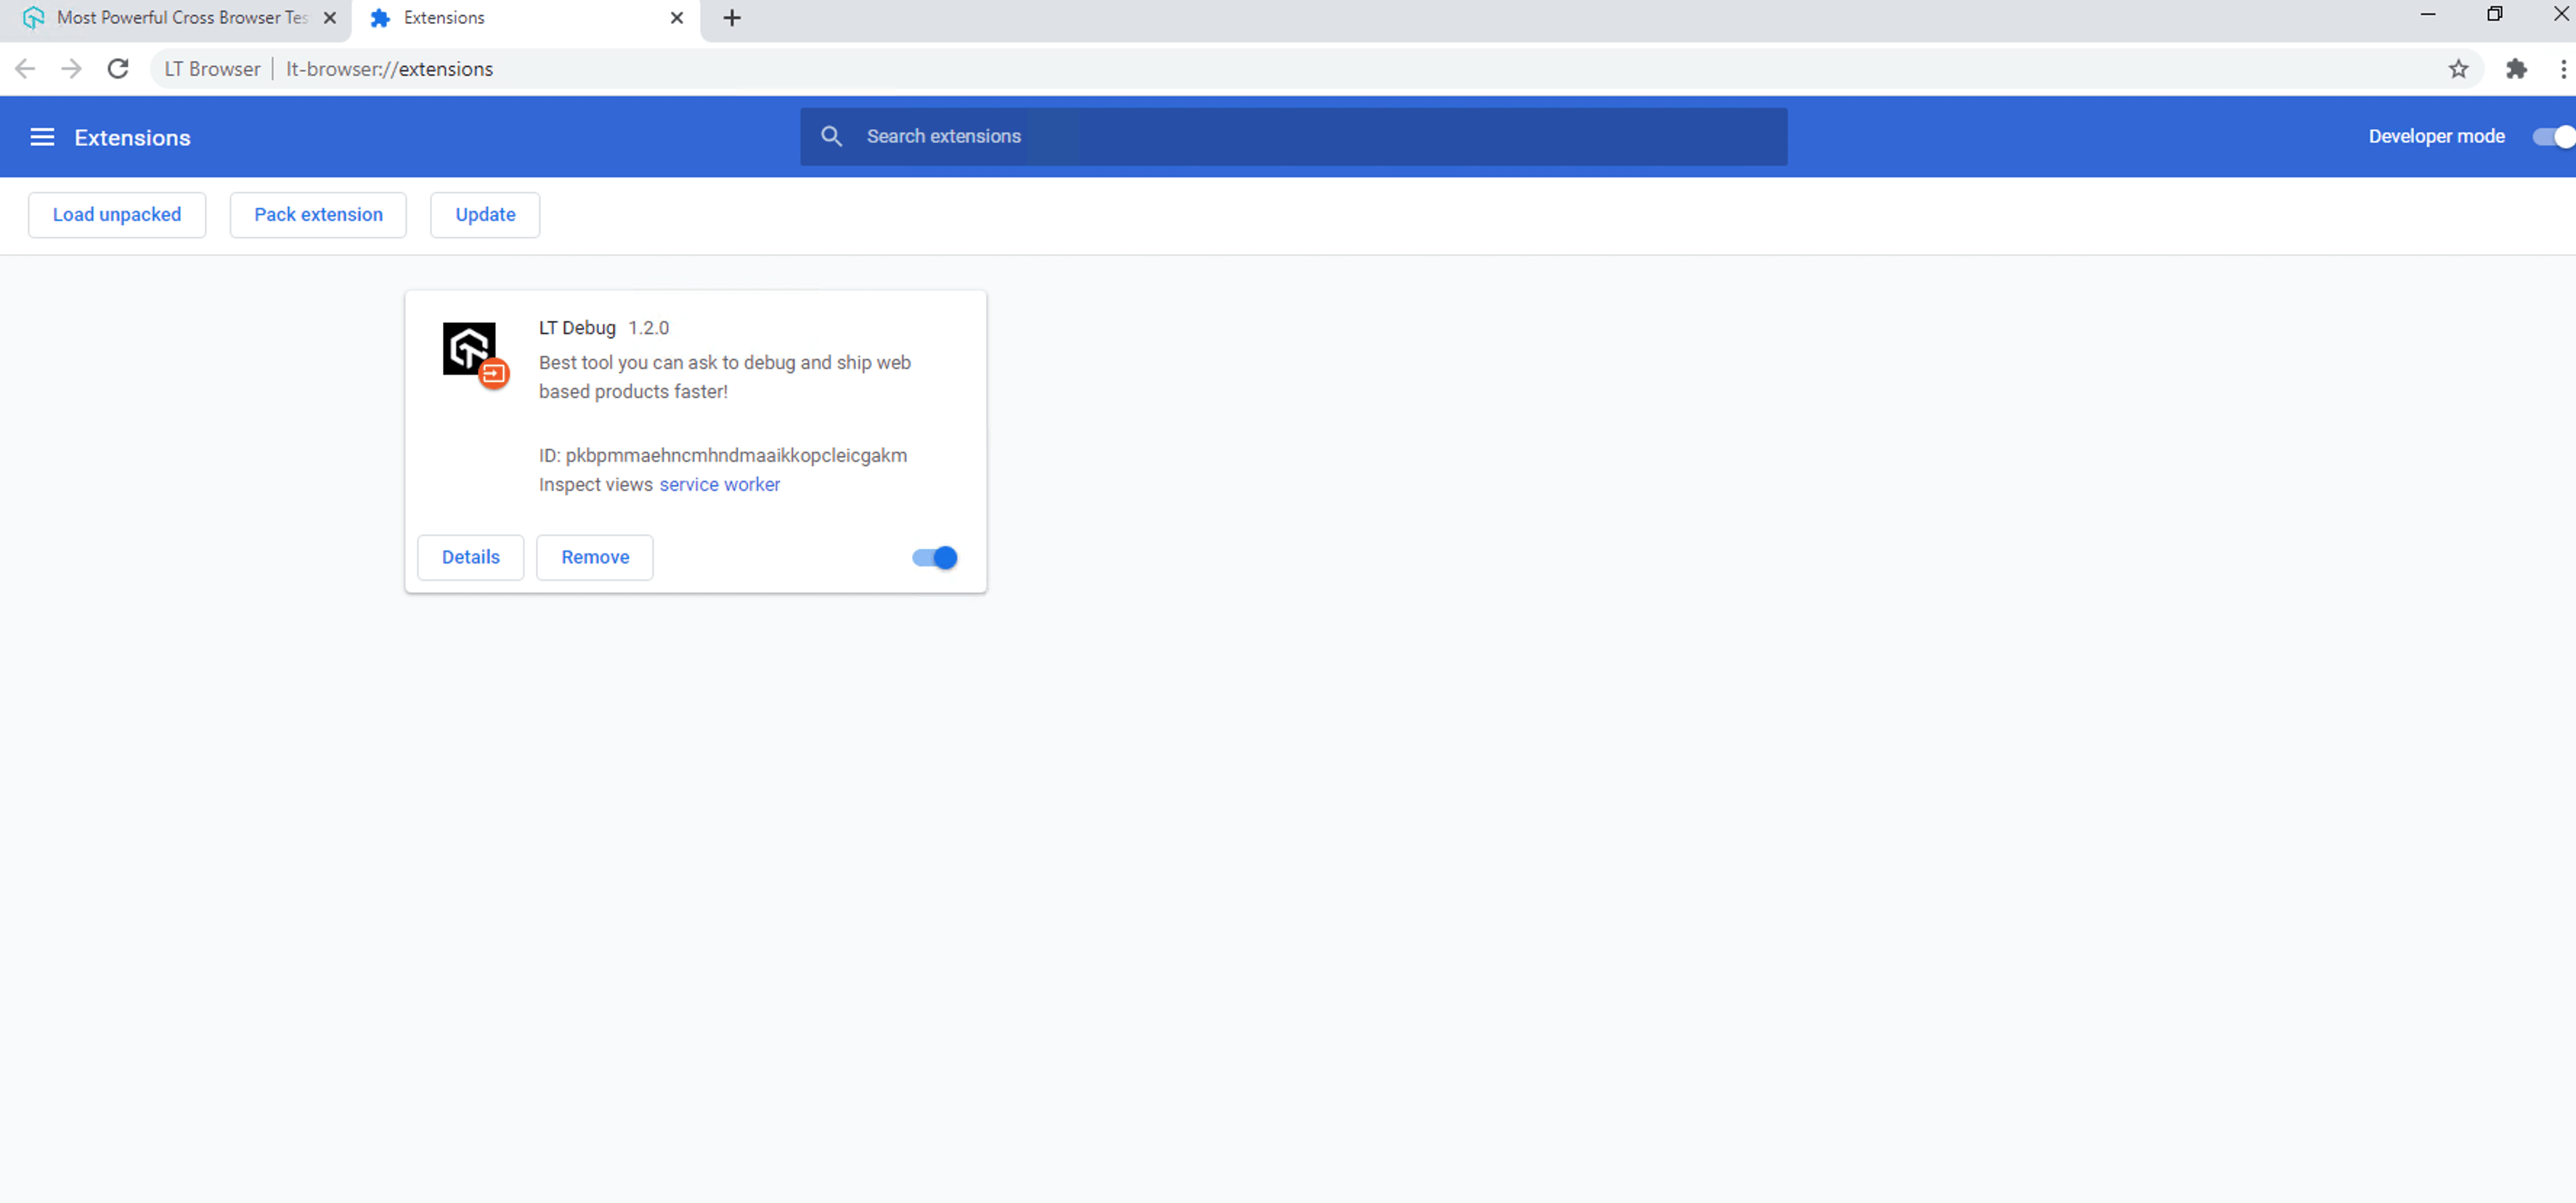
The Chrome extension you just installed will now appear in the LT Browser 2.0.
Marking And Sharing Bugs
To mark bugs, enable Enable Mark as Bug option from the Settings icon on the top-right.
While performing responsive testing, you can mark any website issues as bugs.
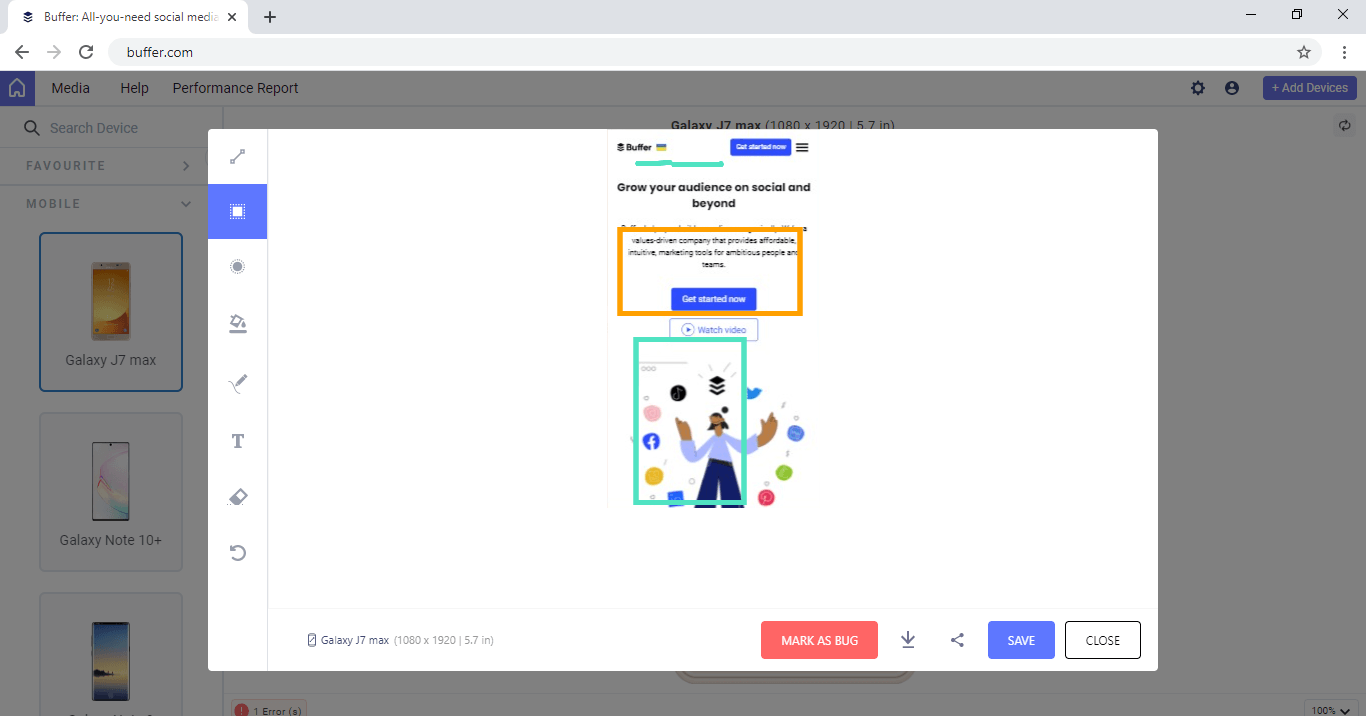
- If you come across an issue, click on the Camera icon to capture the screenshot of your mobile website.
In case you want to capture full-page screenshots, enable Full Page Screenshot option from the Settings icon on the top-right.
- Use the in-built annotation tool bar to mark any issues, bugs and tasks on a web page. Then, click Mark as Bug.
When you click the Mark as Bug, you'll be presented with a list of TestMu AI integrations. If your favorite integration isn't presented, then you can click More Integrations to view all available TestMu AI integrations.
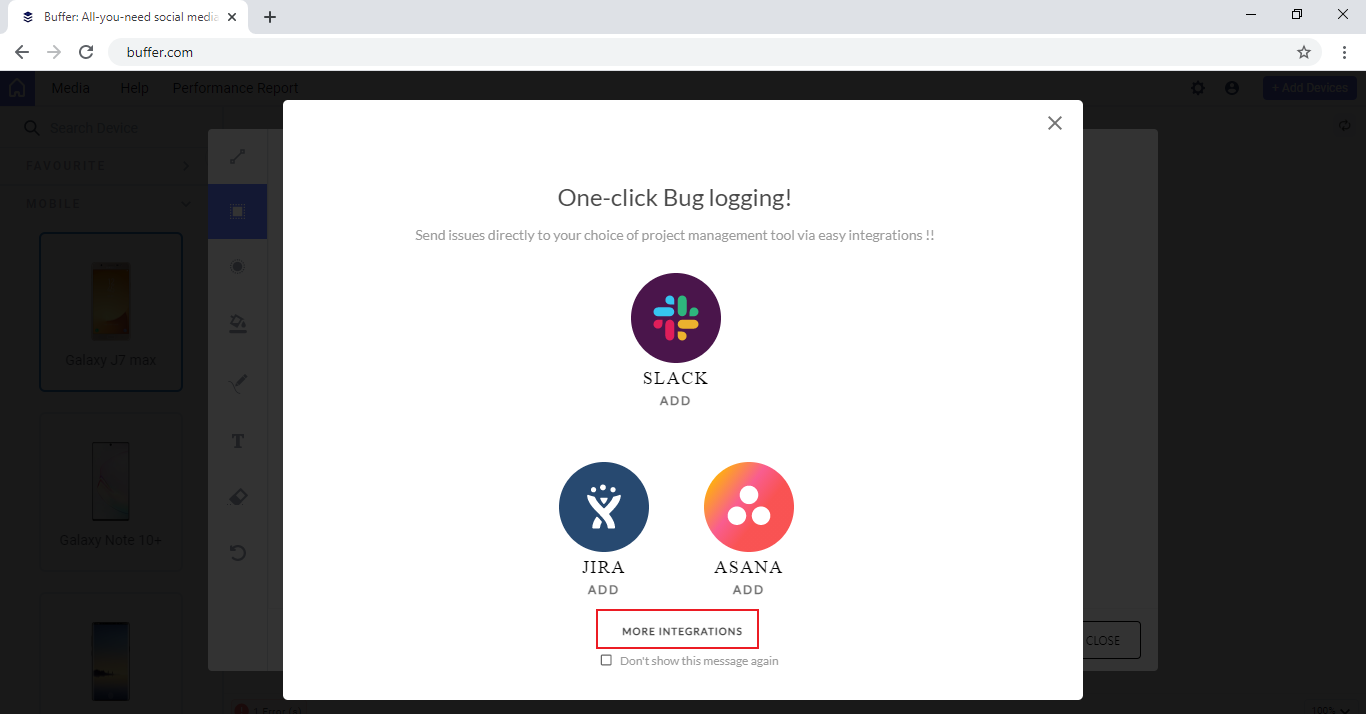
Once you integrate the LT Browser 2.0 with a third-party tools like Jira, GitLab, GitHub, and more, you can log bugs directly from the LT Browser 2.0 to your project.
Sharing Bugs
To make it easier to share bugs across your teams, LT Browser 2.0 offer multiple ways to share a screenshot of the logged issues.
Downloading The Screenshot
You can download the highlighted screenshot in your system, then share it with your team through email or instant messaging.
Saving The Screenshot
After you capture a screenshot, you can save it directly on the LT Browser 2.0 by clicking Save.
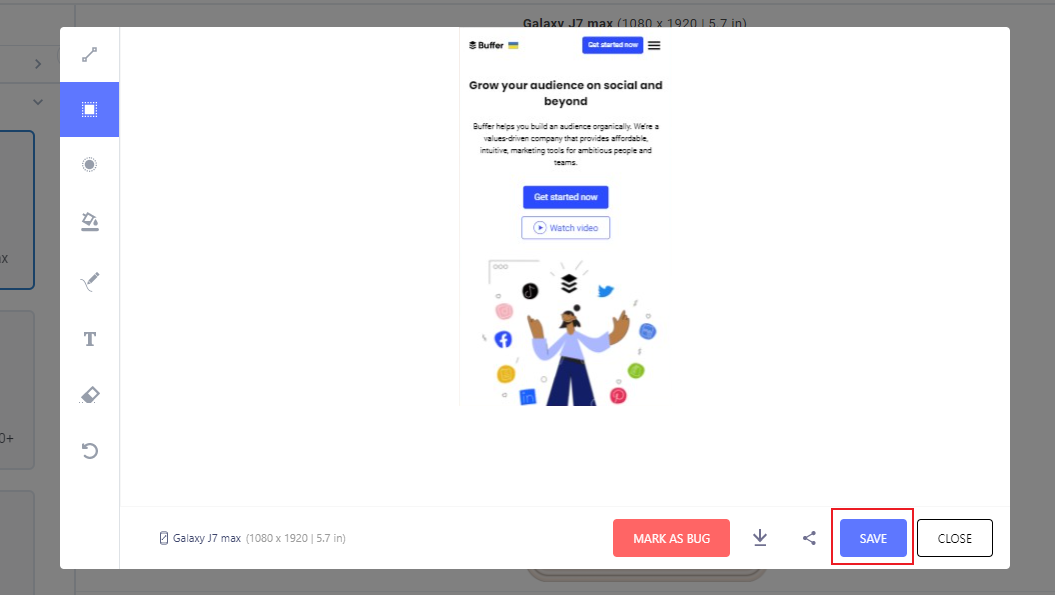
This will save your screenshot in the Media gallery. You can access this gallery by clicking the Media tab in the header.
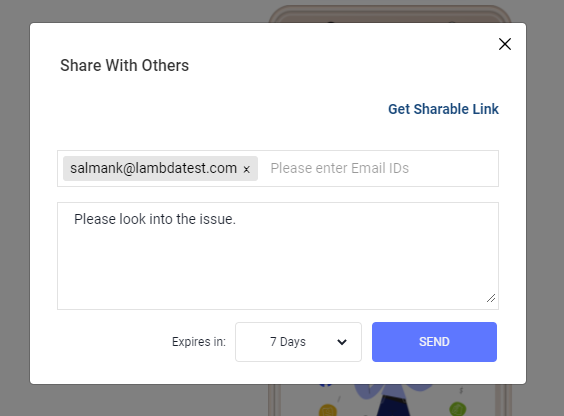
Sharing The Screenshot To Multiple Email IDs
Click on the Share icon.
You can share a bug directly to your teammate's email ID. You can include an optional note in order to help your colleague understand the nature of the bug.
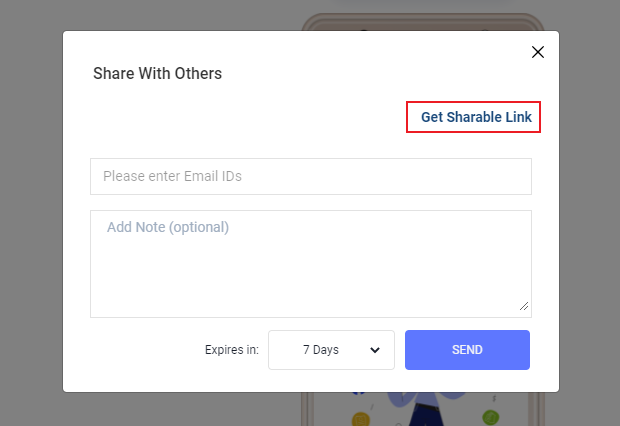
You can also copy the shareable link for sharing your bugs by clicking on Get Shareable Link.
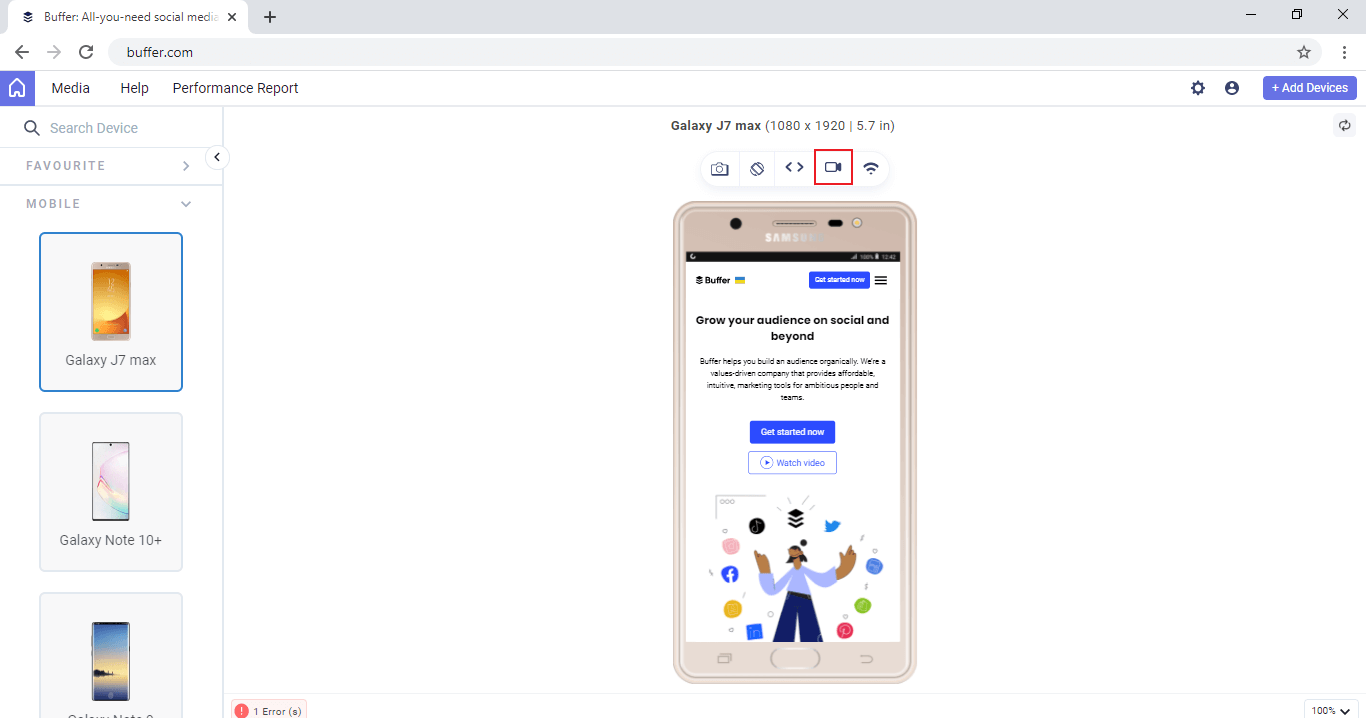
Recording Video Of A Test Session
- Open your website in any device viewport and click the Video recorder icon.
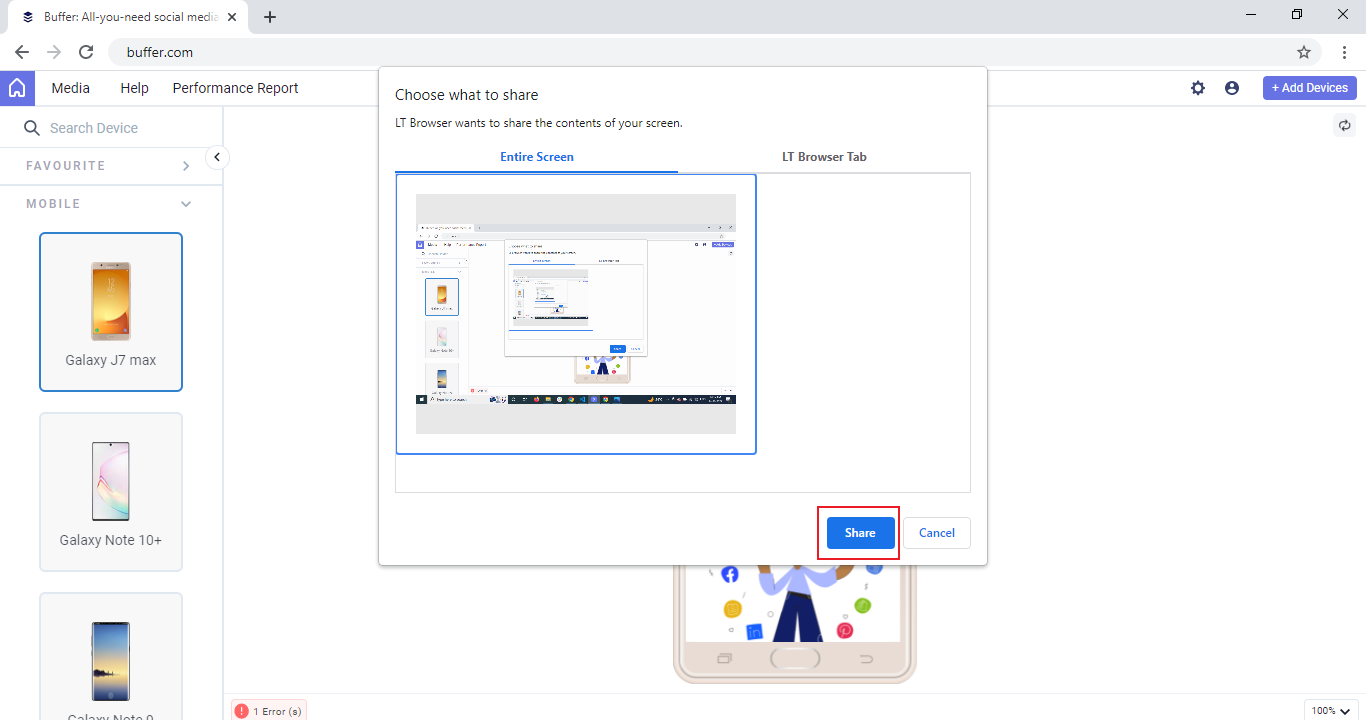
- It will ask you to select how you want to record from two options: Entire Screen or LT Browser Tab. Select either of the option and click Share.
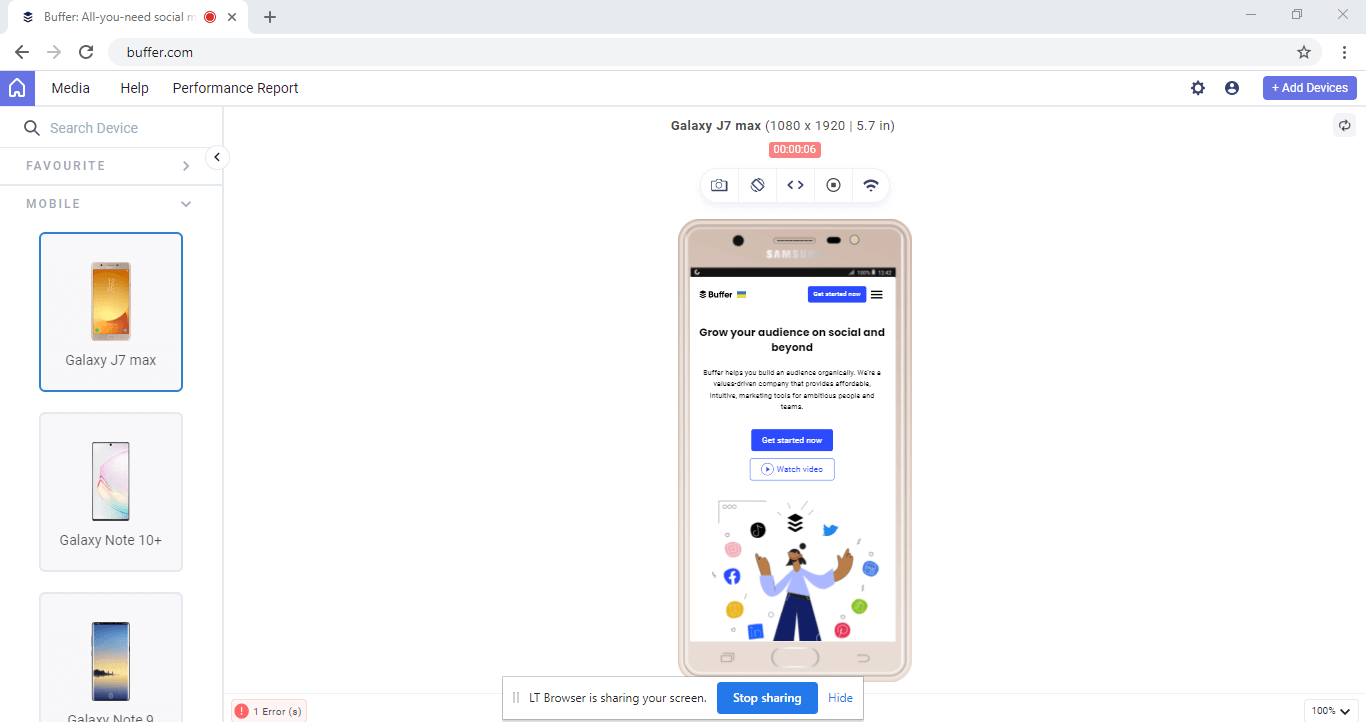
A timer will appear at the top of the screen when you begin a live testing session. The timer continues to run unless you stop the recording by clicking the same Video Recording icon or Stop sharing.
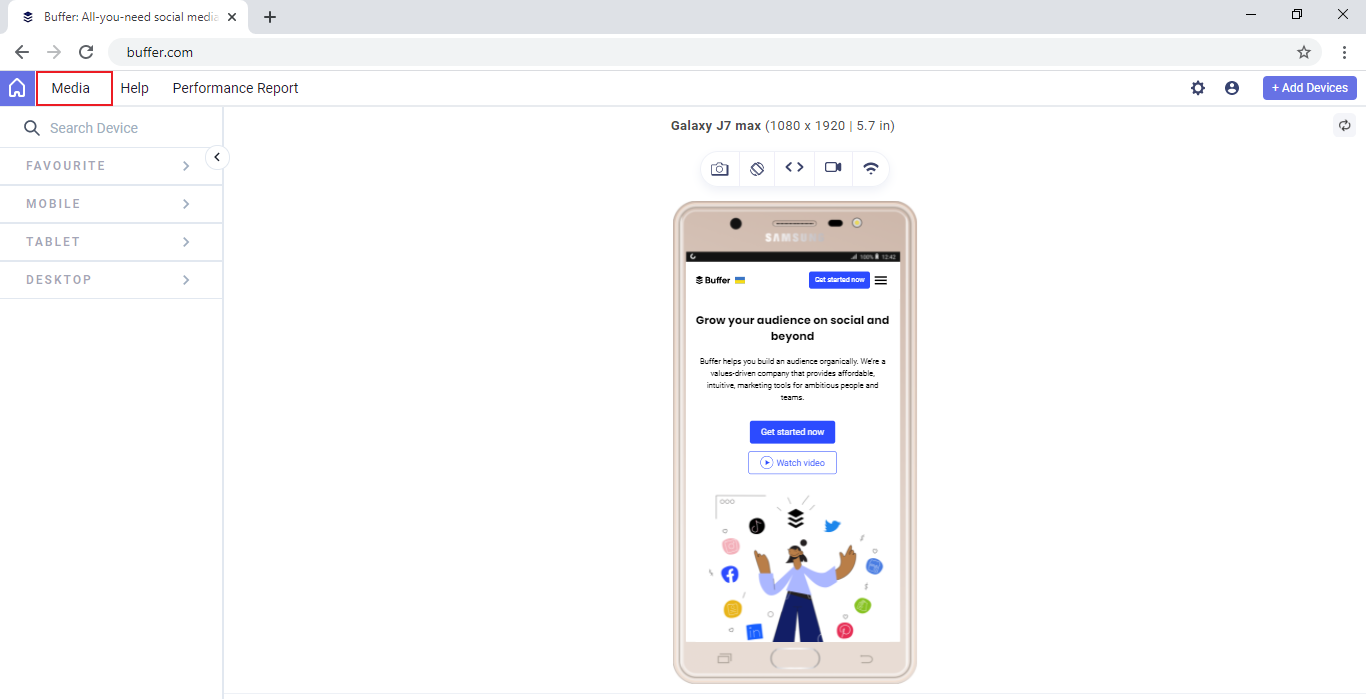
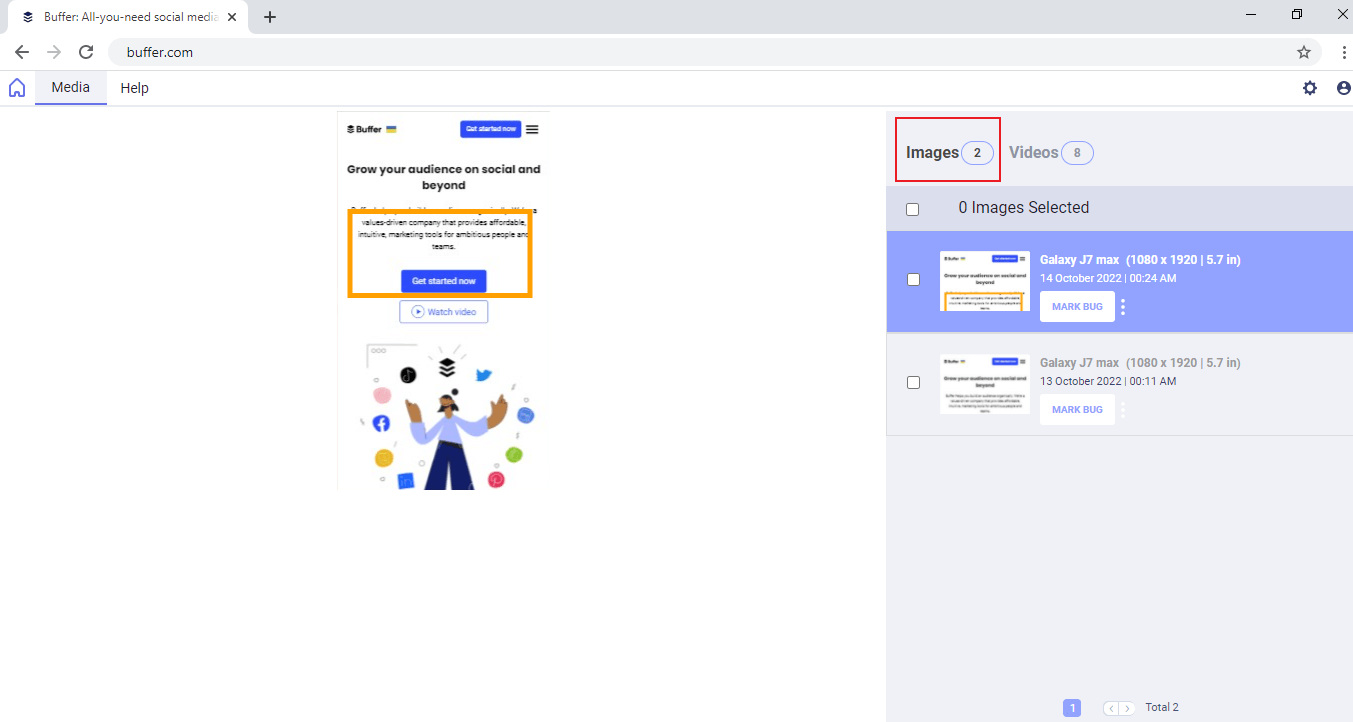
Accessing Media
To view your screen captures and recordings, visit the Media tab. In the Media section, you can find all your screenshots and video recordings.
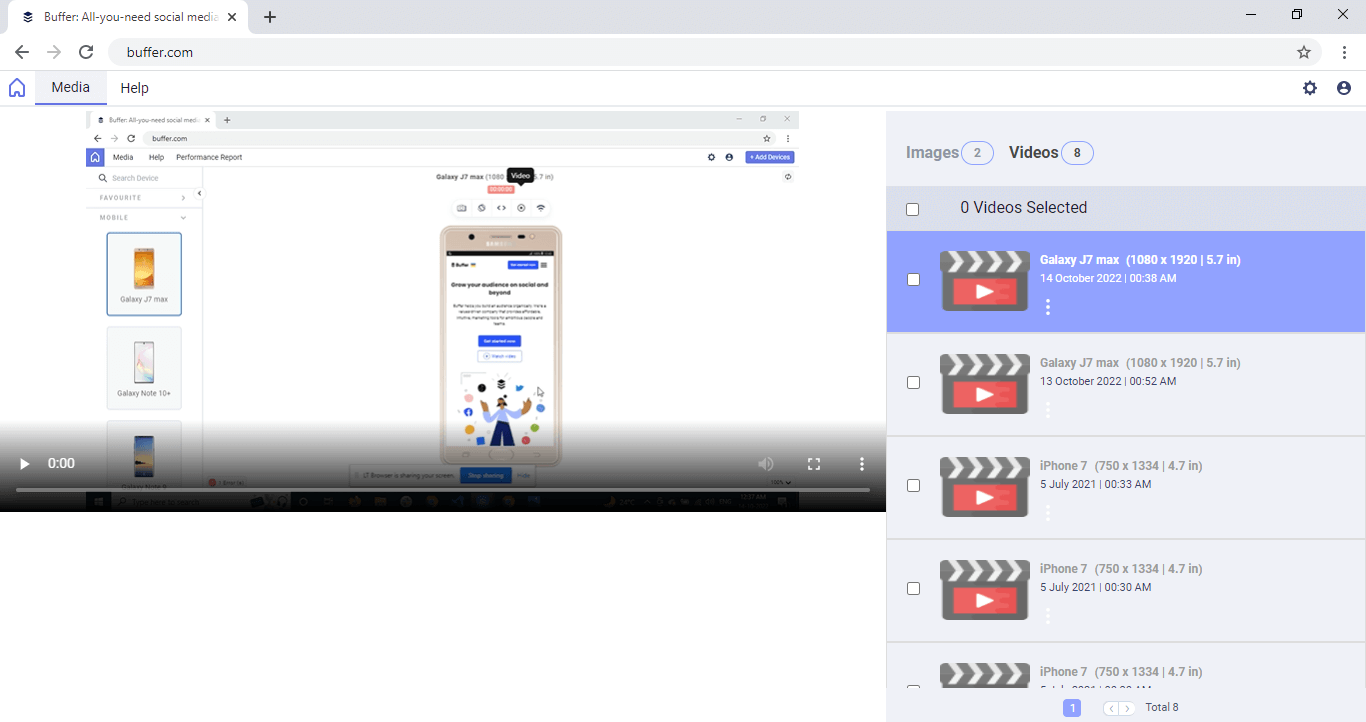
Media has two tabs: Images and Videos where you can download, share, rename or delete any image or video from the Media section.
The Videos tab shows full recordings of your live interactions from different test sessions.
Testing Locally Hosted Websites Or Web Apps
To test your locally hosted web apps or websites, you need to provide the localhost URL in the address bar of LT Browser 2.0.
The following screenshot shows Apache server running on a system, hosting an image located at XAMPP's htdocs folder.
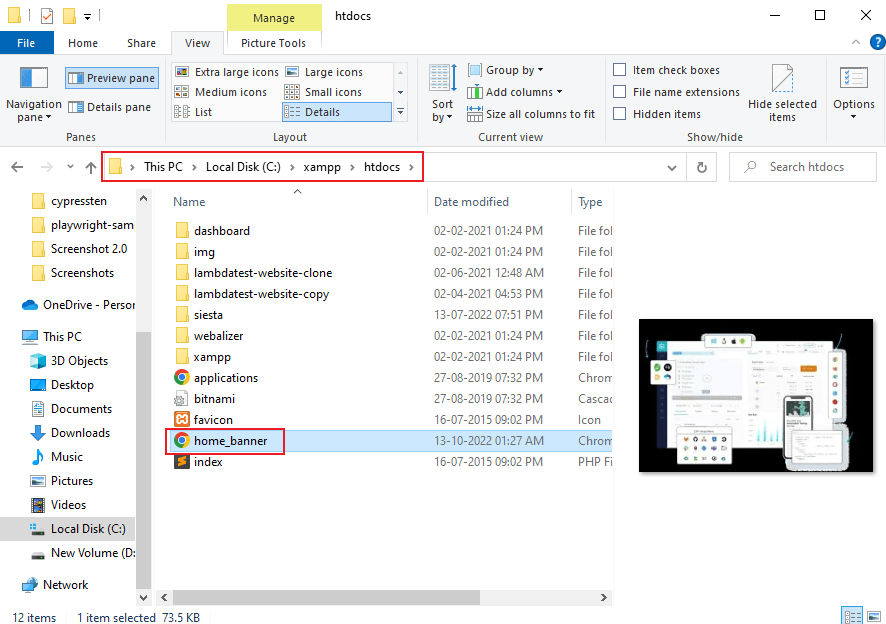
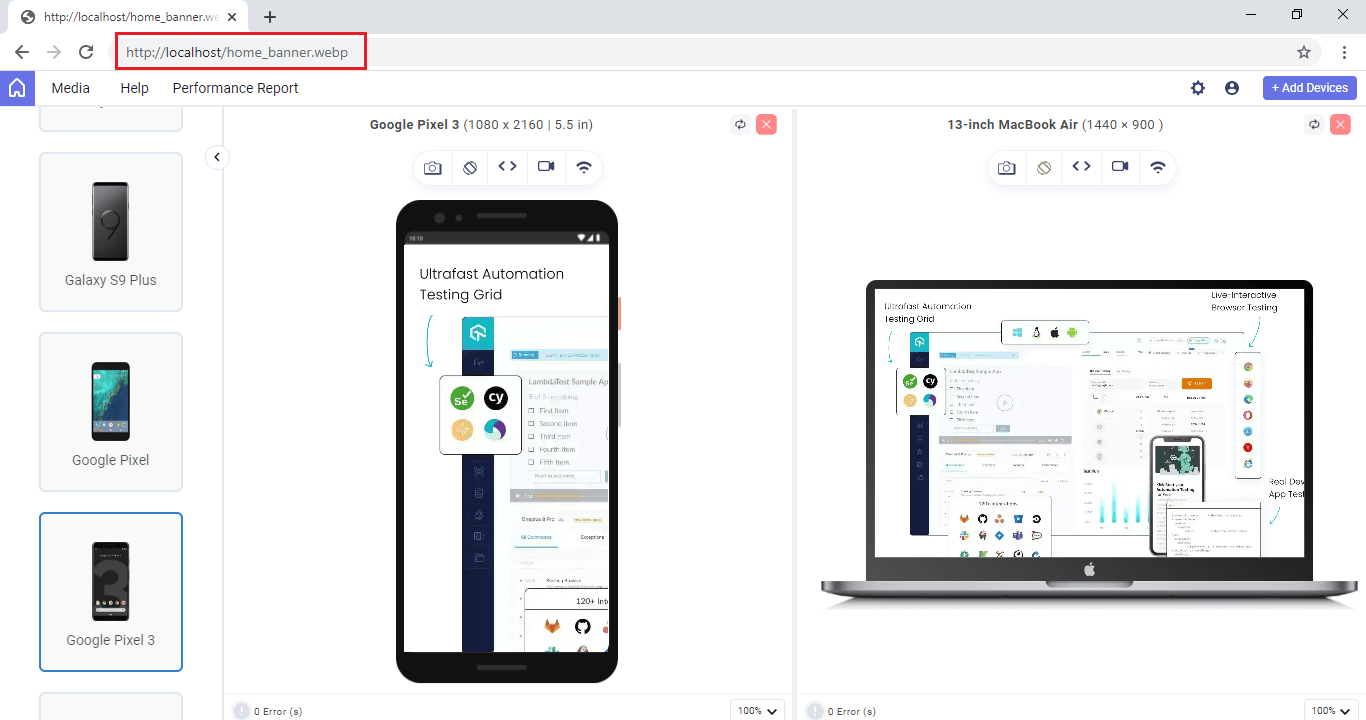
Now open the localhost in the LT Browser 2.0 and add the file path you want to test. In this case, the localhost URL will be: http://localhost/home_banner.webp.
The locally-hosted image will be rendered on your selected device viewports.
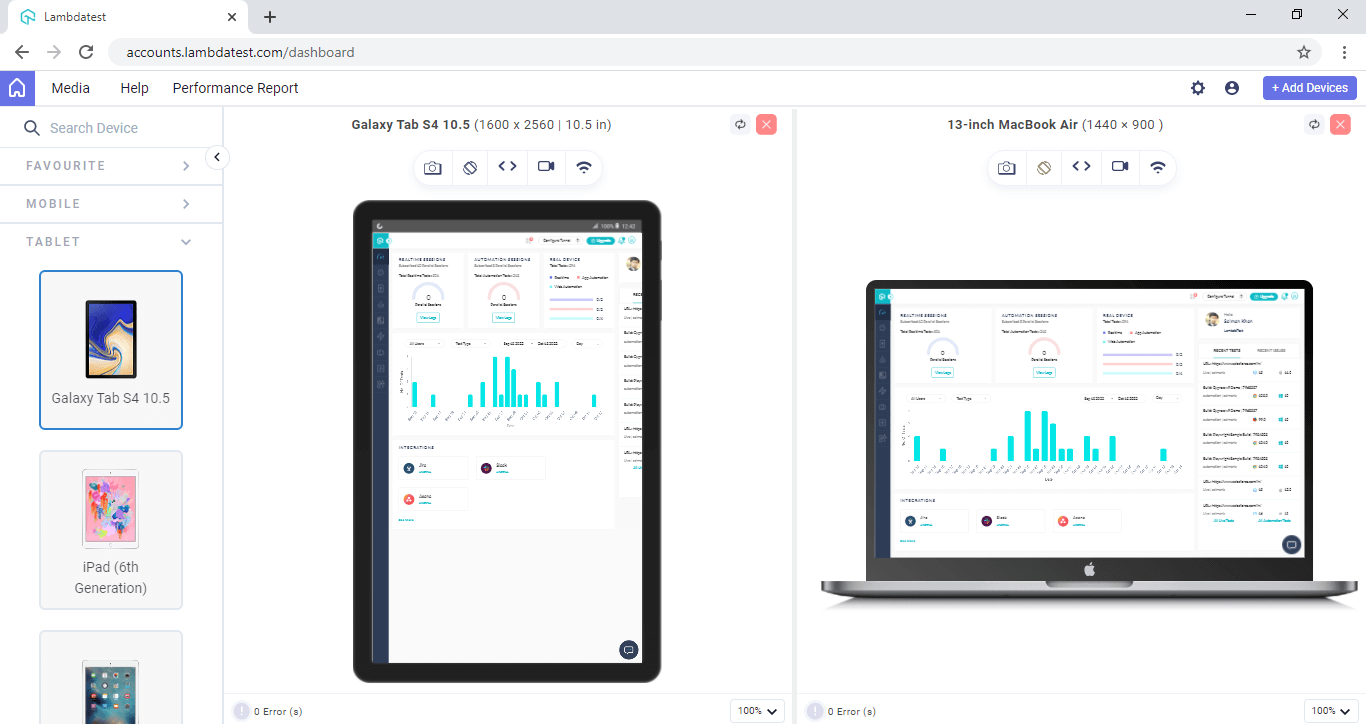
Testing Web Pages Behind Login
LT Browser 2.0 aims to provide responsive testing and a live-interactive testing experience. You can load a website, login to the LT Browser 2.0 web application, and start testing your pages.
Following screenshot shows TestMu AI web-application that is captured after logging in from the TestMu AI website.
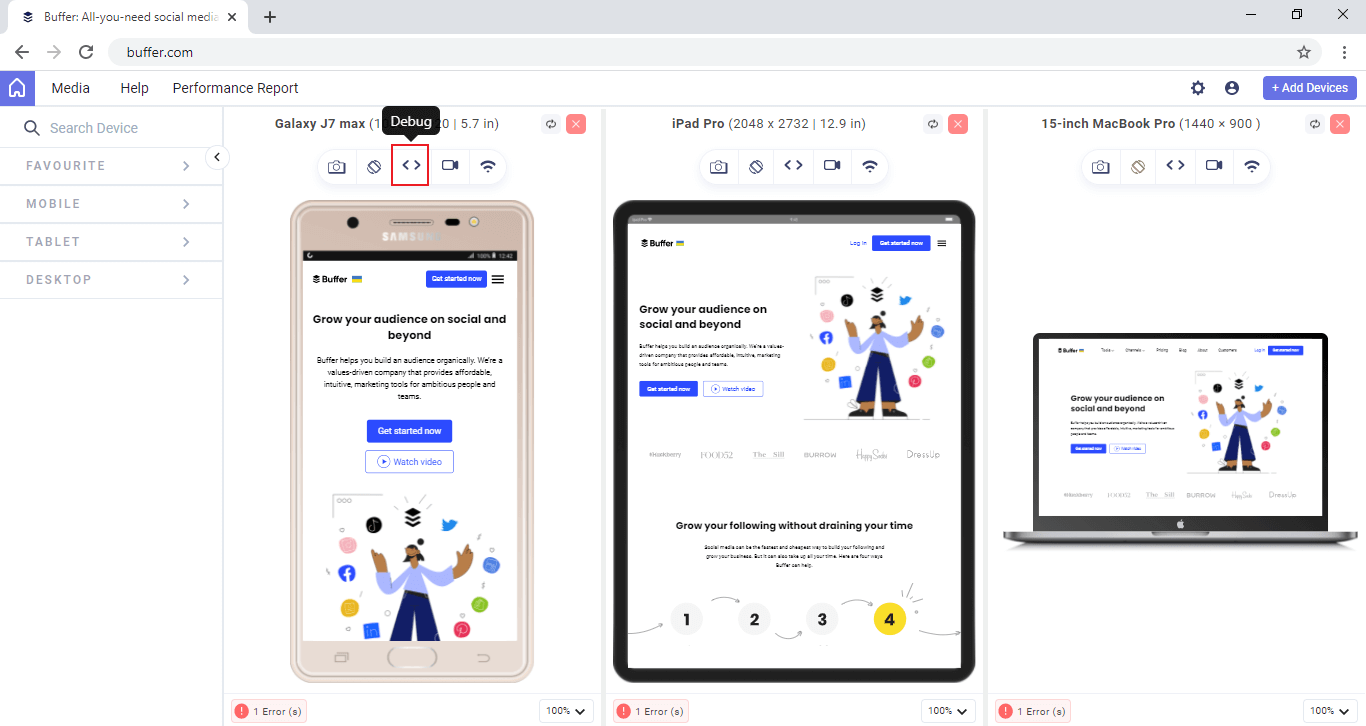
Debugging Your Websites
With LT Browser 2.0, you can see how your responsive design looks over 50+ device viewports and debug web applications with dedicated DevTools for different device viewports to determine the root cause of a browser or UI bug.
To debug your website, click on the debug icon of the respective viewport.
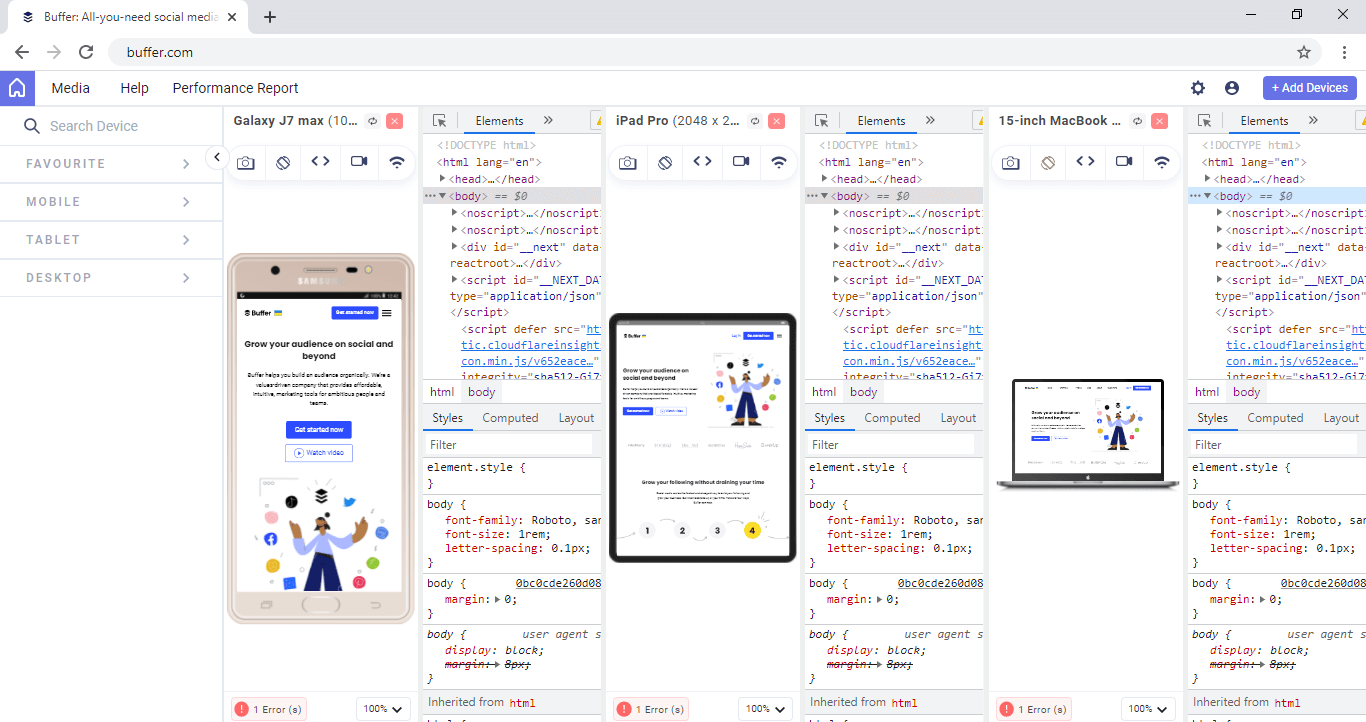
Once you click on the debug icon, you can access the developer tools for mobile view debugging.
Keyboard Shortcuts
Here are the keyboard shortcuts for LT Browser 2.0.
macOS
| SHORTCUT | PURPOSE |
|---|---|
| Command+Z | Undo |
| Shift+Command+Z | Redo |
| Command+X | Cut |
| Command+C | Copy |
| Command+V | Paste |
| Command+A | Select All |
| Ctrl+Command+F | Toggle Full Screen |
| Command+M | Minimize |
| Command+Q | Quit |
| Command+T | Opens a new tab. |
| Command+W | Close the active tab. |
| Command+Shift+M | Navigate to Media page. |
| Command+Shift+H | Navigate to Home page |
| [ | Expand and collapse the sidebar |
| Shift+P | Viewing the performance report |
| Command+Shift+R | Replacing or adding a right device |
| Command+Shift+D | Removing the right device |
Windows & Linux
| SHORTCUT | PURPOSE |
|---|---|
| Ctrl+R | Reload |
| Ctrl+Z | Undo |
| F11 | Toggle Full Screen |
| Alt+F4 | Close |
| Ctrl+X | Cut |
| Ctrl+C | Copy |
| Ctrl+V | Paste |
| Ctrl+T | Opens a new tab. |
| Ctrl+W | Close the active tab. |
| Ctrl+M | Minimize. |
| Ctrl+Shift+M | Navigate to the Media page. |
| Ctrl+Shift+H | Navigate to the Home page. |
| Shift+Ctrl+Z | Redo |
| Ctrl+Shift+D | Removing the right device |
| Ctrl+A | Select All |
| [ | Expand and collapse the sidebar |
| Alt+P | Viewing the performance report |
| Ctrl+Shift+R | Replacing or adding a right device |
