Application Performance Analytics
App performance is critical factor for user satisfaction and adoption. Identifying and resolving bottlenecks early is essential for delivering a high-quality experience but it requires constant monitoring and optimization across various device metrics. TestMu AI’s App Profiling feature helps you to detect and optimize performance issues before release by providing real-time insights into key metrics like CPU usage, memory consumption, and network activity on real devices.
You can enable performance tracking in your existing automation tests with the following capability:
"appProfiling" : true;
This feature is available for Appium tests on iOS and Android (version 9+). For full functionality, ensure the
resignAppcapability is set totrue.

Basic Summary
Here is a description of each metric from the App Profiling summary:
- Cold Startup Time : Time taken by the app to launch from a complete shutdown or a non-running state. A lower cold startup time improves user experience, as it reduces wait time when the app is opened for the first time.
- Hot Startup Time : Time taken by the app to resume from a background state. A fast hot startup ensures that users can quickly switch between apps without delays.
- Maximum CPU Utilisation : It indicates the peak percentage of CPU consumed by the app during its execution. High CPU utilization can affect other processes and contribute to battery drain, so it's important to keep it optimized.
- Average CPU : Average CPU utilization gives a more balanced view of the app’s typical CPU usage during a session. This value helps assess the app’s efficiency in resource usage over time.
- Maximum Memory Usage : It refers to the highest amount of RAM consumed by the app during the session. Monitoring this metric helps developers ensure that their app doesn't consume excessive memory, which can lead to slower performance or crashes on low-memory devices.
- Average Memory Usage : Average memory usage shows the typical amount of memory used by the app. This value is useful for identifying memory leaks and optimizing the overall resource consumption of the application.
- Maximum Disk Usage : Highest amount of storage consumed by the app on the device. Keeping disk usage minimal helps improve app performance and ensures better storage management for end users.
- Average Disk Usage : It reflects the typical amount of storage space used by the app over time. This metric is important for identifying opportunities to reduce the app’s footprint on the device's storage.
- Average Frame Rate : The frame rate measures the smoothness of the app’s graphical rendering. A higher frame rate (measured in frames per second or fps) indicates smoother animations and a better visual experience. A rate close to 60 fps or higher is typically desired for smooth app performance.
- Network Download/Upload : This metric tracks the amount of data downloaded and uploaded by the app during the session. Monitoring network usage helps developers optimize how the app handles data transmission to ensure it uses bandwidth efficiently.
- Application Not Responding : ANR events occur when the app becomes unresponsive and prompts the user to wait or close the app. A value of zero indicates the app has not faced any ANR issues, which is crucial for maintaining a stable and responsive app. You can also ANR Dumps, and Data logs.
- App Crashes : This metric tracks the number of times the app has crashed during the session. Zero crashes indicate that the app is stable, ensuring a reliable user experience.
Key Performance Metrics
1. CPU Consumption
The CPU handles all operations within a mobile device. High CPU usage impacts overall system performance and drains the battery faster. By monitoring CPU consumption, you can pinpoint which features are resource-heavy and optimize them for better performance. TestMu AI provides two CPU metrics in a time-series format:
- System CPU Usage (%): Total CPU usage across the system.
- App CPU Usage (%): CPU usage specific to your app.
Using these insights, you can minimize CPU-intensive operations, delivering a smoother user experience and enhancing device efficiency.

2. Memory Consumption
RAM is a critical resource for mobile apps. Excessive memory consumption can lead to memory leaks, degraded performance, and application crashes.
TestMu AI offers three memory metrics:
- System Memory Usage (MB): Overall memory consumption during the session.
- App Memory Usage (MB): Memory consumed by your application.
- Available Memory (MB): Remaining memory available for use.
By tracking these, you can optimize memory utilization and prevent crashes caused by memory leaks.

3. Disk Usage
The Disk Usage metric provides insights into how much disk space is being utilized by both the system and the application during a session. Monitoring disk usage is crucial for optimizing storage consumption and ensuring efficient app performance, especially on devices with limited storage capacity.
- System Disk (MB): Indicates the total amount of disk space used by the entire system, including the operating system and other background processes, displayed in megabytes (MB).
- App Disk (MB): Shows the disk space specifically consumed by your application (App Under Test) during the session, helping you track how much space your app is utilizing and whether it might cause storage-related issues.

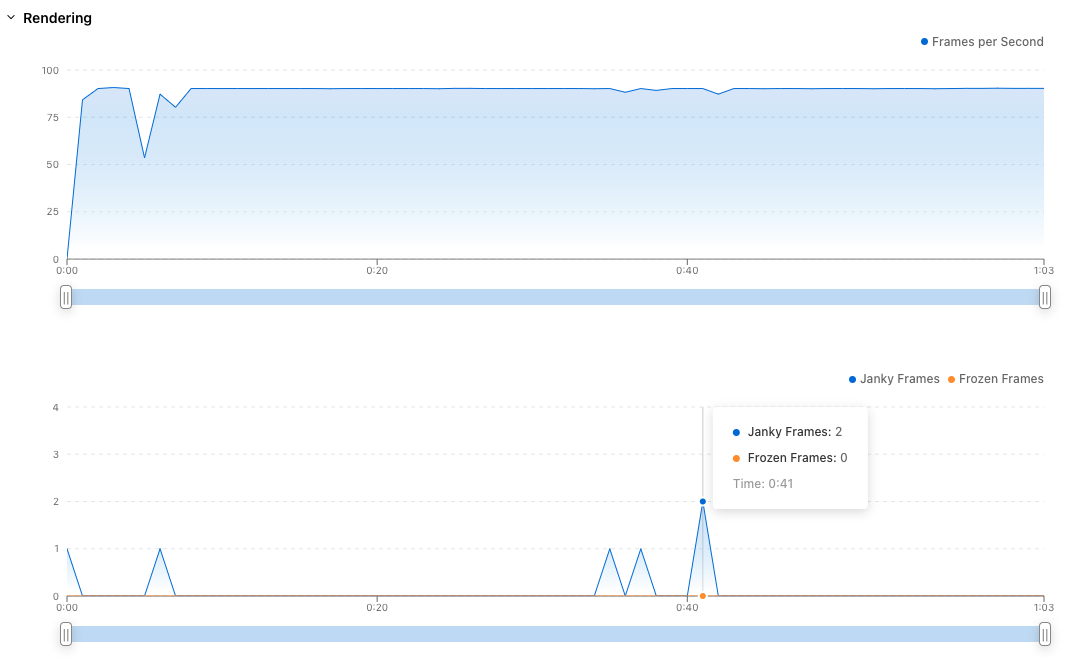
4. Rendering (Frame Rate)
Smooth rendering directly affects how responsive your app feels to users. Rendering performance is a typical performance issue that any app faces. It is measured at different stages in the app’s lifecycle to ensure that users do not have a bad experience with the app.
TestMu AI measures your app's Frames Per Second (FPS) across its lifecycle, which helps you identify performance bottlenecks in rendering and improve user experience.
- Frames Per Second (FPS): Real-time measurement of rendering performance throughout the session.
5. Network Usage
Understanding how your app utilizes network resources is essential for optimizing data transfer and ensuring efficient performance.
TestMu AI tracks:
- Download Size (MB): Amount of data downloaded during the session.
- Upload Size (MB): Amount of data uploaded during the session.
This helps you to monitor:
- Data Efficiency: Optimize data usage to enhance performance and reduce costs.
- Performance Optimization: Identify and mitigate high network usage areas that may affect app responsiveness.

6. Battery Consumption
Apps that consume excessive battery negatively affect user experience. With TestMu AI, you can monitor how your app impacts battery drain, identify features that are energy hogs, and optimize them. This will help extend battery life for devices running your app.
- Battery Drain Rate: Amount of battery consumed while using the app.

Battery consumption data is only displayed for Android applications. This feature is not available for iOS applications.
7. Temperature Monitoring
High device temperature can degrade performance and harm the user experience. TestMu AI lets you monitor battery temperature during app usage, helping you optimize features causing excessive heat generation and reducing the risk of device overheating.
- Temperature: Temperature of the device battery during app usage.

8. ANR (Application Not Responding)
Sometimes, your application stops responding, and you receive a pop-up to wait or close the app. Application freezes and crashes are frustrating for users. TestMu AI provides detailed logs on ANR events, that helps you diagnose the root causes and eliminate them.
Currently, ANR monitoring is available for Android devices only.
Metrics Provided:
- ANR Count: Number of times the app encountered ANR during the session.
- Log Dumps: Detailed logs for each ANR event to aid in troubleshooting.
9. Application Start-up Time
Application start-up time significantly impacts the first impression and overall user experience. Slow startup times create a poor first impression. TestMu AI tracks both cold and hot startup times for Android devices, giving you the data needed to reduce delays and deliver a faster app launch.
Fetch your App Profiling details via API
TestMu AI provides an API that allows you to programmatically access detailed app profiling metrics captured during your test sessions. By integrating this API into your CI/CD pipelines or automation frameworks, you can fetch real-time data such as CPU usage, memory consumption, disk usage, and network activity for deeper analysis. This enables continuous monitoring and performance optimization without manual intervention.
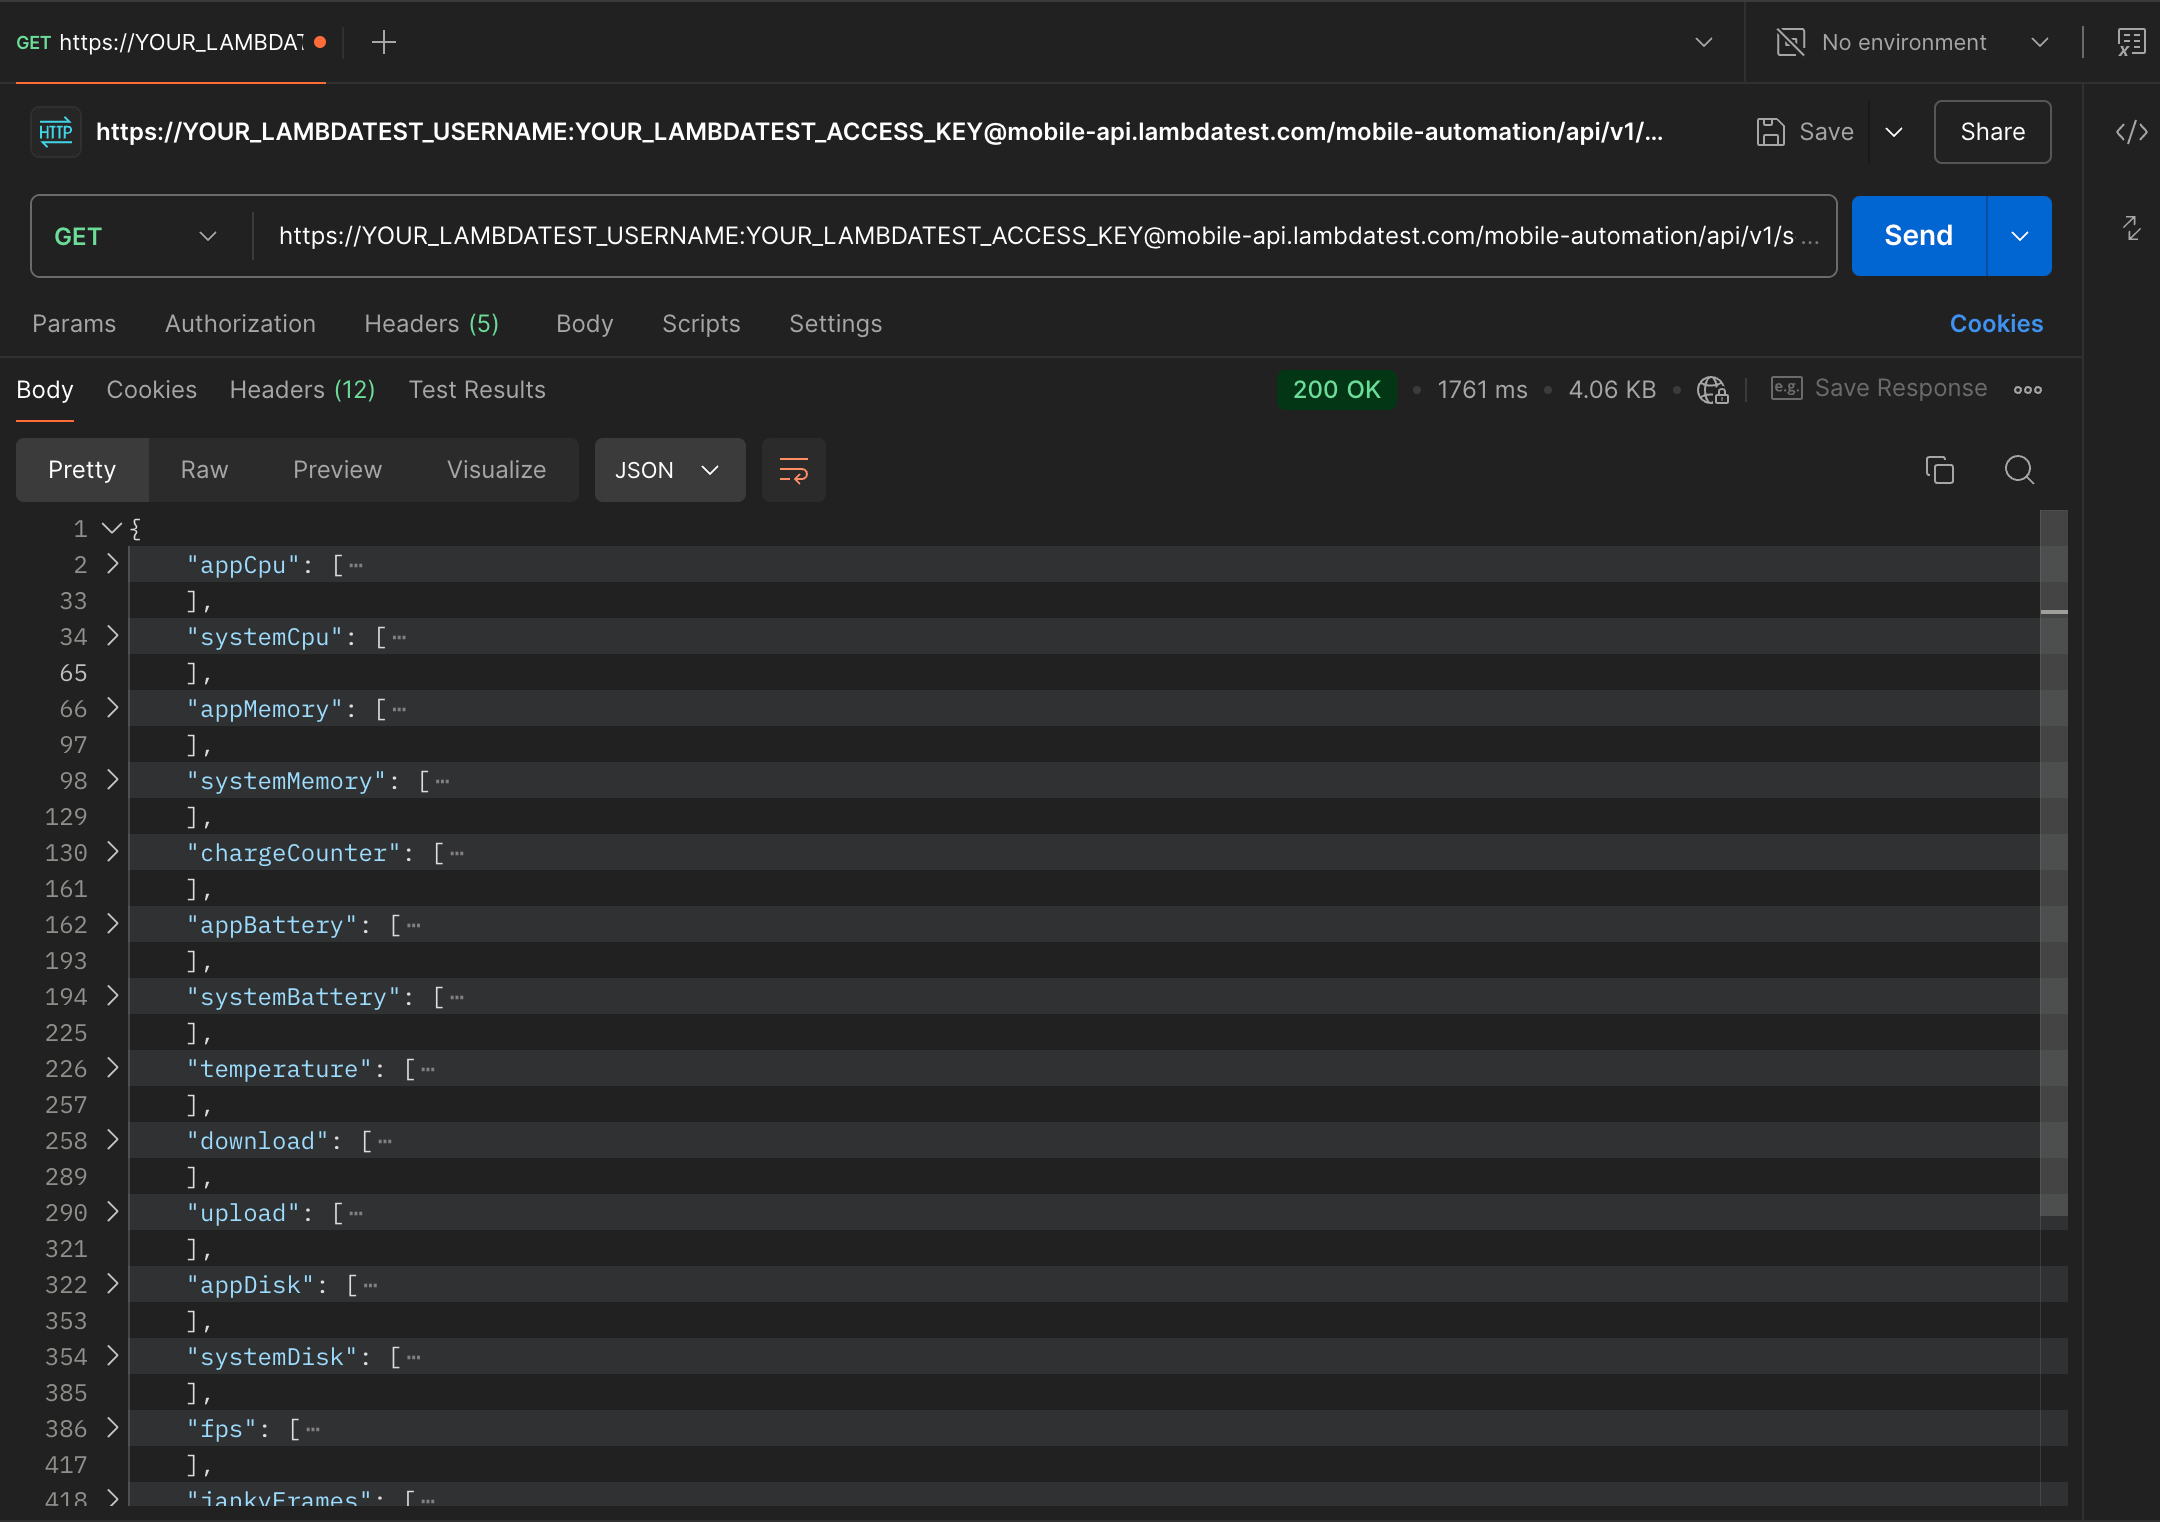
To retrieve profiling details, simply make a request to the TestMu AI API using your authentication token (username and access key) and the relevant session ID. The response will include comprehensive metrics in JSON format, allowing easy integration with other tools or reporting systems for further insights.
https://undefined:undefined@mobile-api.lambdatest.com/mobile-automation/api/v1/sessions/SESSION_ID/log/appmetrics
Step 1: Run your app automation test on the Real Device Cloud.
Step 2: Get your SESSION_ID from the Meta Data section.

Step 3: Replace the YOUR_SESSION_ID parameter in the given API with your actual session id.
https://undefined:undefined@mobile-api.lambdatest.com/mobile-automation/api/v1/sessions/YOUR_SESSION_ID/log/appmetrics
Step 4: Now go to any API testing platform, and pass the above URL (GET Method) to fetch the relevant results.
Got any questions?
Please reach out at our 24x7 Chat Support or you could also mail us at support@testmuai.com.
