HAR Log Viewer With Waterfall
The HAR (HTTP Archive) Log Viewer with Waterfall displays how resources on a web page load and interact over time. Use it to identify bottlenecks and optimize page performance in your Selenium tests.
How to Use the HAR Log Viewer
Enable HAR logging by passing network.full.har = true in your test capabilities.
Once the test runs, open the Web Automation Dashboard and navigate to the Network tab to see the waterfall chart.
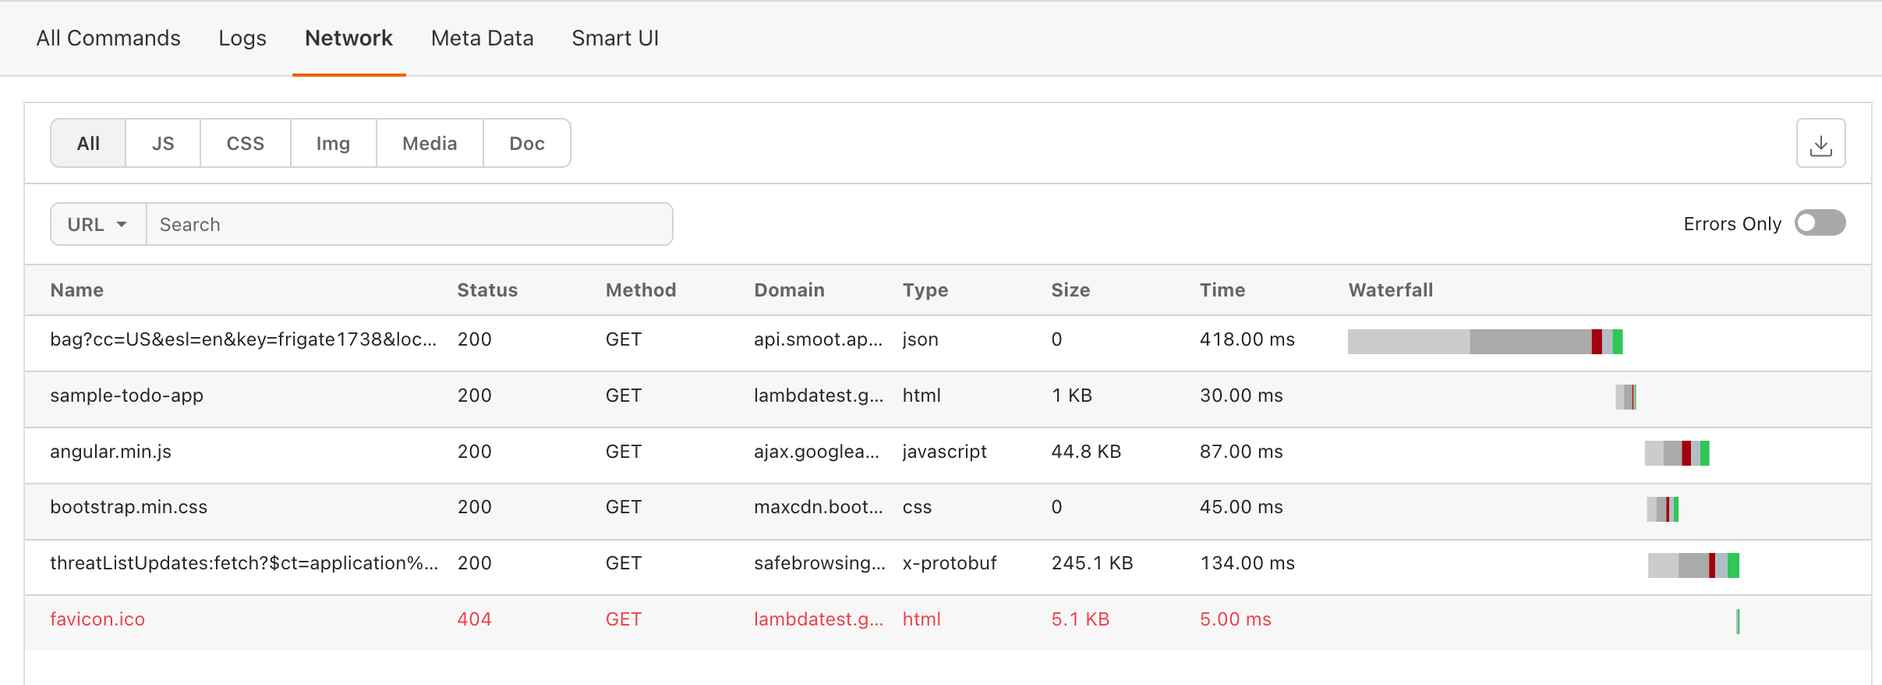
Each resource (HTML, CSS, JavaScript, images) appears as a horizontal bar. The bar length shows load time, and the sequence reflects the order the browser requested them.
Use Cases
Apply the HAR Log Viewer to diagnose and improve page performance.
- Performance optimization - Pinpoint slow-loading resources and compress images, minify CSS/JS, or improve caching.
- Load order diagnosis - Check if critical CSS and JavaScript load before non-essential resources.
- Network issue identification - Determine if delays are server-side (slow time to first byte) or network-related (slow download).
- Performance monitoring - Compare HAR logs over time to detect degradation after deployments.
- Third-party resource impact - Measure how ads, analytics scripts, and other external resources affect load time.
- Before/after comparison - Compare HAR files before and after optimization to measure improvements.
- Cross-browser analysis - Analyze HAR files from different browsers to understand loading differences.
