How to Debug your Scenario Steps Errors
This document will help you debug your failed job if you are facing any errors in the Scenario stage.
Invalid Credentials
If you're encountering an error message as shown below, it means you have entered an invalid Username and Access Key in your test file capabilities.
OpenQA.Selenium.WebDriverException : The newSession command returned an unexpected error.
401 Unauthorized !! Please include  `user` & `accessKey` in desired capabilities.
To resolve this issue, you have to visit our Automation Capability Generator site and configure your project suite capabilities generated as per your desired language and framework.
Unable to create Session
When you initiate a test execution and encounter the issue that your session is not getting started,

This is possible due to the following reasons:
- If your credentials are not correct.
- If you have created local driver instead of remote webdriver connection
- If your HUB URL is incorrect.
To address this challenge, our recommended solution is to visit the Automation Capability Generator website. Here, you can seamlessly generate accurate and valid sets of credentials and capabilities, thereby rectifying issues associated with test failures.
Invalid HUB Endpoint
If you put the wrong HUB Endpoint in your test file, you will receive the following error:

To rectify this issue, you need to cross-check your HUB URL. You can also visit this website and click on Access Key button to get your correct HUB URL.
Tunnel Error
When Tunnel is Disconnected or Not Running
-
If you have mentioned the Tunnel URL in both capabilities and the YAML file, then it is likely that your Tunnel may get disconnected or will not run. To resolve this, you need to simply remove the Tunnel URL from either of the files.
-
If you are running Tunnel using Binary, then you need to ensure that your credentials for binary and capability are the same.
When you try to access a Private Endpoint
If you are trying to access an internal website or any other private endpoint which is behind any firewall using tunnel and you are getting the below mentioned error:
System.AggregateException: One or more errors occurred. --->
OpenQA.Selenium.WebDriverException: unknown error: net::ERR_NAME_NOT_RESOLVED
To resolve this, you have to pass this flag in your YAML file:
tunnel: true
Stage is Stuck
When you encounter a situation where the stage appears to be stuck or unresponsive (machines are taking lot of time to allocate), then follow these measures to diagnose and address the issue.
As you can see below, stage is taking a lot of time to allocate Virtual Machines to the tests.
-
Identify the Task: Begin by identifying the specific task or workflow where the machine appears to be stuck. This involves determining the action or process that triggered the unresponsive stage.
-
Locate the Stuck Stage: Once the task is identified, pinpoint the exact stage that is causing the delay. This can be done by reviewing the platform's progress indicators or monitoring tools.
-
Examine Stage Logs: Check the stage logs associated with the stuck stage. These logs provide detailed information about the stage's execution and may contain error messages or warnings that indicate the root cause of the issue.
-
Analyze Martian Logs: If the stage logs suggest an API call is stuck, refer to the Martian logs available on the dashboard. These logs reveal whether the API call originated from the machine and capture the response received from the endpoint.
-
Review Tunnel Logs: For users employing Tunnel with MITM mode, consult the Tunnel logs to gain deeper insights into network calls. These logs provide granular details about network interactions, potentially revealing the cause of the stuck stage.
After identifying the issue, follow these steps to resolve the situation:
Step 1: Go to the specific test case method or test class where the problematic REST Assured API is being called.
Step 2: Ensure that you have set an appropriate connection timeout and socket timeout. This ensures that the system doesn't wait indefinitely for a response.
Step 3: Consider printing the responses during debugging to verify whether the API is providing the expected responses.
Test is Stuck
When a particular test is taking longer than expected to complete, follow these measures to diagnose the issue:
-
Identify the Stuck Test: Begin by identifying the specific test that is hanging or exceeding the average execution time. This can be done by reviewing test execution reports or monitoring tools.
-
Examine Test Code: Locate the corresponding test case in the codebase. Analyze the test code to identify any API calls that might be causing delays in response times.
-
Check for Infinite Loops: Inspect the test code for potential infinite loops. Infinite loops can occur when commands are repeatedly executed without proper termination conditions, leading to excessive test execution time.
-
Local Machine Testing: Replicate the test execution on the user's local machine to determine if the issue is specific to their environment or if it's a general problem with the test itself.
-
Selenium Command Analysis: Analyze the Selenium commands within the test case to understand their intended behavior and identify any potential irregularities or inefficiencies that could be contributing to the prolonged test execution.
After identifying the issue, follow these steps to resolve the situation:
-
Optimize API Calls: Refine the API calls within the test case to improve response times. This may involve optimizing query parameters, using caching mechanisms, or adopting alternative API endpoints.
-
Eliminate Infinite Loops: Modify the test code to eliminate any identified infinite loops. Implement proper loop termination conditions to ensure that commands are executed within the expected timeframe.
-
Restructure Test Code: Refactor the test code to improve its overall structure and efficiency. Consider using conditional statements, data-driven testing techniques, or parallel execution strategies to streamline test execution.
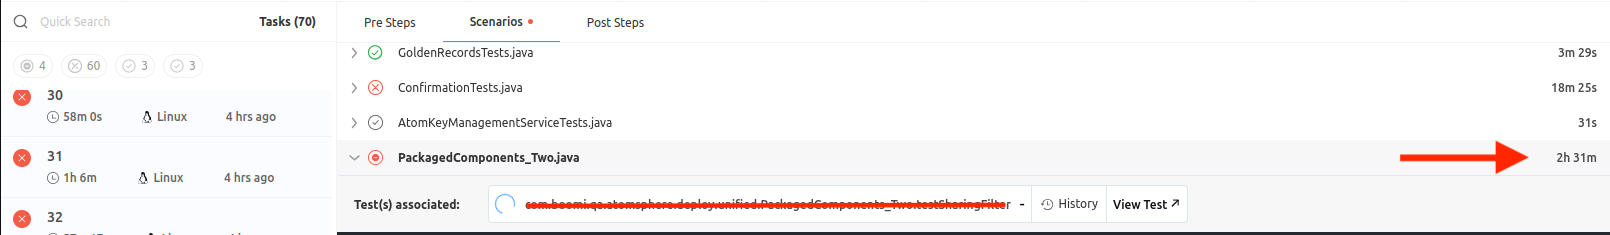
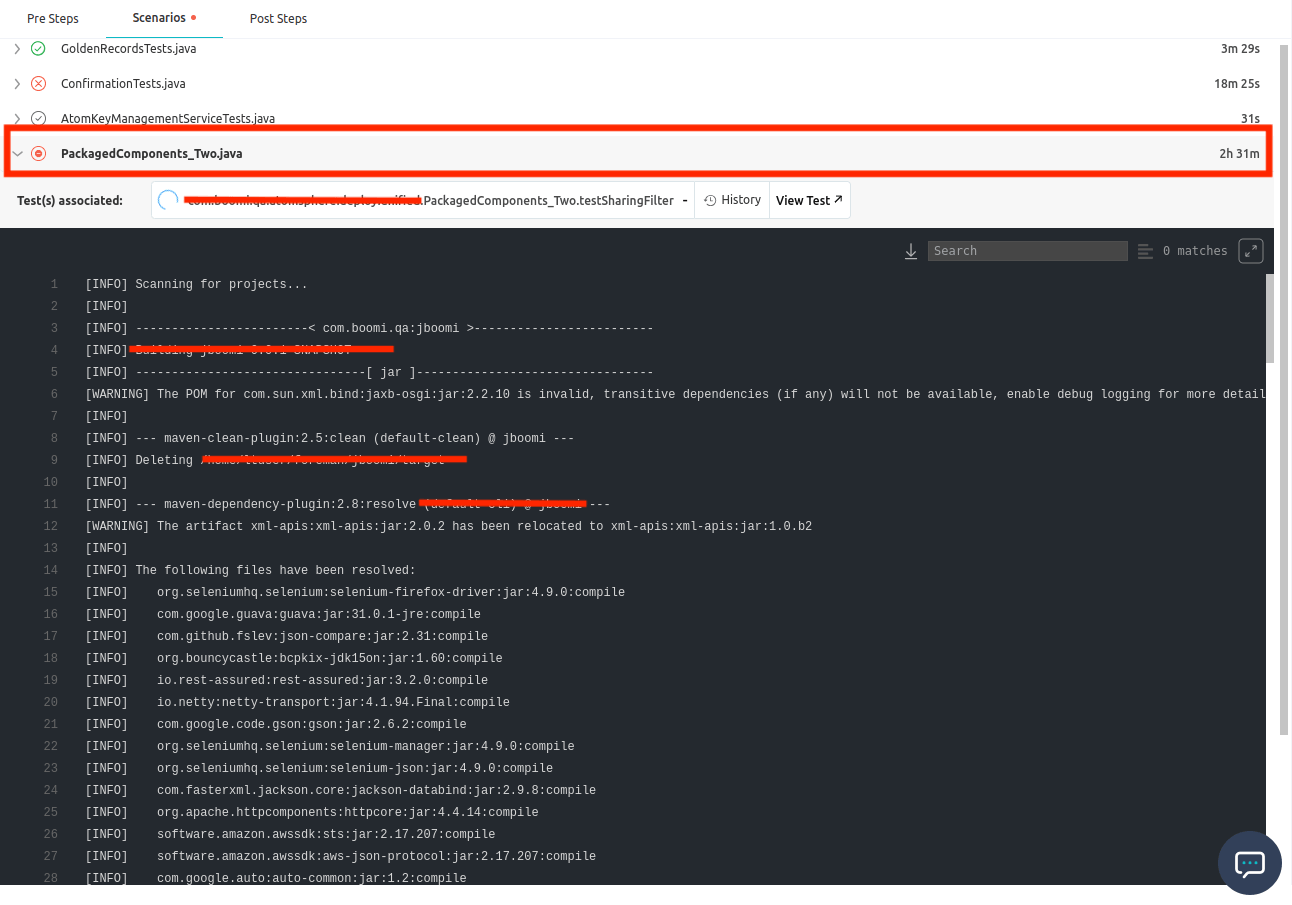
Test Idle Timeout
When the test encounters an idle timeout, it indicates that commands are not being executed for an extended period of time. Additionally, the quit() command fails to execute, causing the test to get stuck.
You can see the test has been being executed for a very long time, which is not ideal behavior.

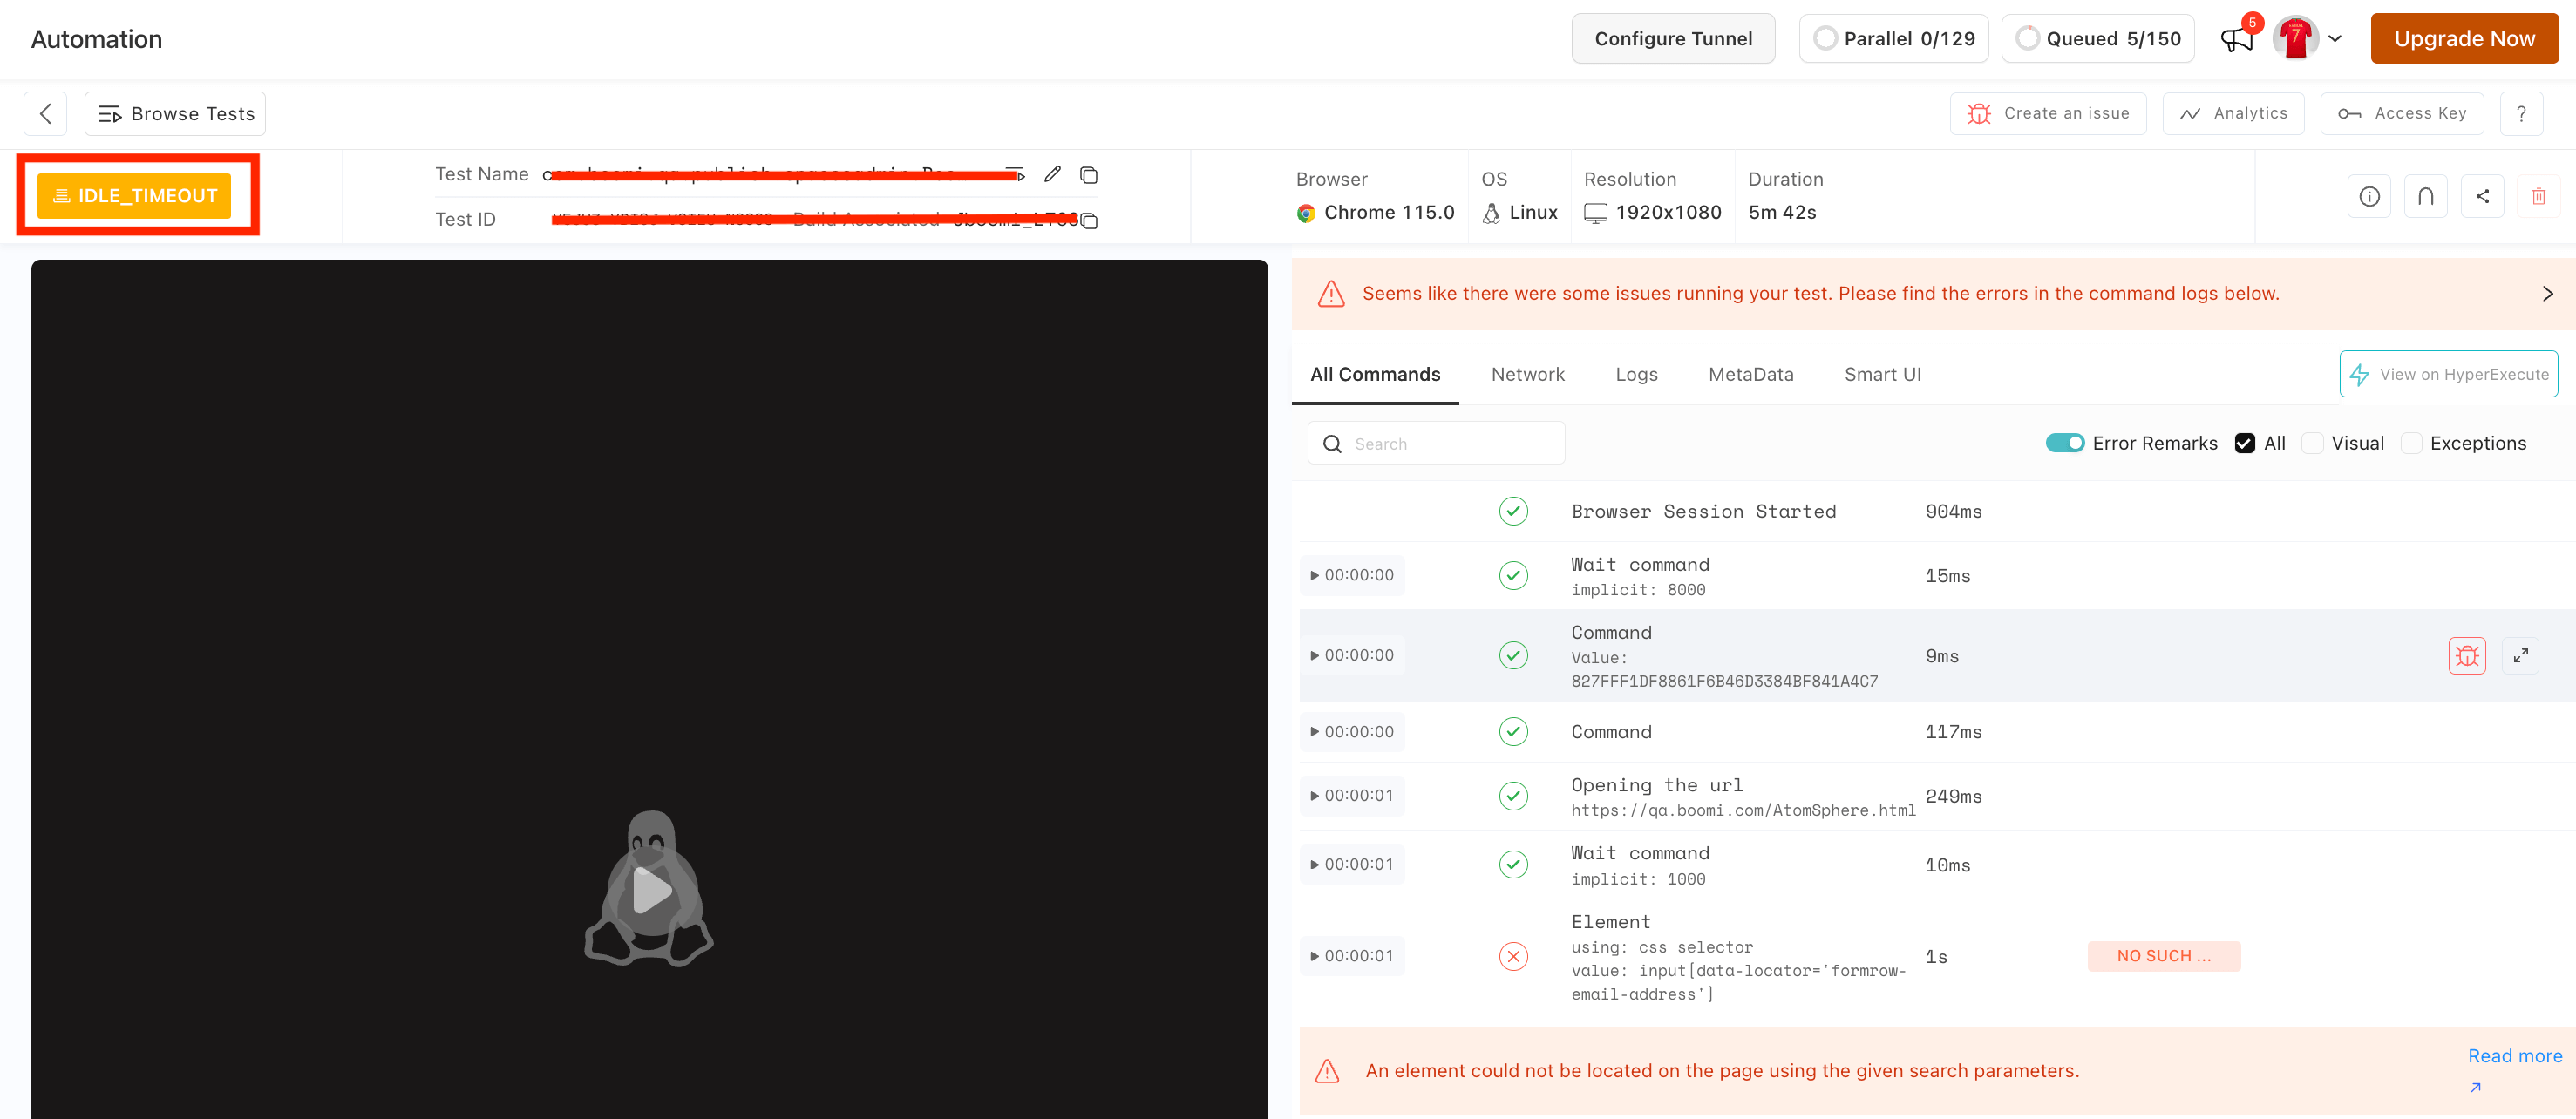
And when you click on the View Test button, you can see that the status of your test is Idle_Timeout.
Measures to Take:
-
Identify Task and Stage: Determine the specific task and stage associated with the idle timeout. This information can be obtained from test execution reports or monitoring tools.
-
Verify Command Execution Count: Confirm the number of commands executed before the idle timeout occurs.
-
Check quit() Command Execution: Ensure that the quit() command is properly included in the test code and that there are no errors preventing its execution.
-
Local Machine Testing: Replicate the test execution on the user's local machine to rule out environment-specific factors.
-
Analyze Codebase: Examine the codebase for potential issues between the last successfully executed command and the very last command. This may involve syntax errors, logic flaws, or unexpected interactions with external systems.
Remedy:
-
Debug Codebase: Insert logging statements in the test code after the last successfully executed command. This will provide insights into the execution flow and identify any unexpected behavior or errors that could be causing the idle timeout.
-
Review Code Logic: Carefully review the code logic between the failed commands to ensure that commands are executed in the intended sequence and that there are no infinite loops or unintended pauses.
-
Check External Interactions: Verify that any interactions with external systems, such as APIs or third-party services, are functioning properly and not causing delays or disruptions in test execution.
-
Optimize Resource Usage: Ensure that the test environment has sufficient resources, such as CPU, memory, and network bandwidth, to handle the test workload. Resource constraints can lead to performance bottlenecks and idle timeouts.
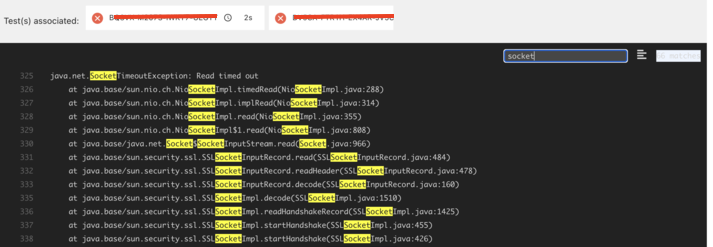
API Timeout
When the test encounters an API timeout, indicating that the API call did not receive a response within the specified timeout period, follow these measures to diagnose and address the issue.
-
Identify Task and Test: Determine the specific task and test associated with the API timeout. This information can be obtained from test execution reports or monitoring tools.
-
Review Martian Logs: Analyze the Martian logs for relevant entries related to the API call in question. Martian logs provide timestamps, request details, and response bodies, if available.
-
Verify Response Presence: Check if the Martian logs contain a response body for the API call. If no response is present, the API is likely timed out on the server side.
-
Local Machine Testing: Replicate the test execution on the user's local machine to rule out environment-specific factors.
-
Server-Side Logging: If the API consistently fails to respond within the specified timeout, both locally and in the production environment, investigate server-side logging to identify potential issues on the server.
After identifying the issue, follow these steps to resolve the situation:
Step 1: Analyze Server-Side Logs for error messages, warnings, or exceptions related to the API call. This can pinpoint the root cause of the timeout and guide further troubleshooting.
Step 2: If the test code does not explicitly define connection and socket timeouts for the API call, incorporate these timeouts to ensure that the API call doesn't hang indefinitely.
Step 3: Evaluate the appropriateness of the timeout values specified in the test code and on the server-side. Adjust the timeouts if necessary to accommodate the expected response time of the API.
Step 4: Consider optimizing the API call itself to improve its performance and reduce the likelihood of timeouts. This may involve caching mechanisms, load balancing, or alternative API endpoints.
Here's an example of how you can set connection and socket timeouts:
public static void main(String[] args) {

        // Set connection and socket timeouts
        int connectionTimeout = 5000; // in milliseconds
        int socketTimeout = 5000; // in milliseconds

        RestAssured.config = RestAssuredConfig.config().socketConfig(
                SocketConfig.socketConfig().setConnectTimeout(connectionTimeout)
                        .setReadTimeout(socketTimeout));

        // Your Rest Assured request code here
        // For example:
        RestAssured.given()
                .baseUri("https://api.example.com")
                .basePath("/some/path")
                .get()
                .then()
                .statusCode(200);

    }
Make sure to include the necessary dependencies in your project. If you are using Maven, you can add the following dependencies to your pom.xml file:
<dependencies>
    <dependency>
        <groupId>io.rest-assured</groupId>
        <artifactId>rest-assured</artifactId>
        <version>4.5.0</version> <!-- Use the latest version available -->
        <scope>test</scope>
    </dependency>
</dependencies>
