Debugging in Selenium Using Telemetry Logs
TestMu AI Automation allows you to perform parallel test execution through a standalone mode that connects to the Selenium server, where each test can have multiple requests.
To trace each request, you can use Selenium 4 and OpenTelemetry integration to achieve greater visibility into request tracing and event logs. Tracing enables the monitoring of a request's life cycle and stores essential information about the request's critical operations. You can use this information to identify issues and optimize the performance of your web applications.
Managing several requests, tracing logs, and troubleshooting request failures in a distributed environment can be challenging. In such instances, you can integrate Telemetry logs with Jaeger - a distributed tracing system - to quickly visualize and query traces.
Supported Operating Systems
Telemetry logs are available on these operating systems.
- Windows 11
- Windows 10
- macOS Ventura
- macOS Catalina
- macOS Mojave
Enabling Telemetry Logs
Pass the seTelemetryLogs and selenium_version capabilities to activate telemetry logging.
TestMu AI Automation supports Telemetry logs on Selenium versions above 4.2.0.
By default, Telemetry logs are disabled for Selenium automation on TestMu AI. To enable them in your test sessions:
- Pass the
seTelemetryLogscapability in your test scripts and set it to true.
caps.setCapability("seTelemetryLogs", true);
- Pass the
selenium_versioncapability in your test scripts and set it to4.2.0.
caps.setCapability("selenium_version", "4.2.0");
Visualizing Telemetry Logs Using Jaeger
Integrate Jaeger to visualize request traces from your test sessions.
Jaeger is an open-source, end-to-end distributed tracing system to monitor and troubleshoot distributed systems. Using Jaeger, you can visualize the request traces of your tests run on TestMu AI.
Here are the steps to integrate Jaeger with your test suites:
-
Download Jaeger from its official website.
-
Extract the compressed (.tar.gz or .zip) Jaeger file to the directory where your test script resides. You will now have several Jaeger files like
jaeger-query,jaeger-collector, etc., in your test script directory. -
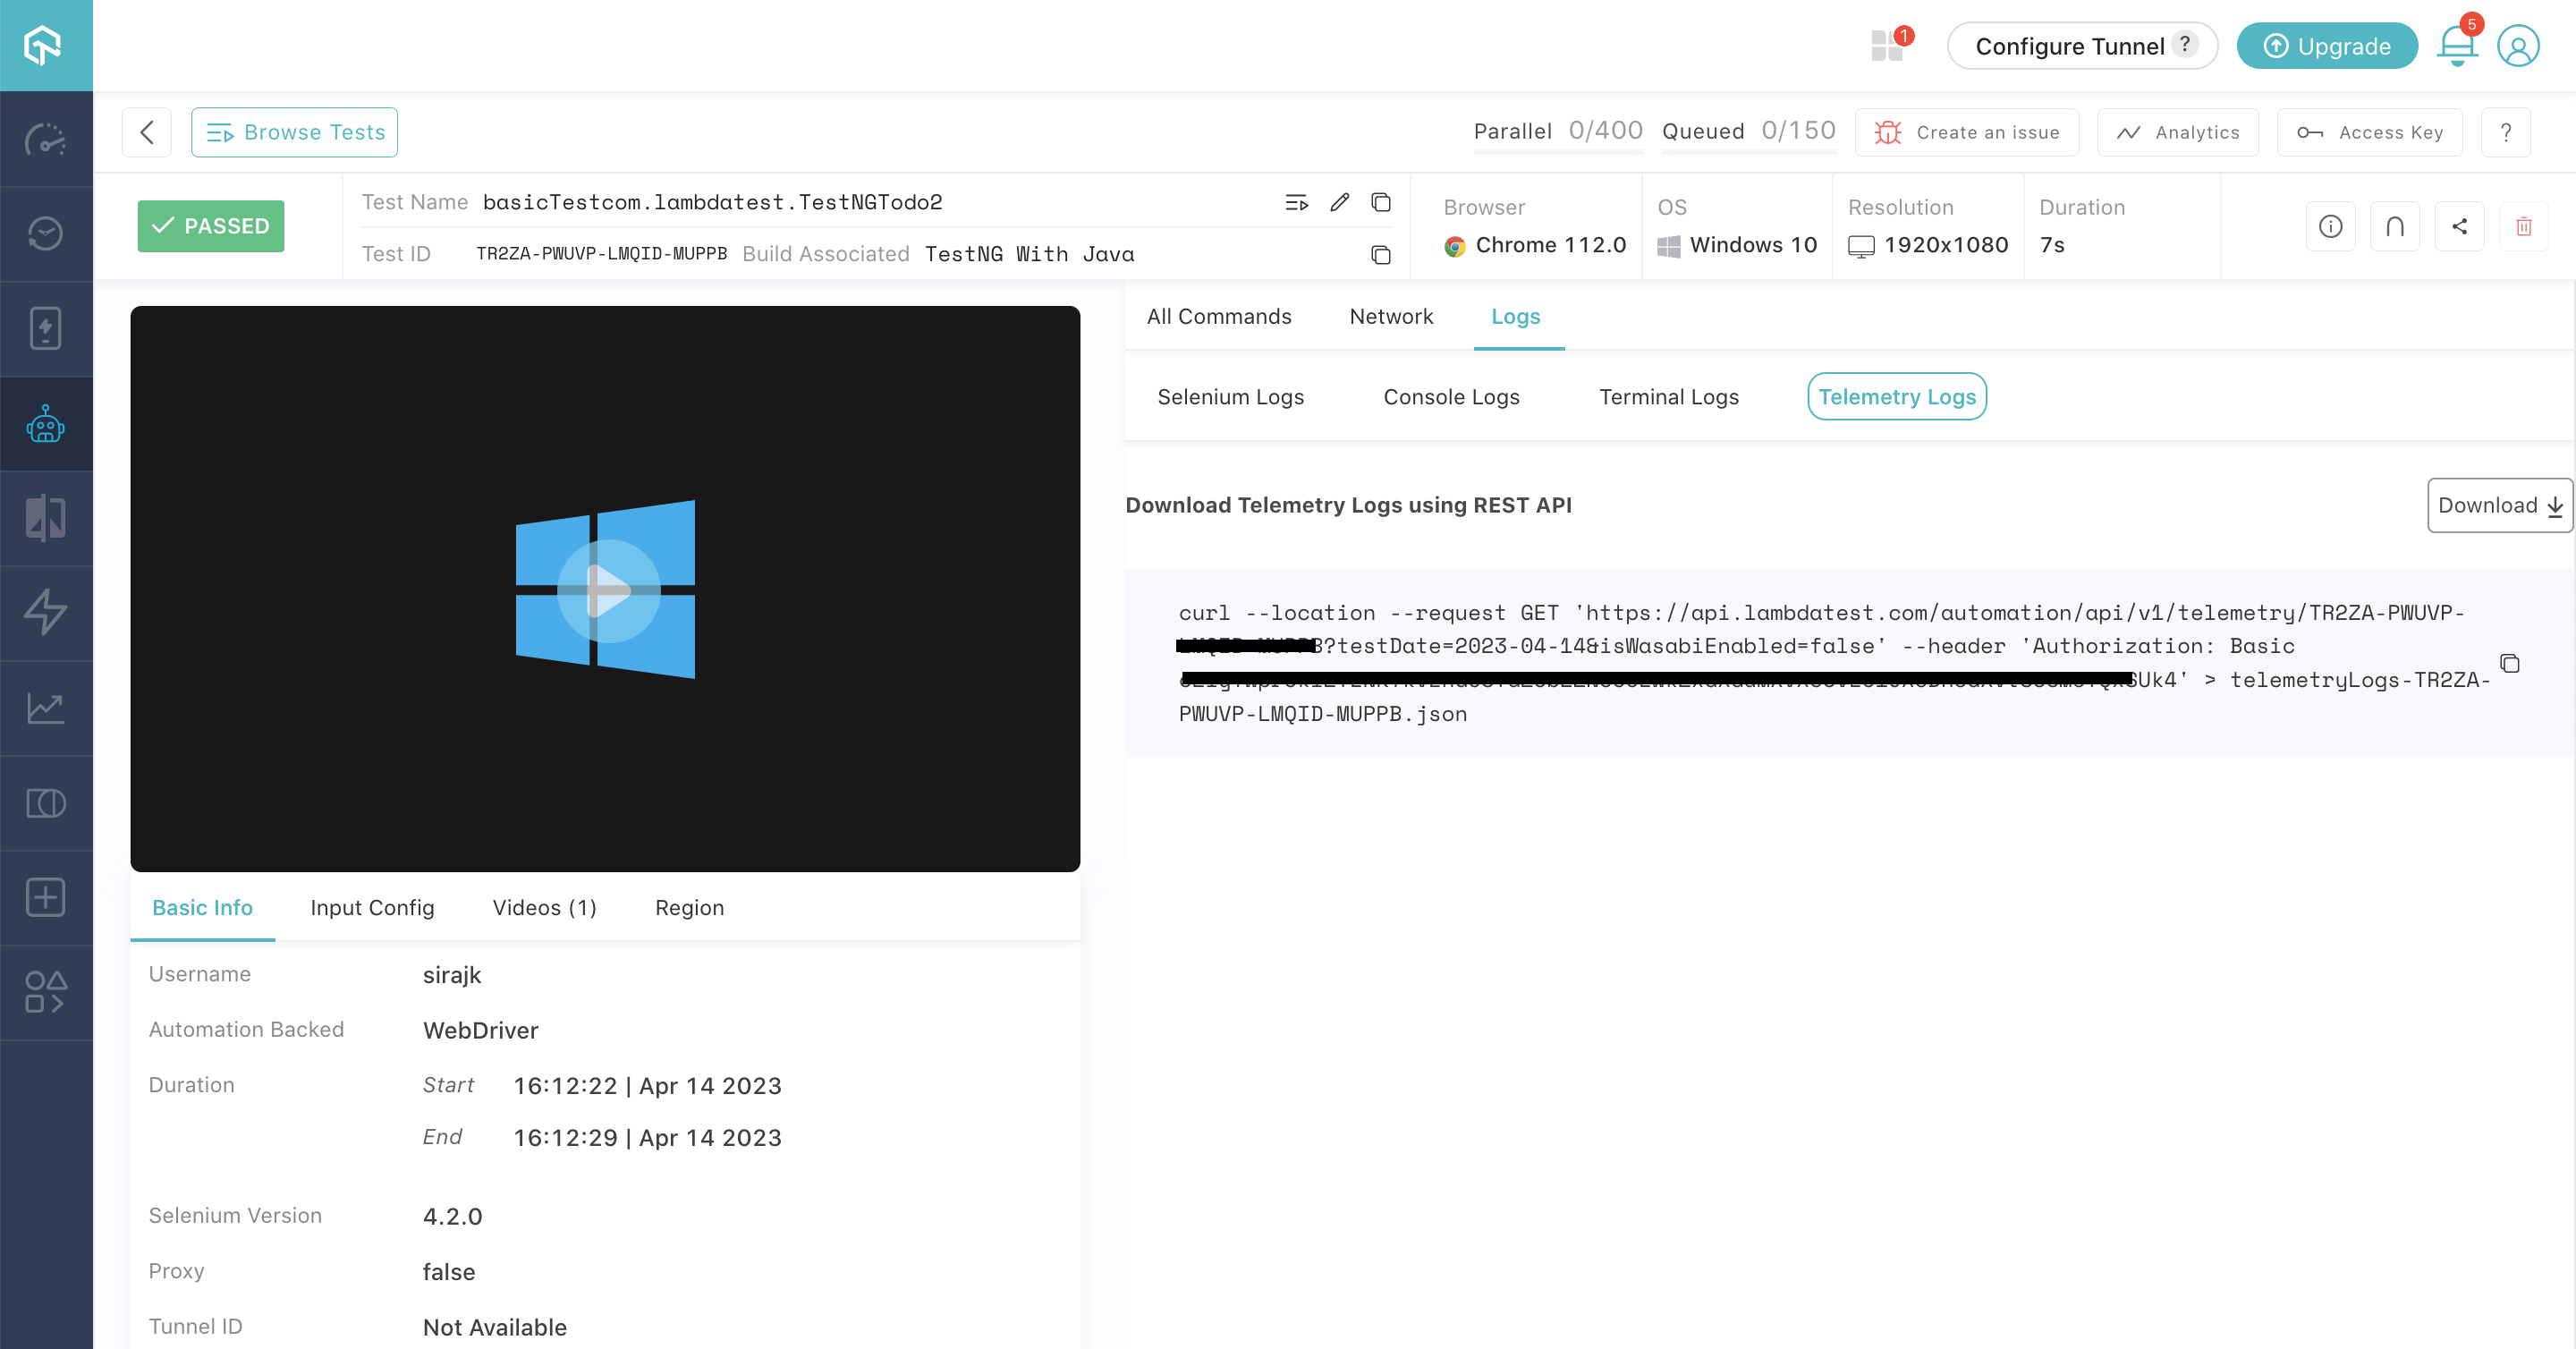
Download Telemetry logs of your test session from the Telemetry Logs tab of your TestMu AI Automation Dashboard.
- Start the Jaeger UI to visualize the Telemetry logs by running the below command.
jaeger-all-in-one
- Visit
http://localhost:16686/searchand click the Upload tab to upload the downloaded Telemetry logs from the TestMu AI Automation Dashboard.
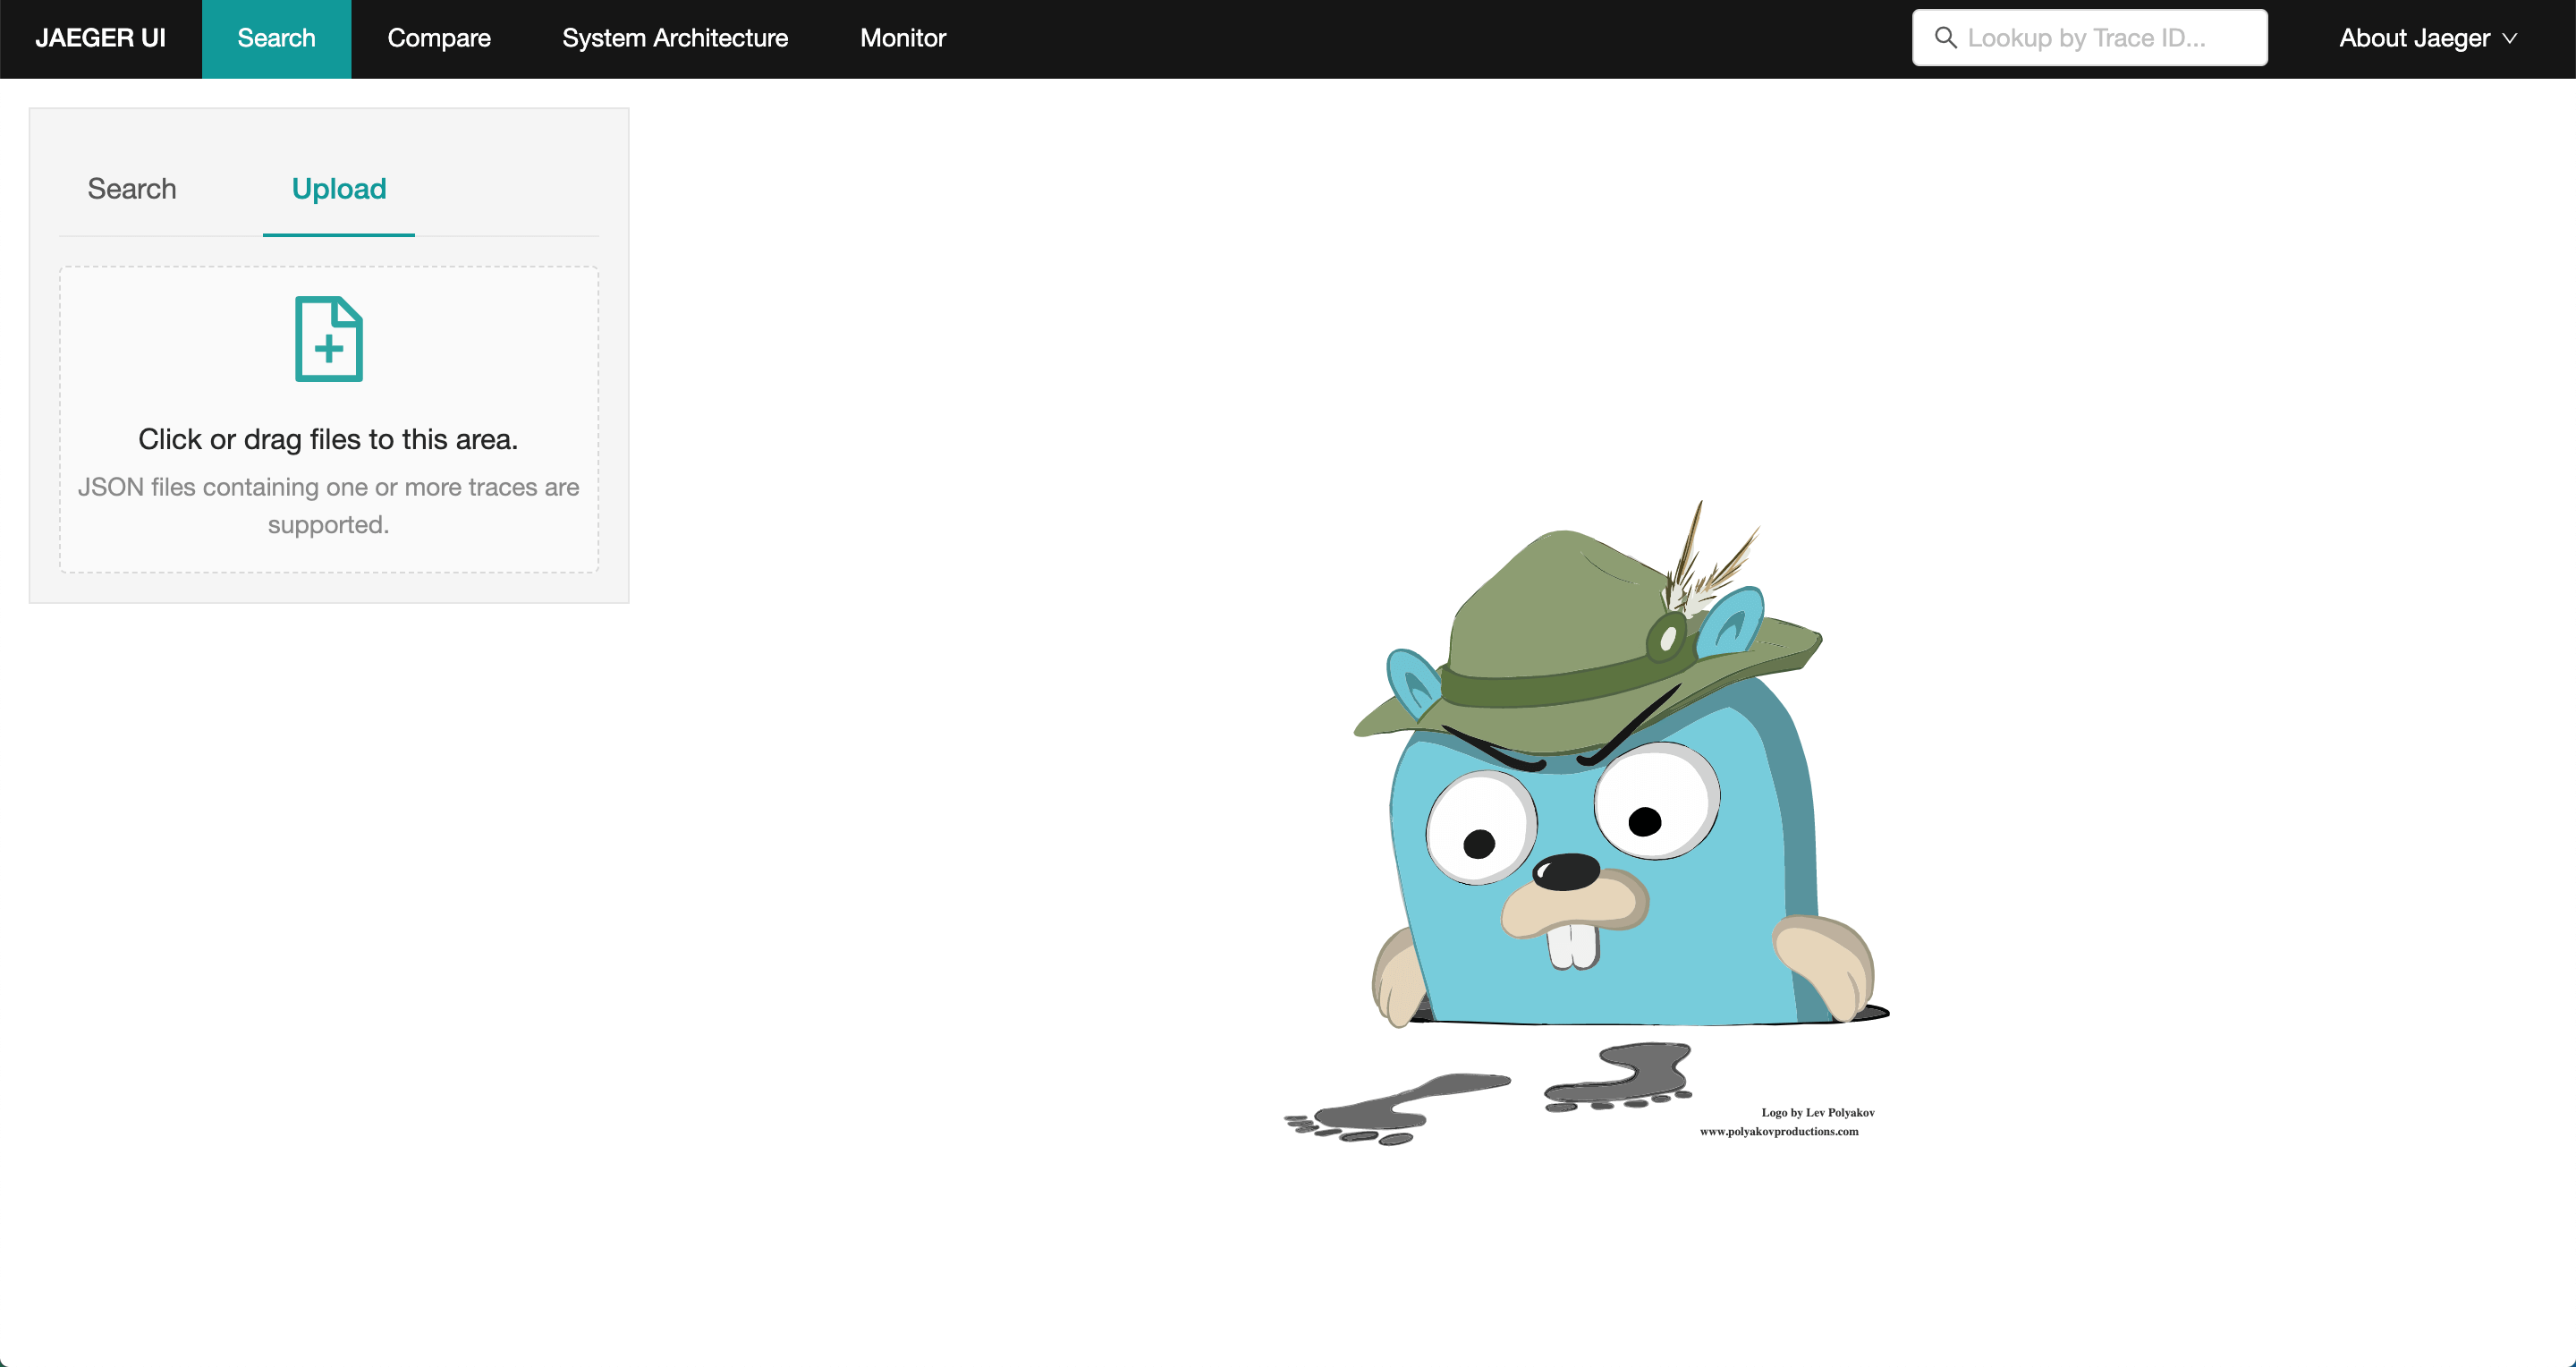
After uploading, you can view the request traces in the Jaeger UI for your TestMu AI test sessions.
