Guided Walkthrough of HyperExecute
This page gives you a guided walkthrough of all the things on the HyperExecute Dashboard and how you can get the most out of the platform once you have successfully run your first sample Job. The dashboard is built to be WCAG-compliant, ensuring an accessible experience for all users.
Jobs Page
All the tests on HyperExecute get executed as a Job. All the Jobs can be found on our Jobs page. Each Job has a Status, a unique Job Number, a set of Labels, info on number of Tasks executed as part of that Job, and a Summary section followed by the details of the Job Duration and who initiated the Job.

Learn more about Secrets Management, getting User Name and Access Key from our Knowledge Base
Top Panel
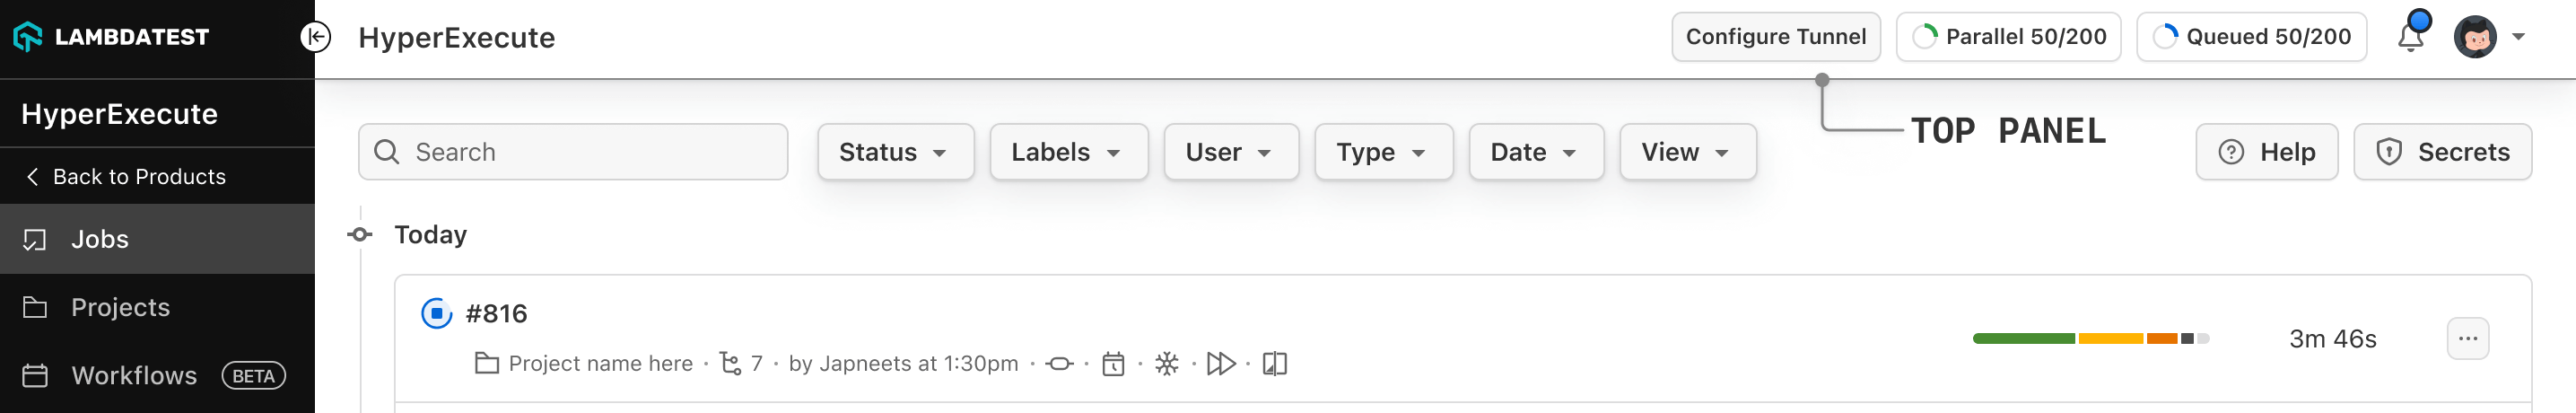
The top panel contains multiple items:
- Parallel: It reflects the number of tasks running parallelly
- Queued: It shows number of the tasks queued and are not yet started.
- Configure Tunnel: Tunnel is used to ensure the security of your data for private websites.
- Announcements: The latest announcements and updates can be found here.
- Settings: Manage all of your account and organisation details in this section.
- Upgrade: You can upgrade your TestMu AI subscription from here.
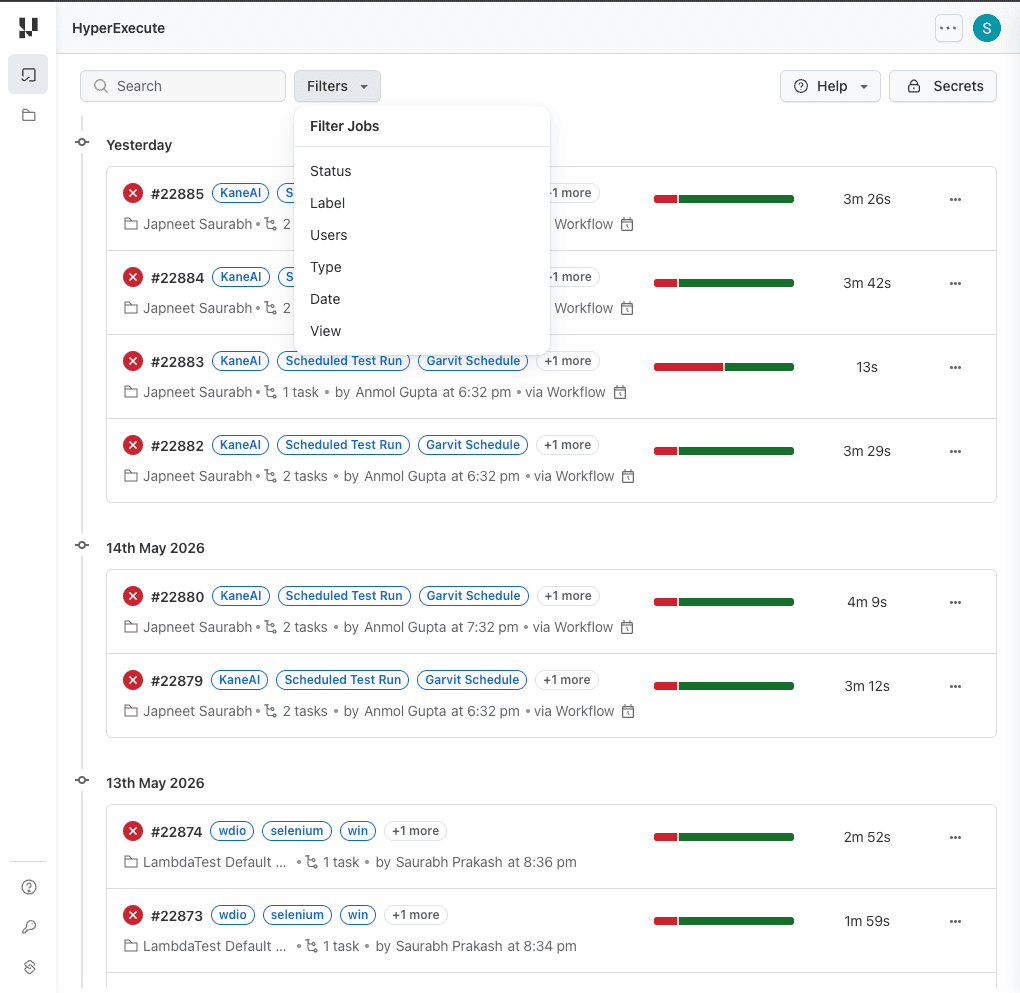
Filters
The Jobs page provides a filter bar to narrow down the job list based on the following criteria:
- Status — Filter jobs by their current status (Running, Completed, Failed, Aborted, etc.)
- Label — Filter by job labels defined in your YAML configuration.
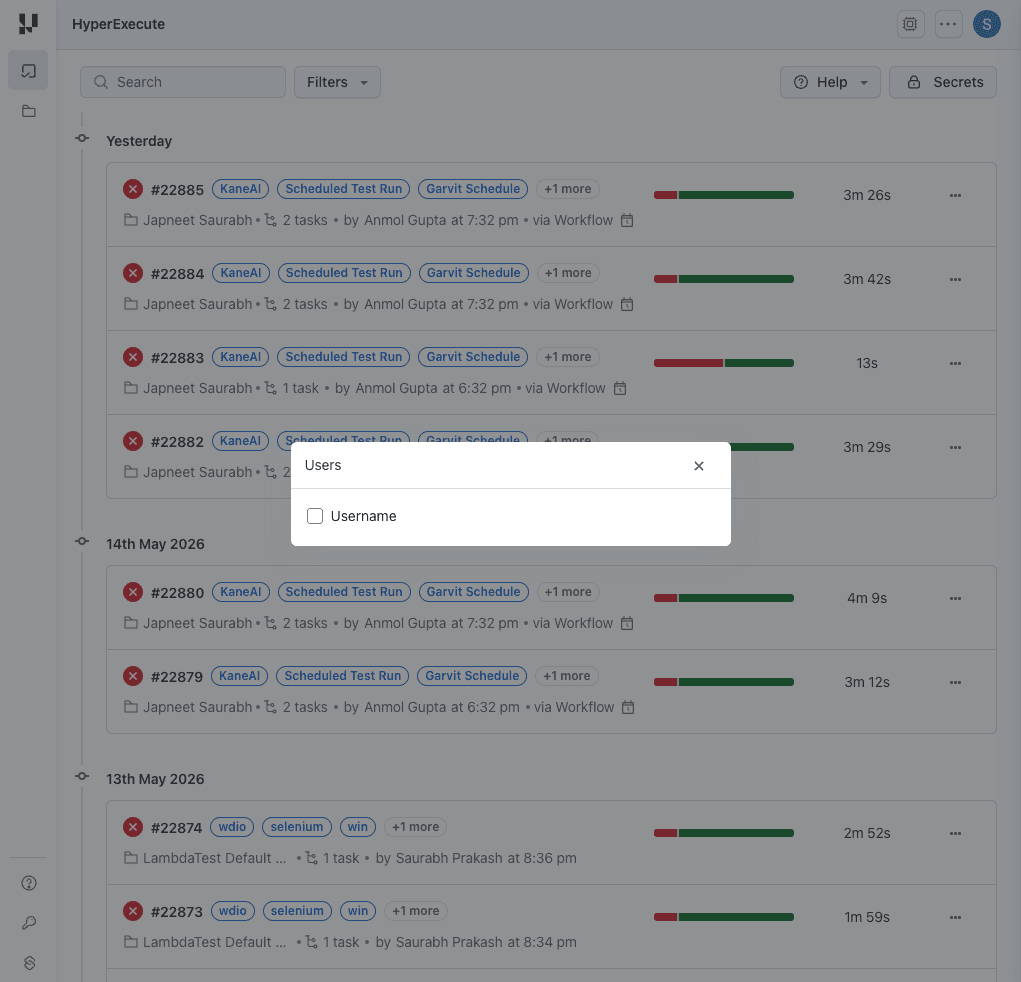
- Users — Filter jobs by the user who triggered them. This is useful when multiple team members share the same organization and you want to view only your jobs.
- Type — Filter by job type (Selenium, Playwright, Cypress, etc.)
- Date — Filter jobs by date range.
- View — Toggle between different view options (e.g., archived jobs).
To filter jobs for a specific user, click on the Users filter and select the desired user from the dropdown list.
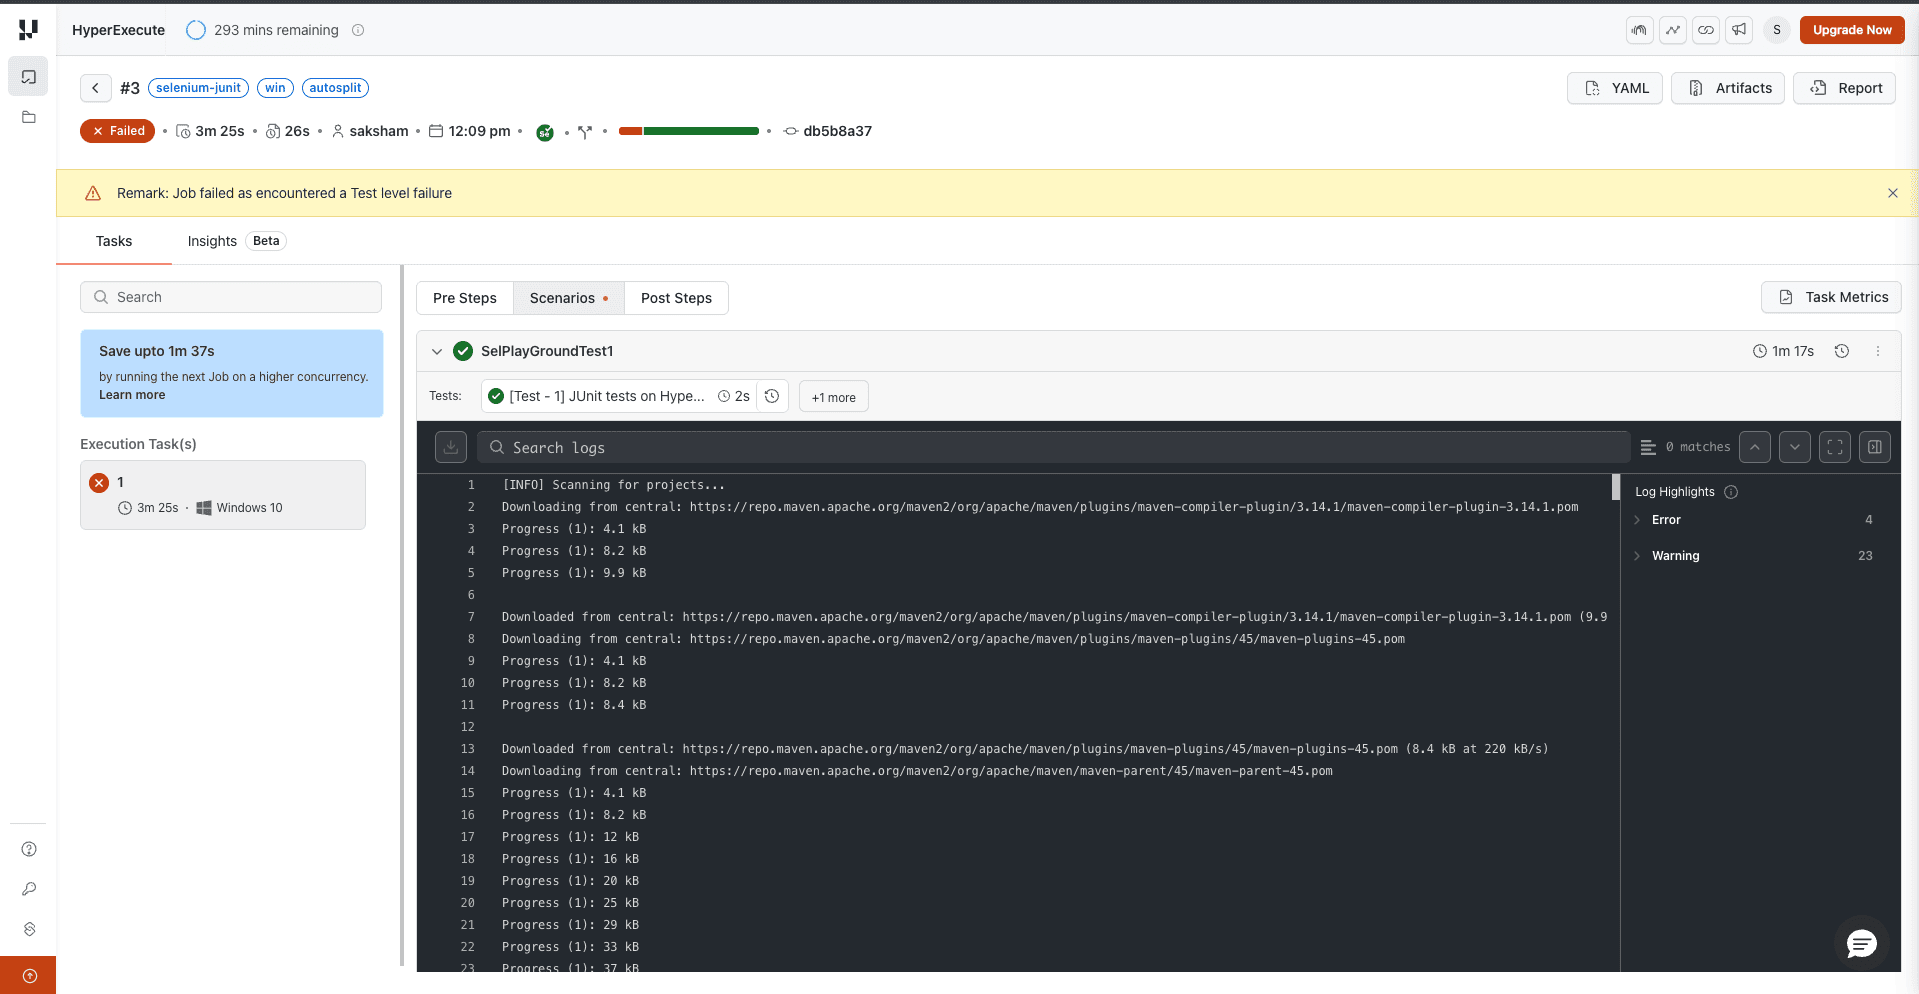
Job Details Page
You can click on a particular Job to navigate to the Job Details Page.
- On the top you can see all the Job related details like Job Number, Summary etc.
- Job Number - The Number of your Job.
- Summary - A brief breakdown of all of your tests on the basis of their status.
- Status - The status of your Job.
- Created At - The date of the creation of the Job.
- User - Your user details who triggered the Job.
- Job Duration: The time it took to run your entire Job.
- Test Duration: The time it took to run your tests.
- Type: The job type (Selenium, Playwright, etc) along with the mode of the job (AutoSplit or Matrix).
- Git Commit ID - For jobs triggered via Workflows or sourcePayload, the git commit hash is displayed in the job metadata, providing traceability to the specific code changes tested.
- Artifacts: Can be used to configure and generate custom reports and artifacts.
- Report: A detailed report for your test execution for the Job.
- The left side shows all the Tasks (Just-in-time testing environments) that were a part of the Job.
- Each Task has 3 types of Stages : Pre stages, Scenario stages, Post stages.
Test Details
You can access a much more detailed section for your test cases on the Automation dashboard by clicking on the Test button.

It provides you with all the necessary data points that you need for your test.
Basic Summary
You can see the details of your test on the panel on the top of the screen. It contains several details like the browser, the test status, the test name, and more.
- Test Status: The status of your test. If the test has passed, the status will be passed.
- Test Name: The name of your test. You can rename the test, copy the name and see all the tests in the build.
- Test ID: The test ID of your test. You can copy the test ID by clicking on the Copy button.
- Browser: The browser on which your tests are run.
- OS: The Operating System on which your tests are run.
- Resolution: The resolution of the screen.
- Duration: The amount of time it took for your test to run.
- Test Meta Data: You can view the test meta data by clicking on the info icon.
- Tunnel Information: Tells whether you have used a tunnel to run your tests or not.
- Share: You can share the details of this test by clicking on the Share icon.
- Delete: You can delete the test entirely by clicking on the Delete icon.
Videos and Screenshots
HyperExecute provides you with tools like videos and screenshots of your tests to give you a clear picture of what goes on in the background.
Commands and Logs
You can access the commands involved in the test, and the logs on the right hand side on this Dashboard.
- All Commands: Each command that is run as a part of your test case is shown here. Each command also contains its own parameters, that can be accessed by hovering on the command and clicking on View Parameters.
- Network: Access the network logs while your tests were getting executed on the Network tab.
- Logs: View all kinds of logs at one place. You can toggle between the Console Logs, Terminal Logs and the Test Framework Logs.

Note: You can download the logs by clicking on the Download button on the top right-hand corner of the logs tab.
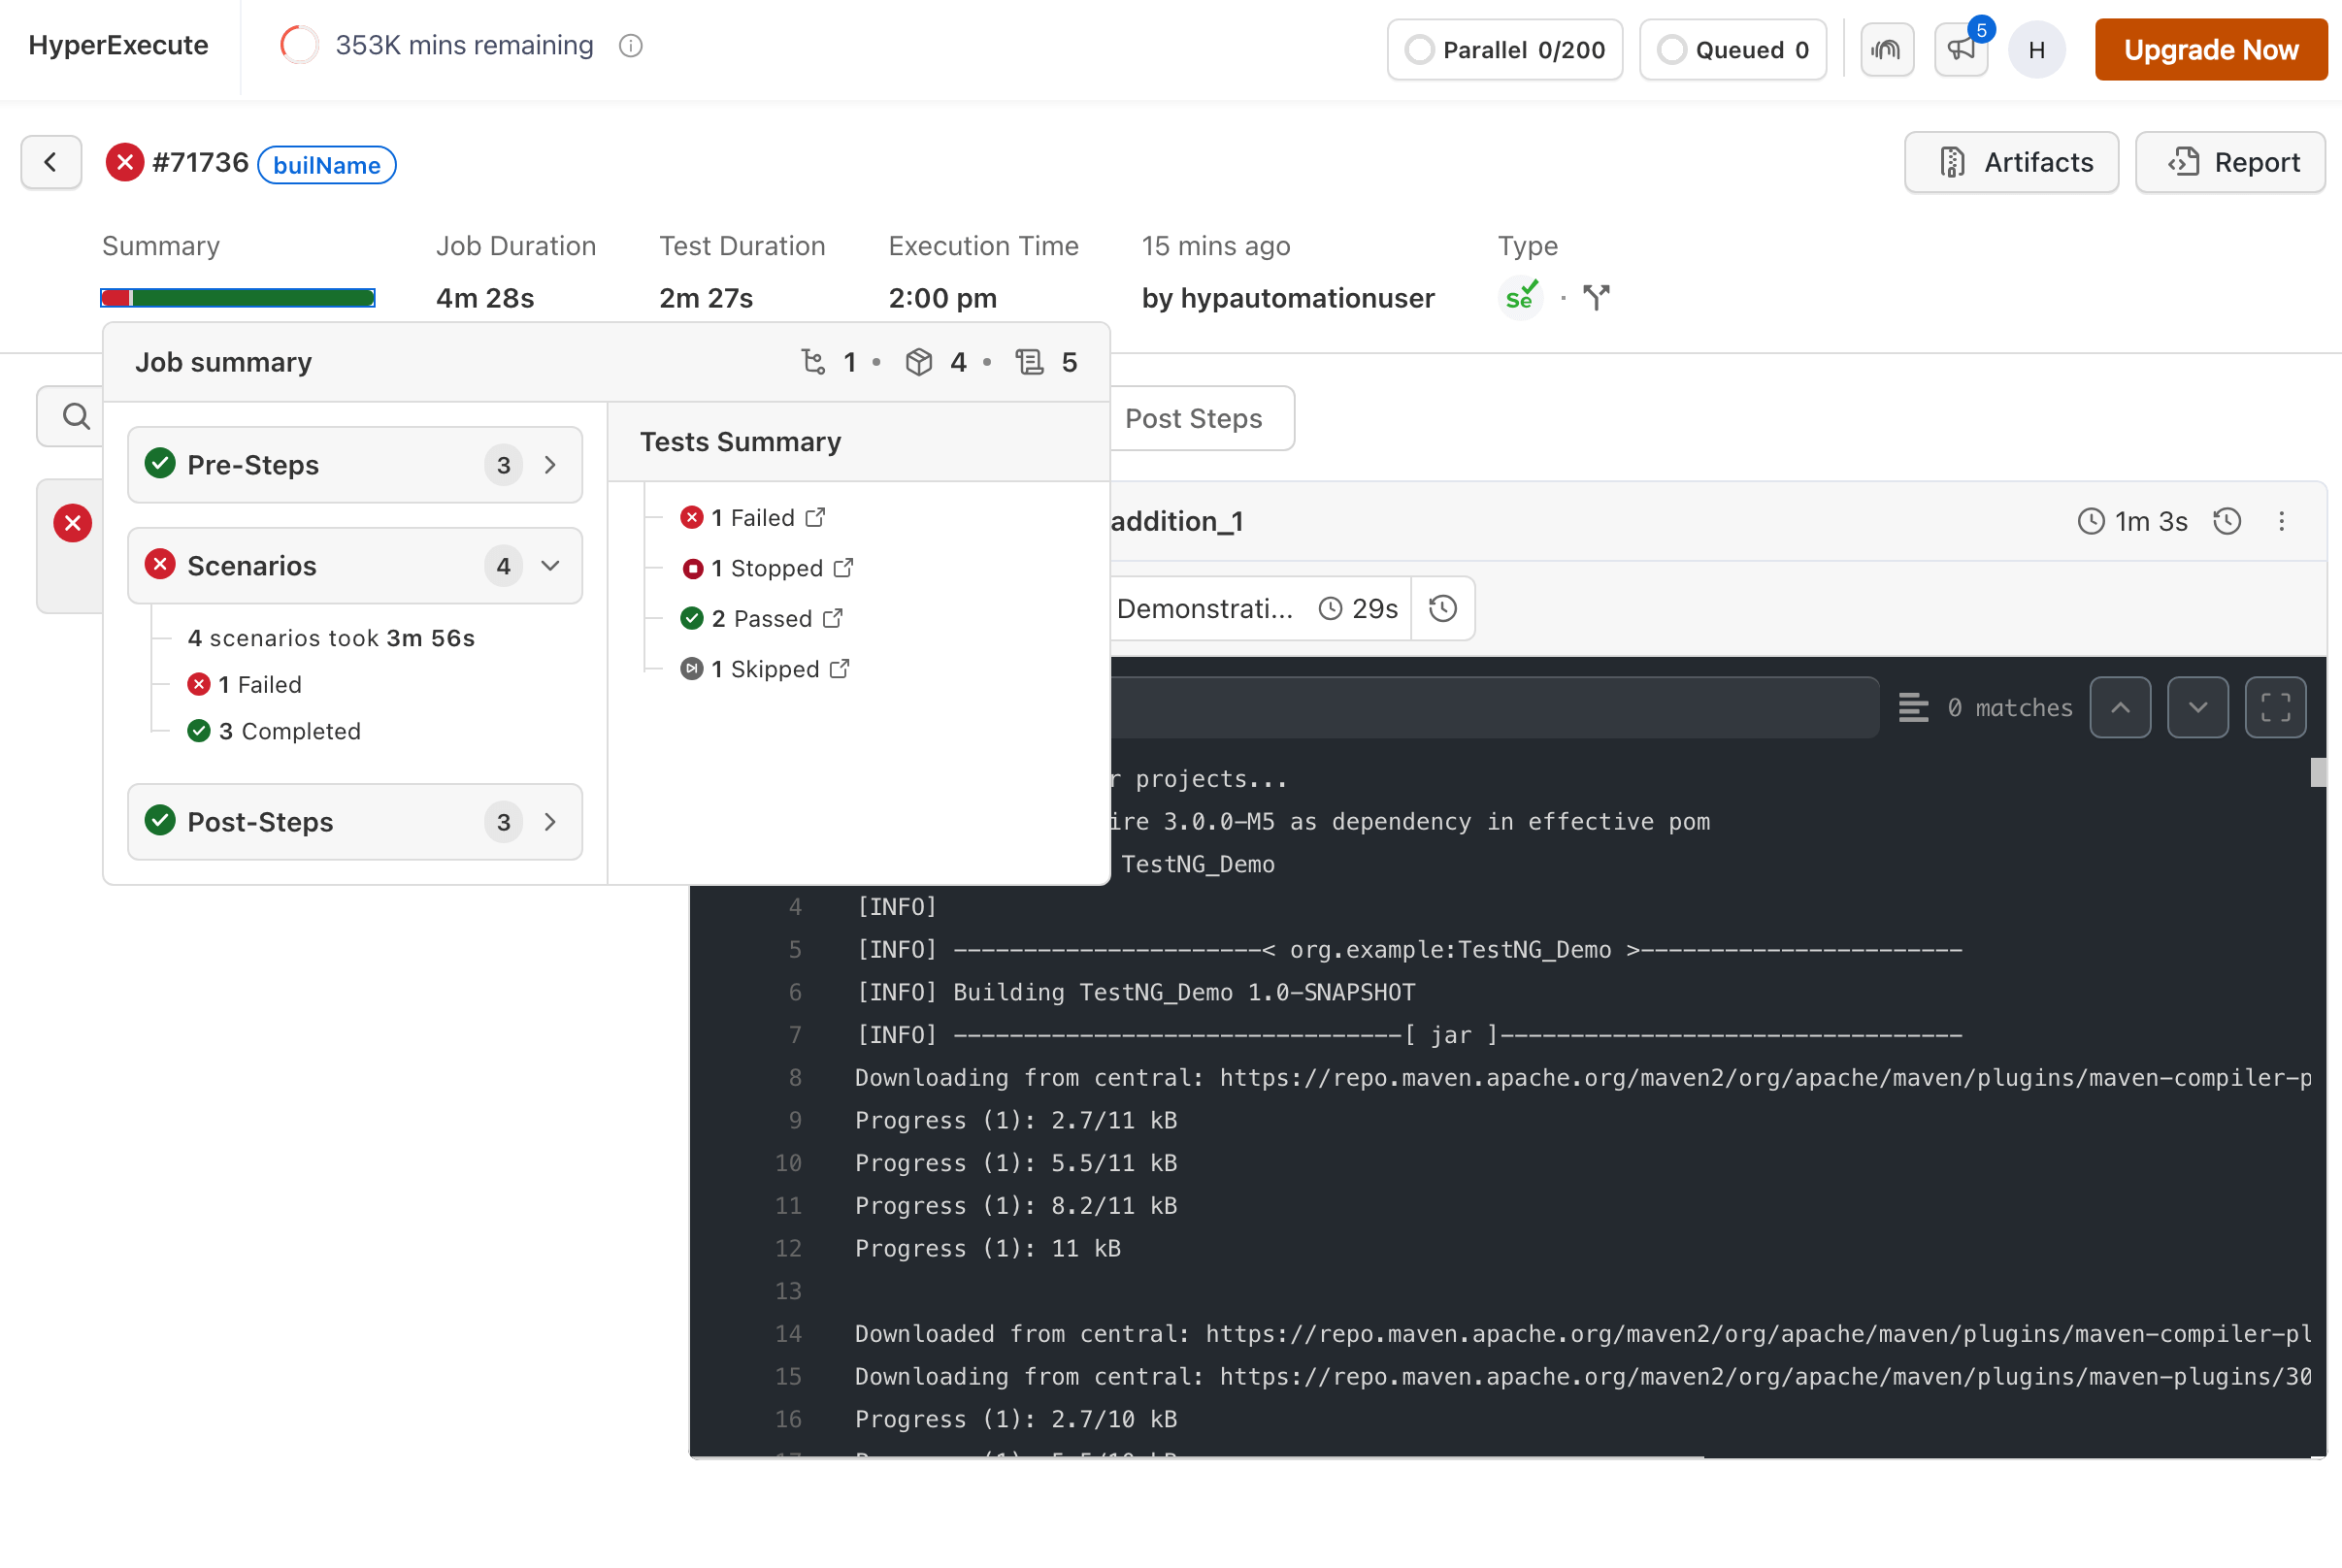
Test Summary Hyperlink
This introduces clickable links within your test summary. When you click on these hyperlinks, it dynamically redirects you to the automation dashboard, providing immediate access to detailed test information corresponding to the specific test status clicked.
Additionally, upon redirection, the automation dashboard opens the relevant tab that aligns with the selected test status, streamlining your experience.
How to Activate Test Summary Hyperlinks
-
Update your Org Configuration :
-
Frontend Configuration :
For frontend activation, please contact us via our 24×7 chat support or you can also drop a mail to support@testmuai.com.
-
Backend Configuration :
Update your designated HyperExecute YAML file with
buildConfigconfiguration to activate the "Test Summary Hyperlink" feature. This configuration allows you to define specific parameters that govern the behavior of the hyperlinks based on the test summary status.
