Unleash the Power of JMeter Performance Testing with HyperExecute
Prerequisites
- Setup the JMeter Test Plan using Apache JMeter GUI. After setting up a Test Plan, now you need to associate your test cases and execute it as well via HyperExecute.
You can use your own project to configure and test it. For demo purposes, we are using the sample repository.
By default, HyperExecute supports standard Thread Group but you can use other custom thread groups as well.
Download or Clone the code sample for the JMeter Performance Testing from the TestMu AI GitHub repository to run the tests on the HyperExecute.
 View on GitHub
Step 1: Setup your JMeter Project
- Go to the HyperExecute Project's Dashboard and click on the New Project button.
- Browse and Upload your JMeter test files to create a new performance test project.
- Click on the Save button
Step 2: Execute your Test Plans
- Select your desired .jmx file and click on the Run button.
- Configure the following parameters to perform the testing and click on the Continue button
- Total Users : This indicates the number of users you intend to test for.
- Duration (min) : This specifies the desired duration for the test.
- Ramp-up Time (min) : This specifies the amount of time it should take to reach the peak test load.
- Total Load Distribution : Configure the regions in which you want to distribute the load testing as per the % of the users.
- Split CSV : Enables splitting the input data from a CSV file among different threads or regions. This ensures organized data utilization across parallel executions.
- Job Labels : Add meaningful labels or tags to test executions for better identification and traceability in logs and reports.
- Machine count : Specify the number of machines (or nodes) to use for parallel test execution. This parameter is essential for scaling test workloads or reducing execution time.
- Java Version : Choose the Java runtime to execute the tests with. Java 11 is the default; Java 25 is also available.
Supported Regions : HyperExecute supports the following regions for performance testing
- West US 2 (Moses Lake, Washington)
- East US (Richmond, Virginia) (default)
- Central India (Pune, Maharashtra)
- Southeast Asia (Singapore)
- Brazil South (São Paulo State, Brazil)
- Mexico Central (Querétaro State, Mexico)
User Properties
Override selected JMeter properties for this run. The following user properties are currently configurable:
-
jmeter.save.saveservice.subresults— Whether sub-results (for example, sub-samples generated within a transaction or by HTTP redirects) are written to the results file. Set tofalseto reduce result file size. -
httpclient.socket.https.cps— Characters per second cap on HTTPS downloads for the HttpClient sampler. Use it to simulate low-bandwidth conditions;0means unlimited. -
Click on the Run Test button.
Step 3: Analyze Your Project Performance
- Toggle to the Jobs section.
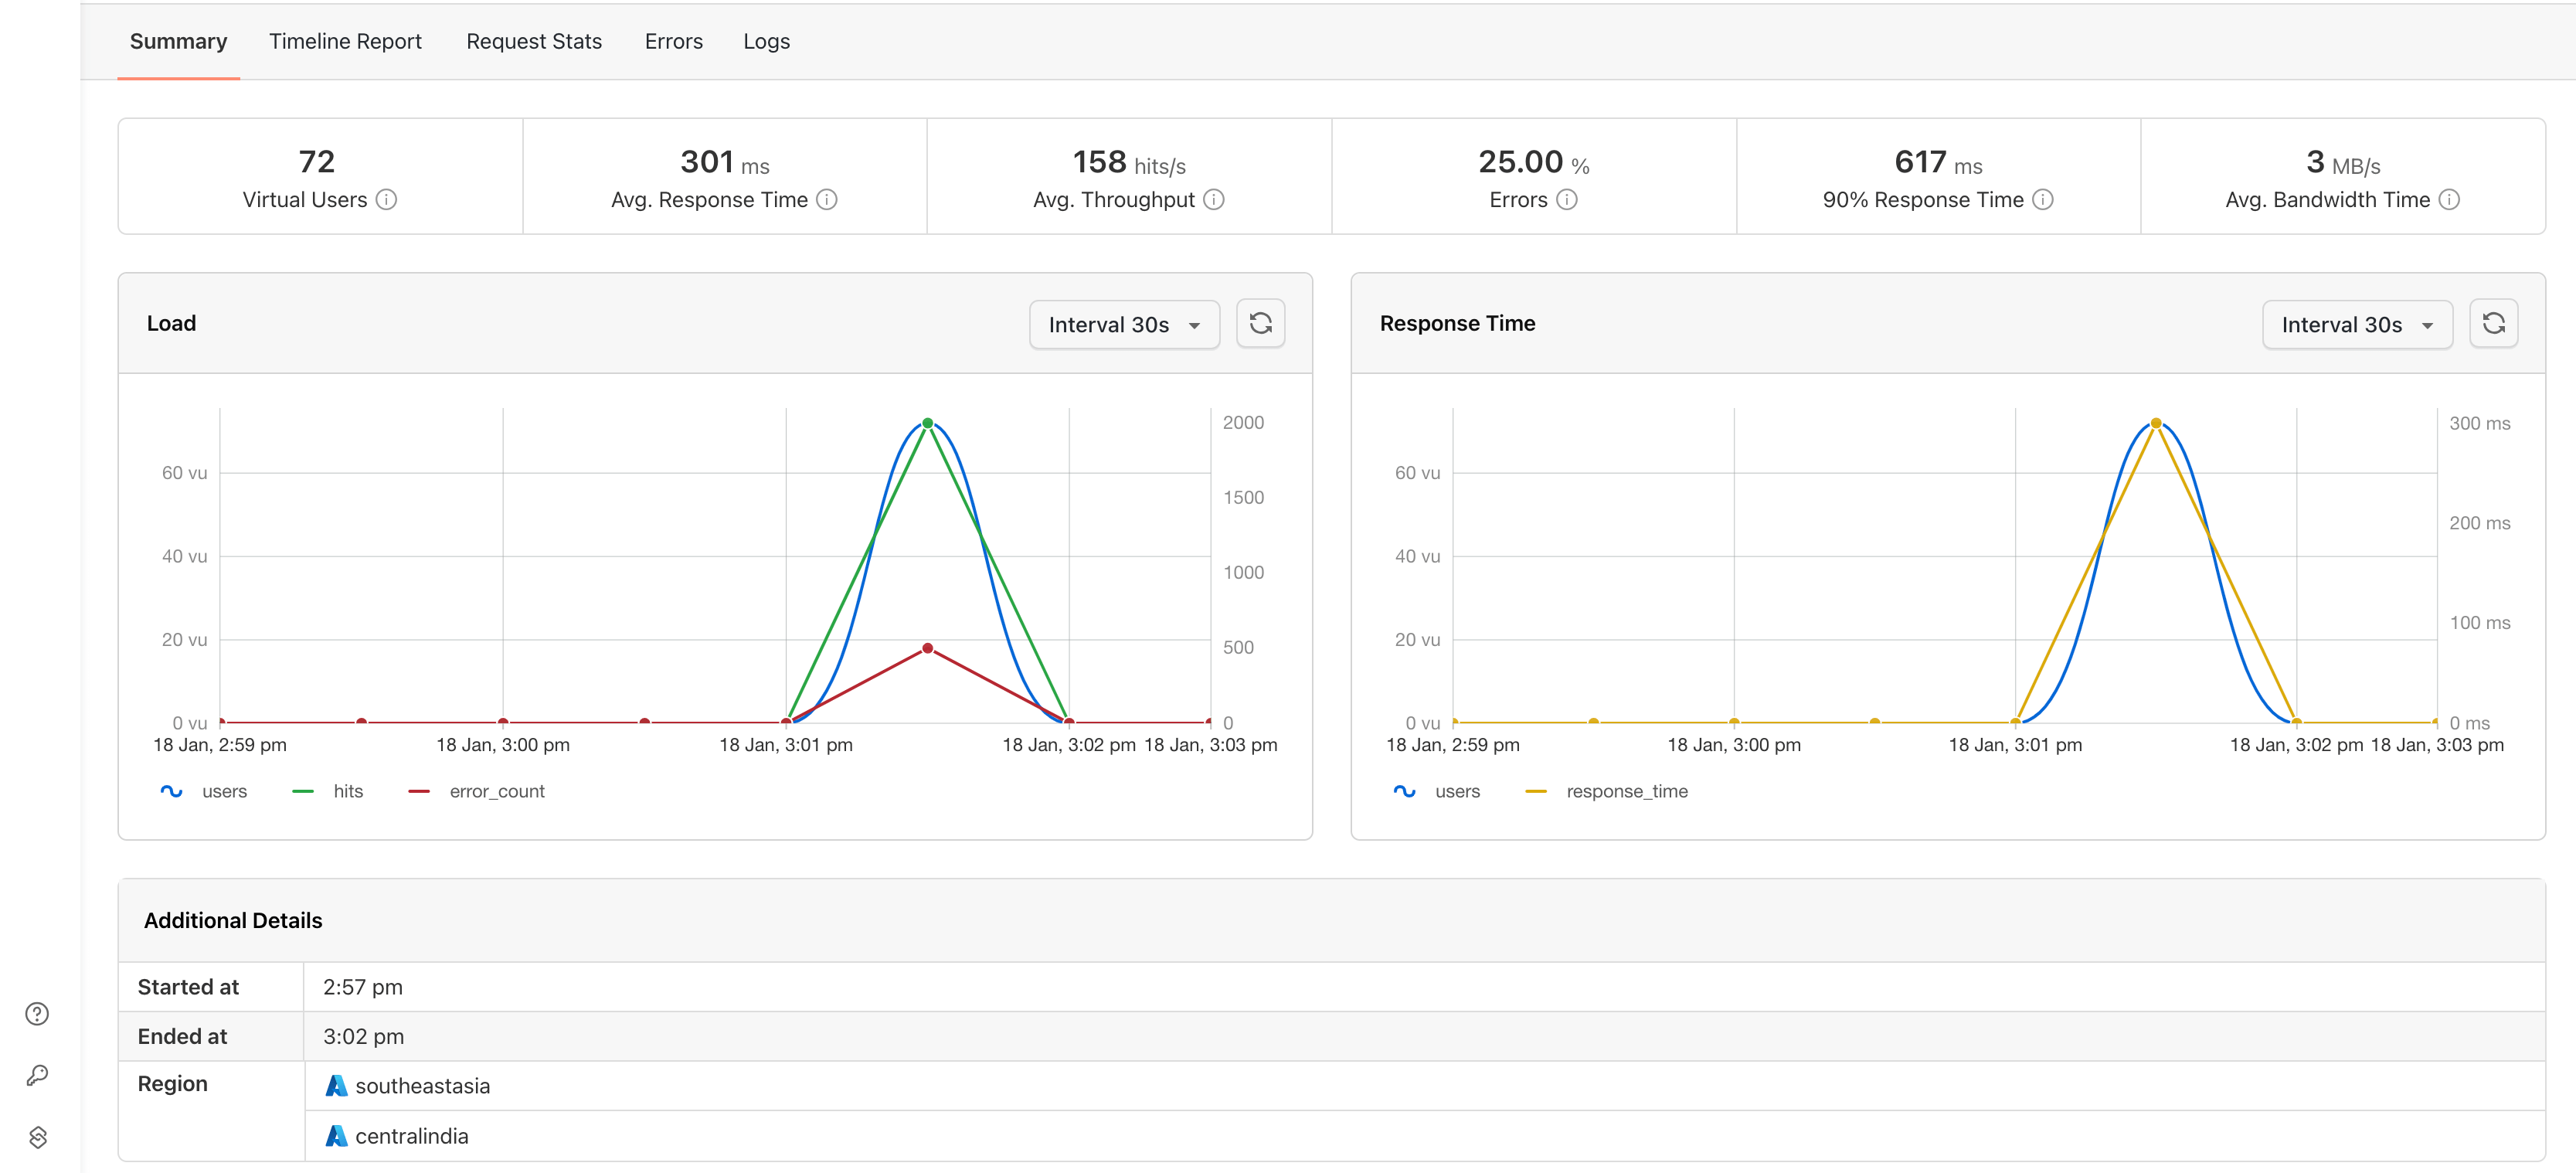
Summary Report
-
Here you can check the Summary of your Job executed that comprises of the details:
- Total number of Virtual Users which basically simulates an instance script of real-world visitors to your app or site.
- Ramp-up and Average Response time.
- Average Throuput and Bandwidth time.
- Load and Response Time graph.
- Additional details like regions and test duration.
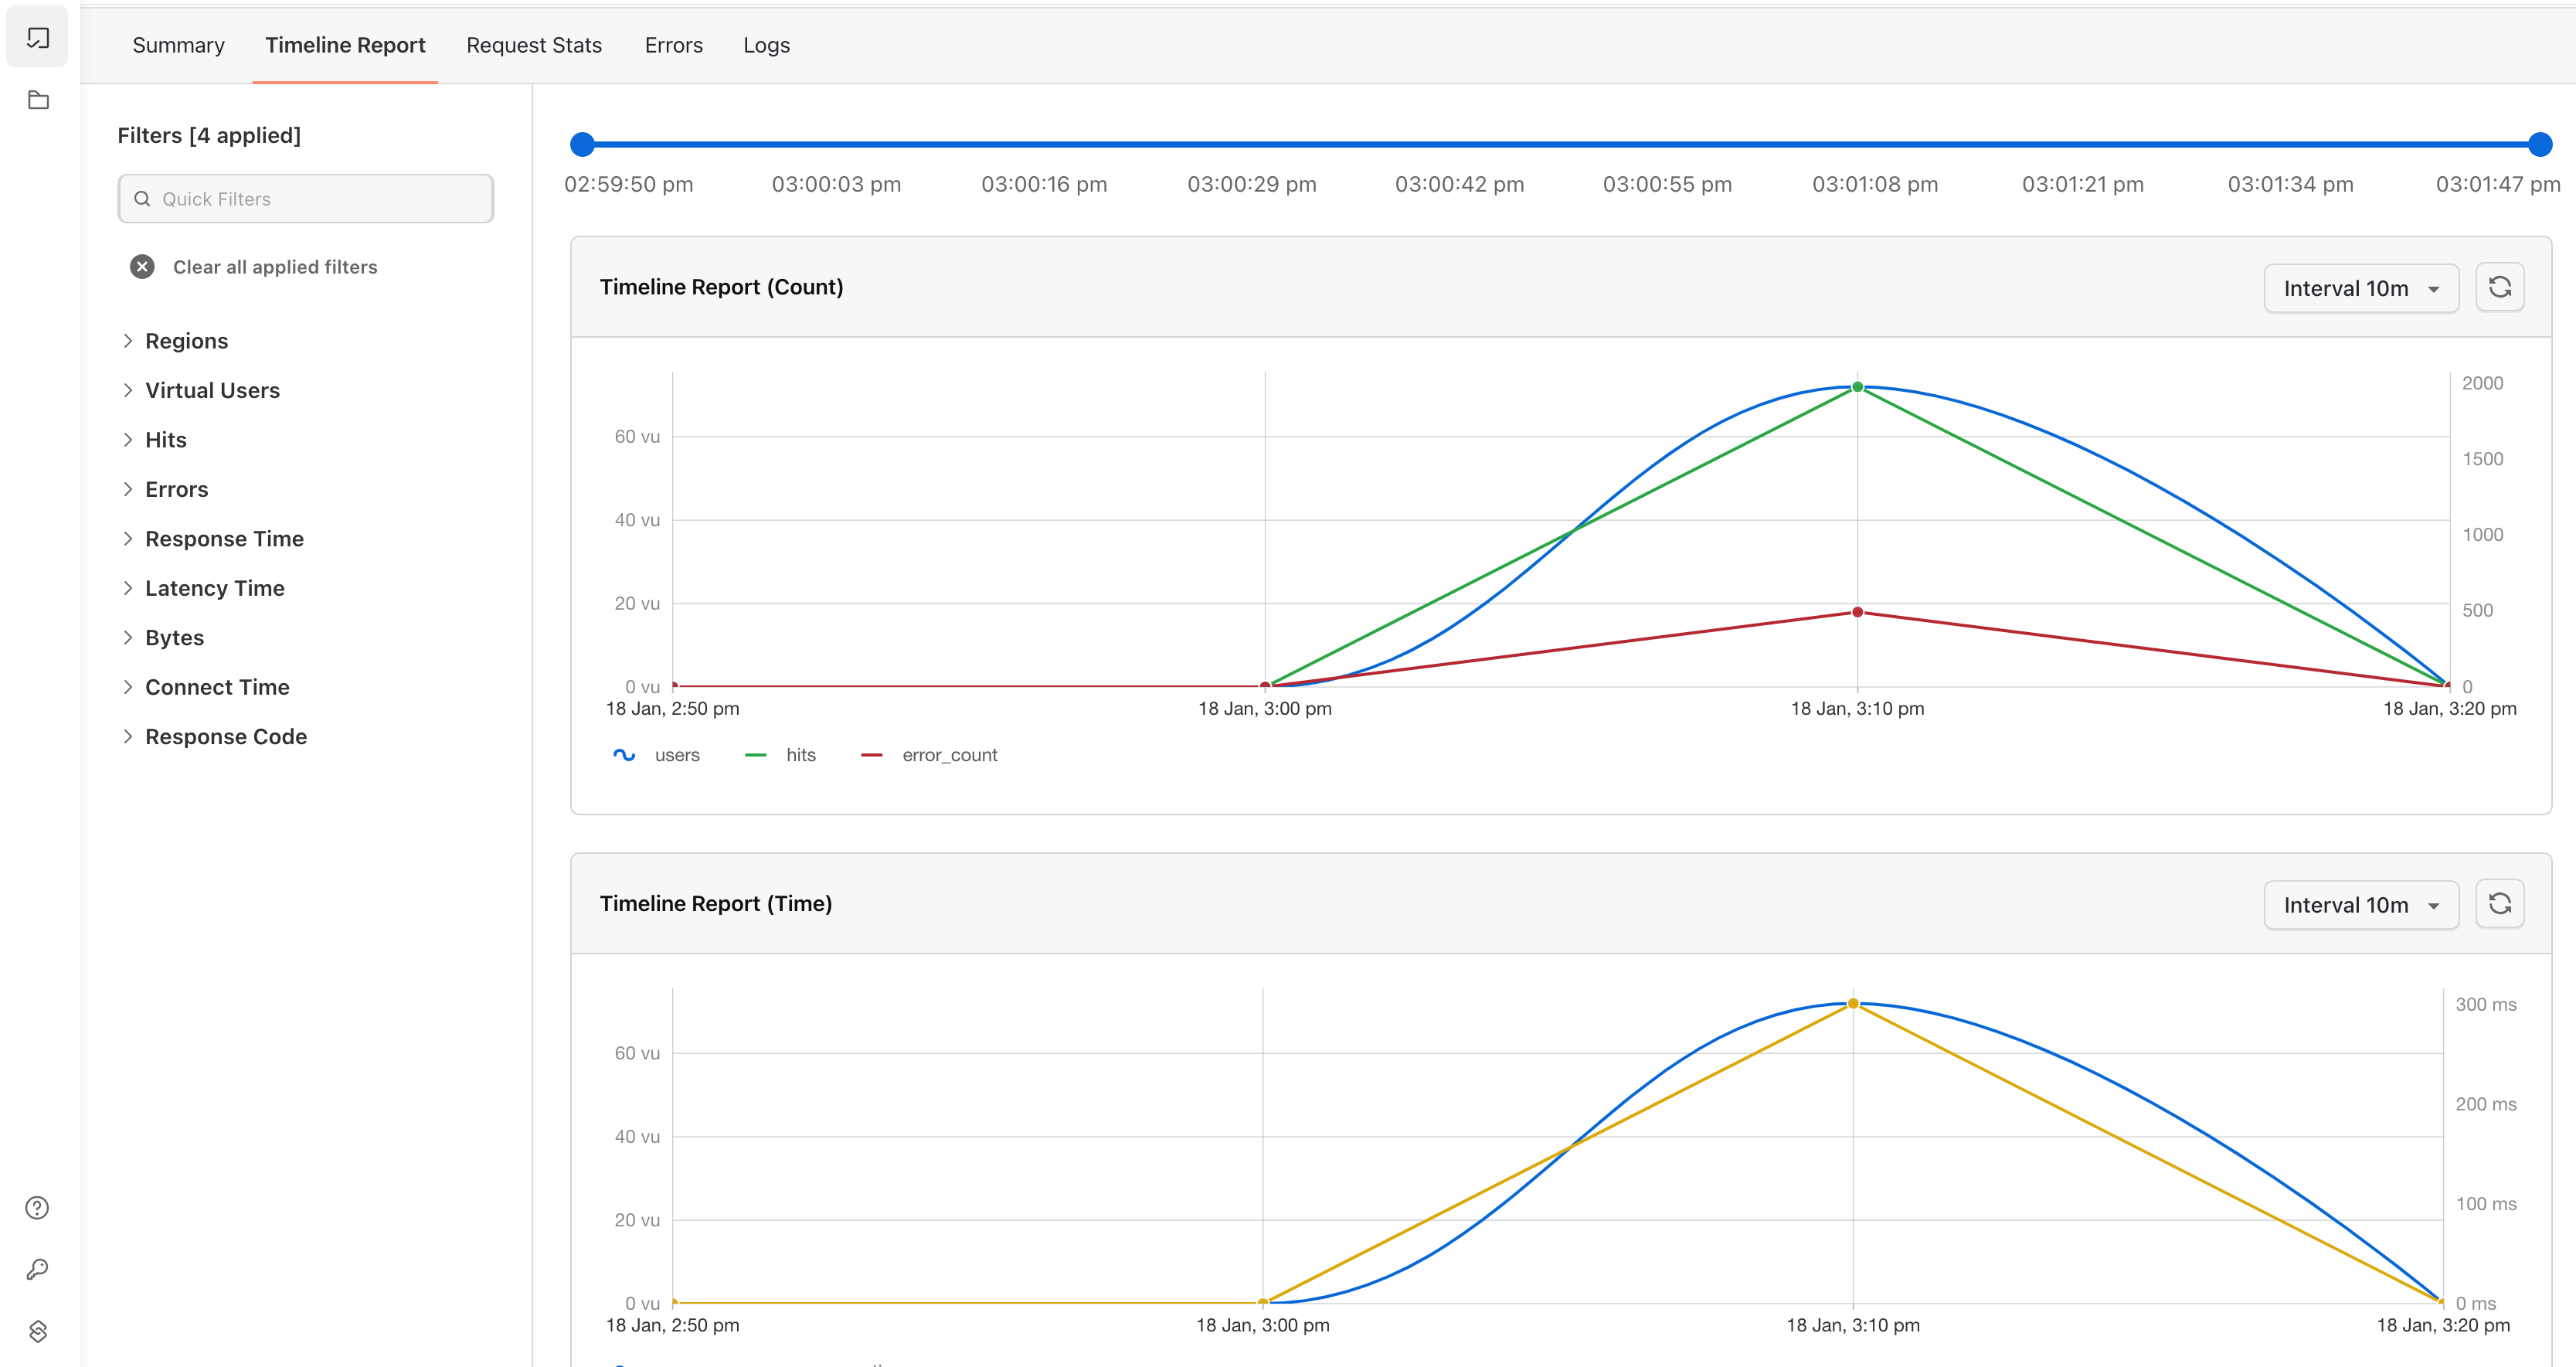
Timeline Report
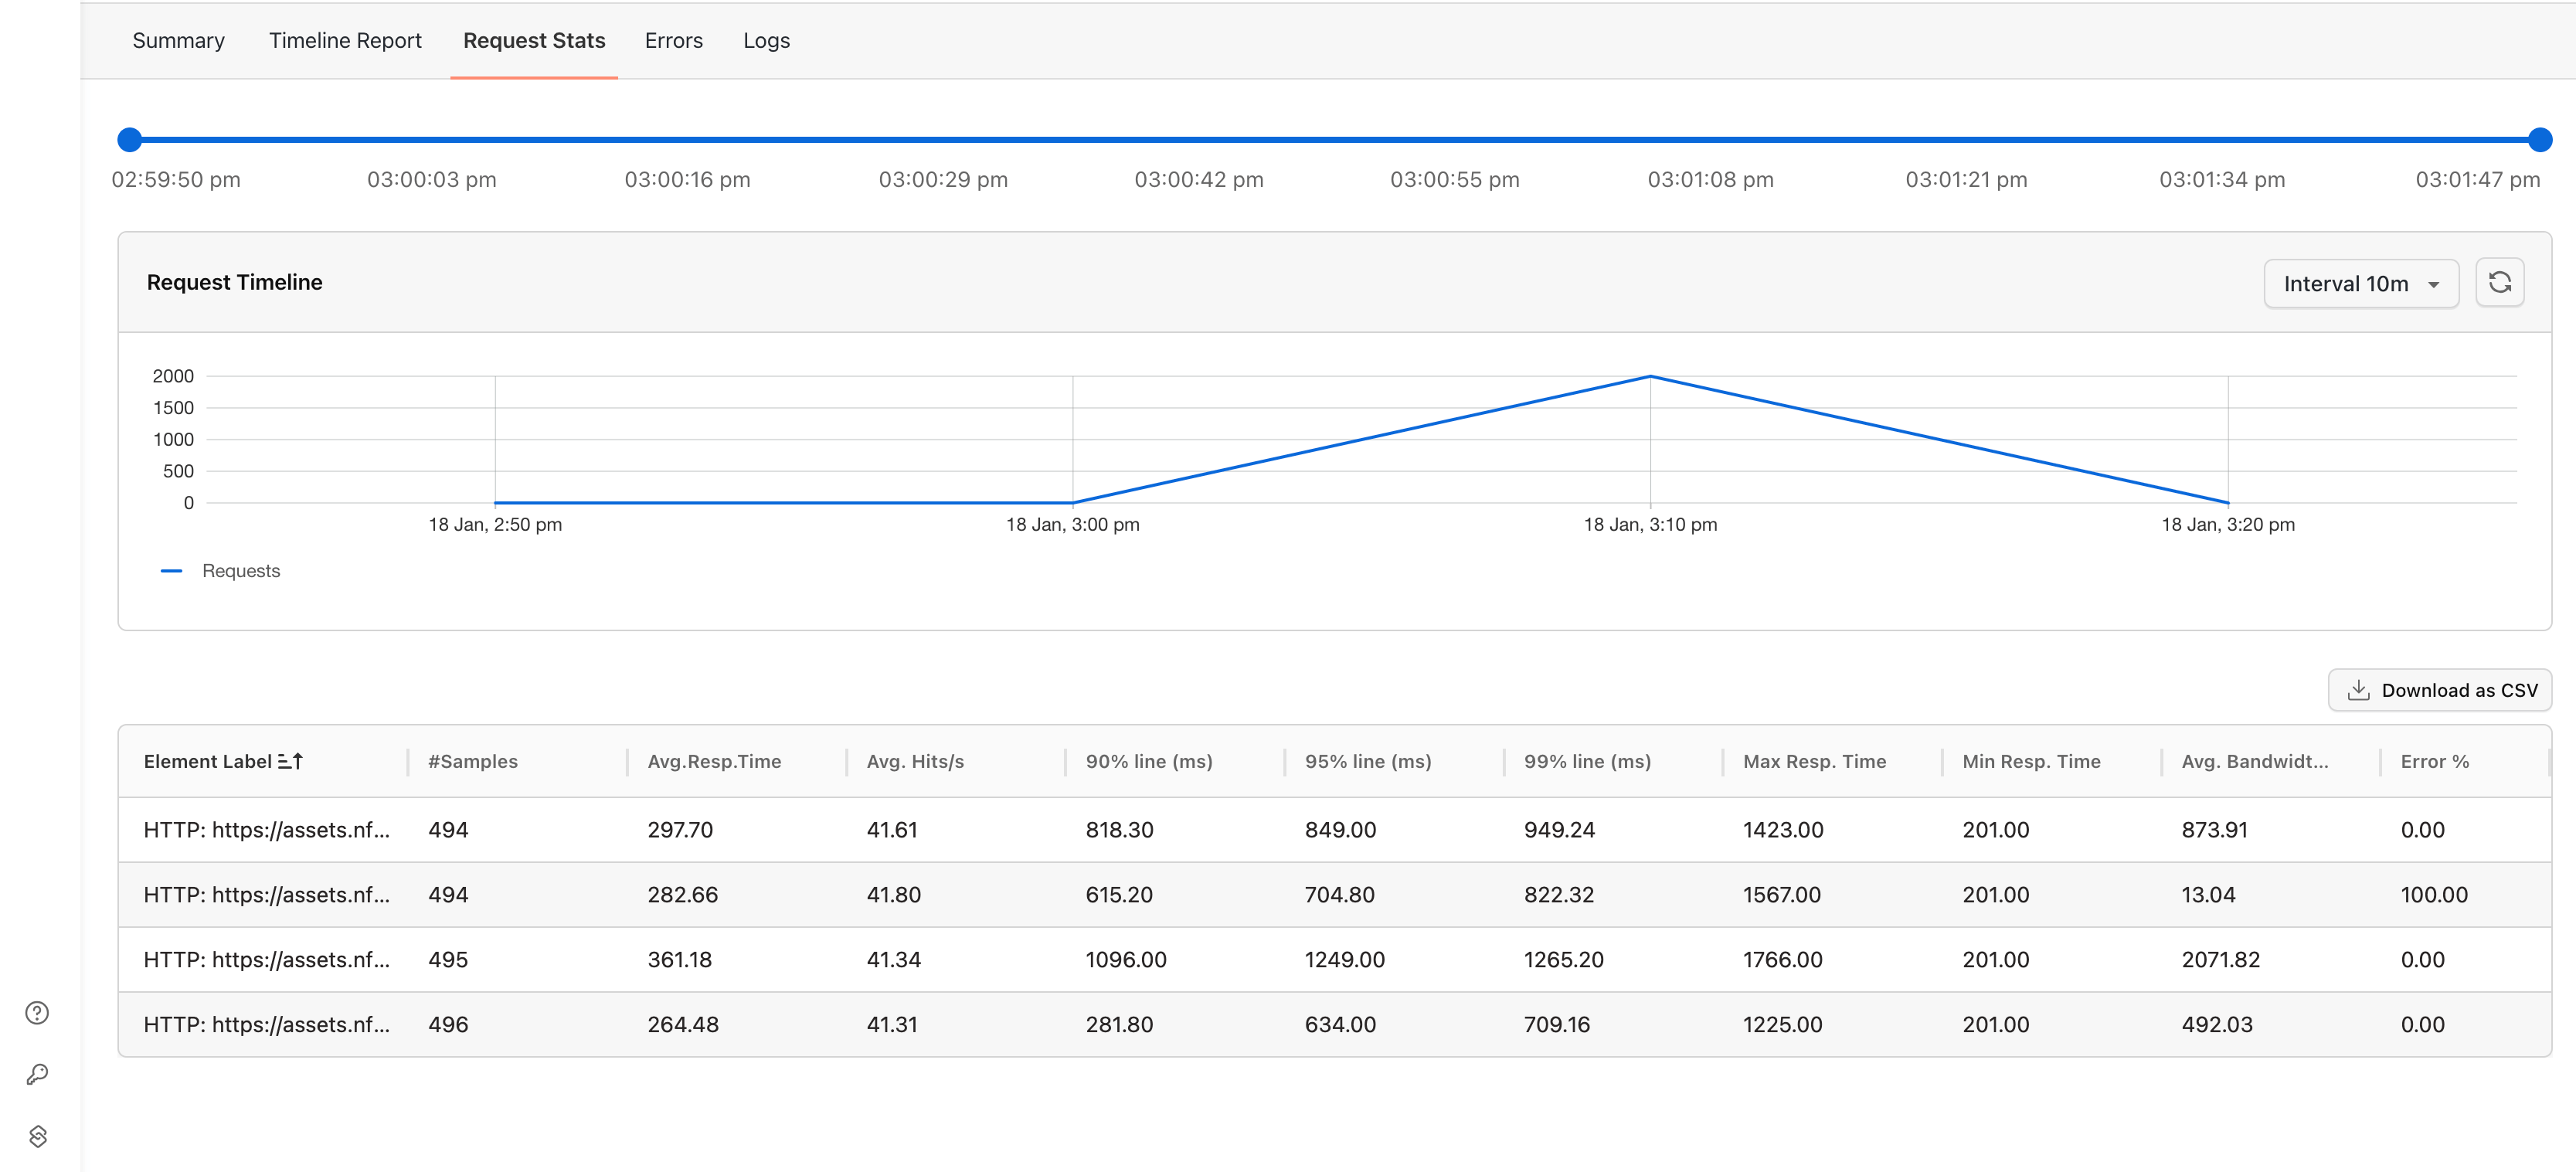
Request Stats
You can analyze the number of requests sent on that particular time.
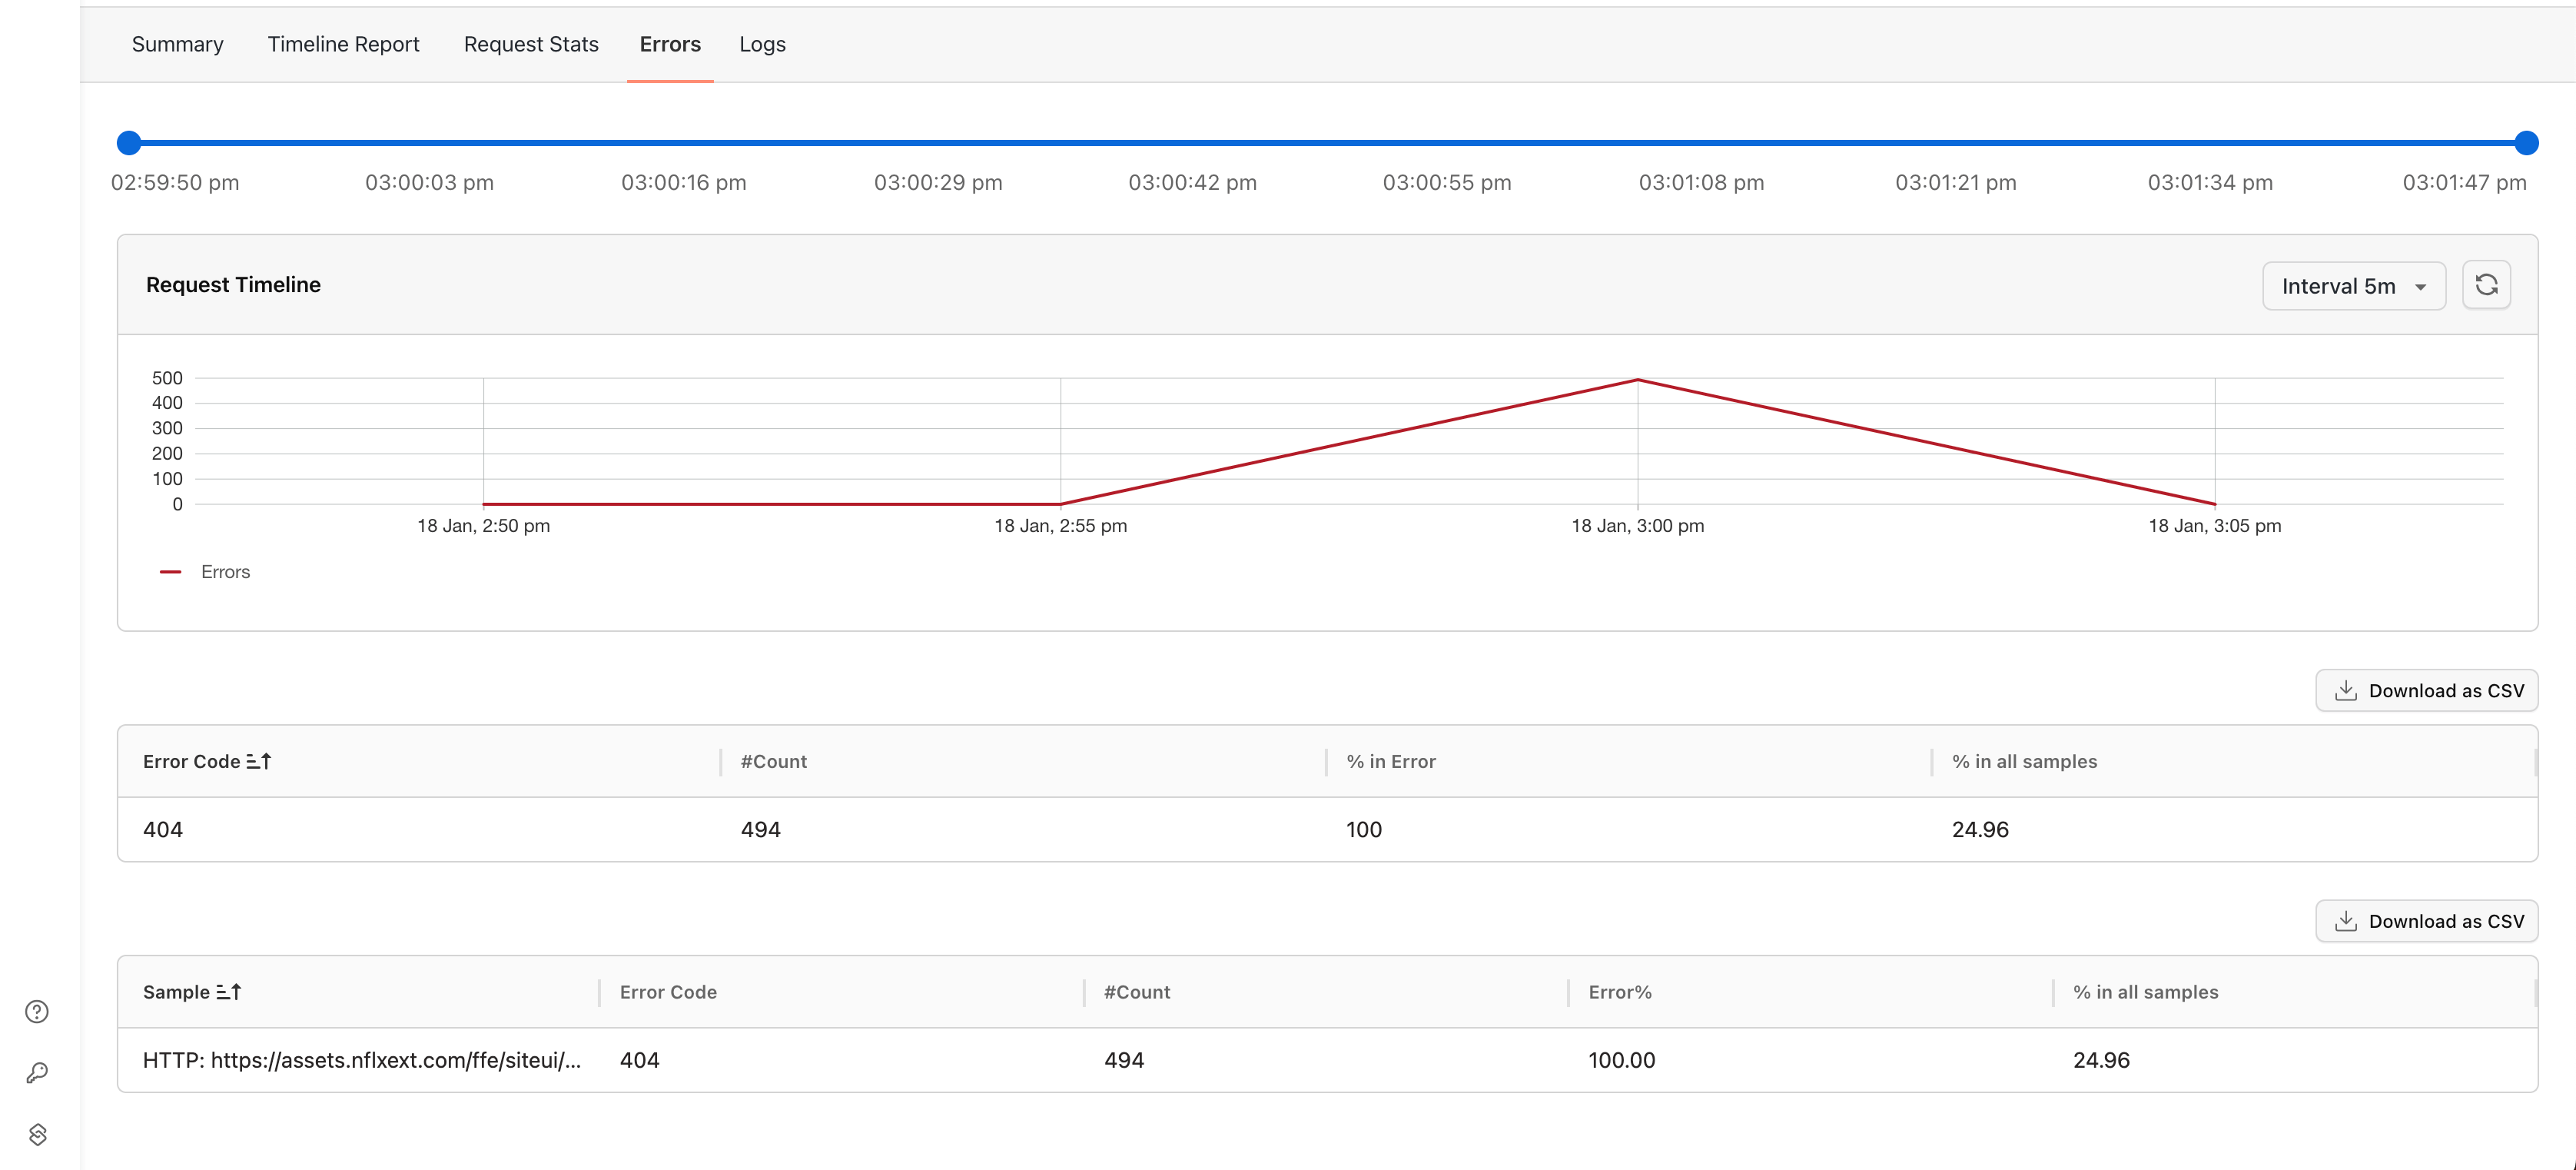
Errors
- Here you can check the Error Code type, Error Count, percentage of that error, and the percent of error in all the samples.
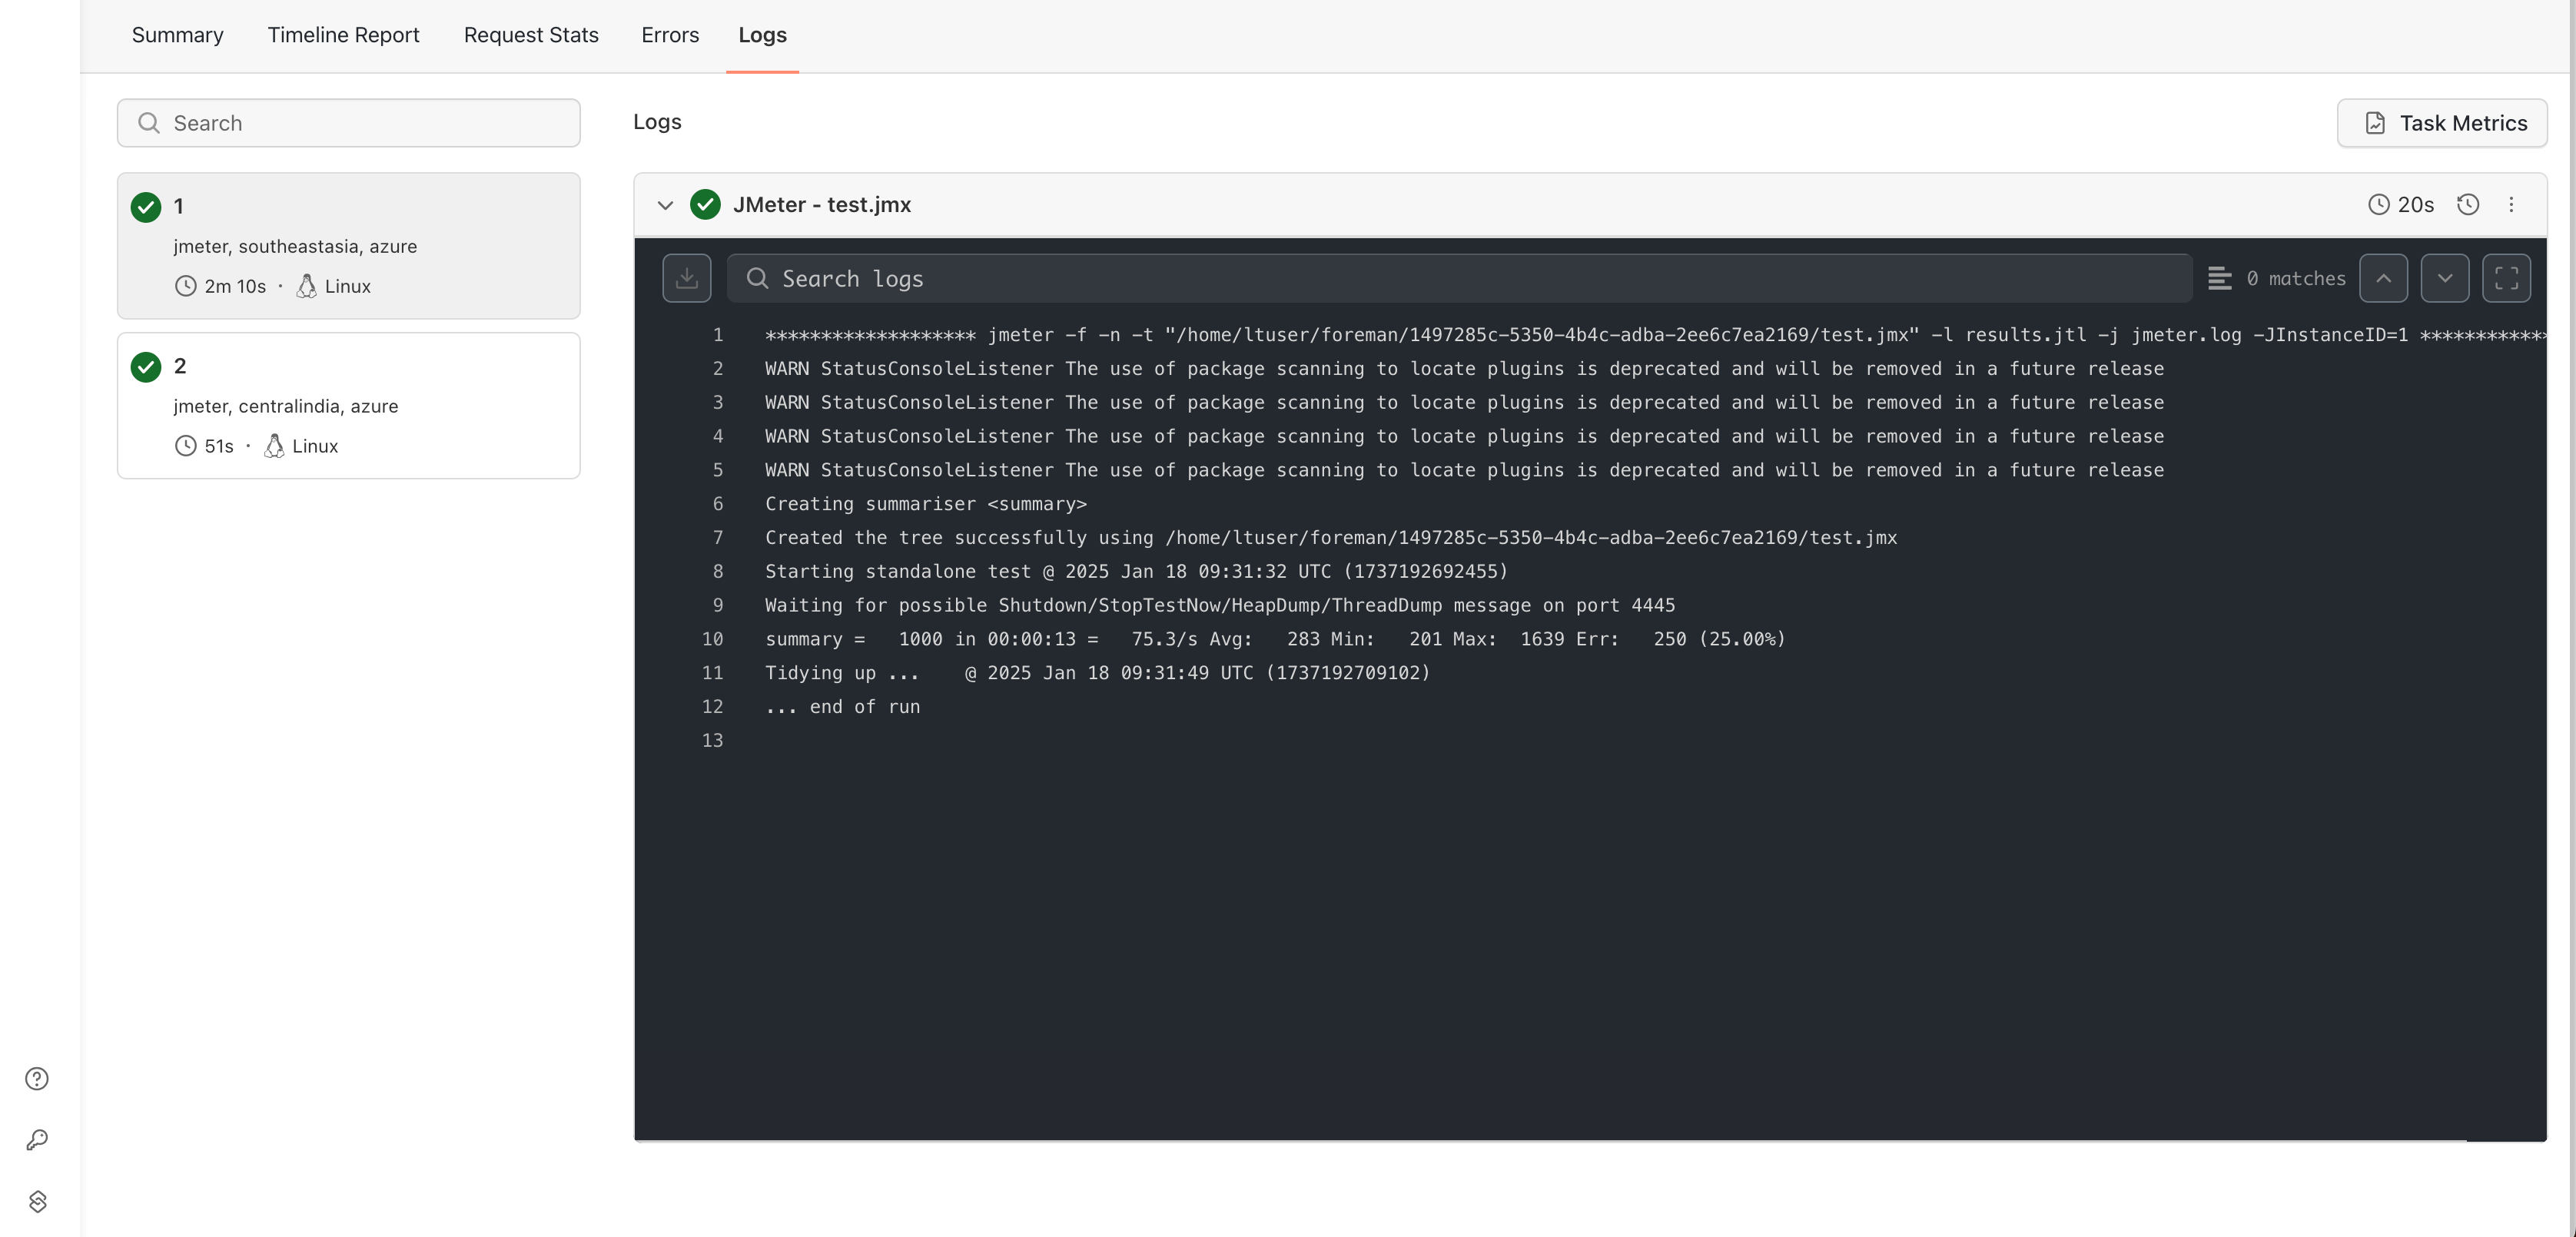
Logs
- You can check the logs of your Jobs executed.
Handling Special Scenarios: Overriding and Default Values
Scenario 1: Overriding Values via Projects portal
When executing performance tests using HyperExecute, you have the option to override default parameters directly in the Projects portal. Let’s explore a sample scenario to understand how HyperExecute handles these overrides.
You configure the following parameters in the HyperExecute UI:
- Virtual Users : (The total number of simulated users for the test): 500
- Ramp-Up Time : 1 minute
- Total Duration : 2 minutes
- Regions : 2 (50% distribution each)
- Maximum Users per Machine : 100
Resulting Test Distribution:
- Load Distribution Across Regions :
- The total 500 virtual users are divided equally between the two regions.
- Each region is allocated 250 users (500 users ÷ 2 regions).
- Machine Allocation : Since a single machine can handle a maximum of 100 users, each region requires multiple machines to support its load:
- Region 1 : 250 users → 3 machines (lets say it distributed as 84, 83, 83 users per machine).
- Region 2 : 250 users → 3 machines (lets say it distributed as 84, 83, 83 users per machine).
Key Takeaways:
- Flexible Overrides : HyperExecute dynamically adjusts the load distribution and machine allocation based on your specified parameters.
- Optimal Resource Utilization : It ensures that no machine exceeds the maximum user threshold, maintaining a balanced and efficient test execution.
- Region-Specific Allocation : Users are distributed proportionally based on the defined load percentages for each region.
This approach ensures smooth execution of performance tests and provides precise control over resource utilization, enabling you to simulate real-world scenarios effectively.
Scenario 2: Default Parameters
In this scenario, you proceed without overriding the default values in the HyperExecute Projects portal. The configuration parameters from your JMeter file and project setup are applied as-is.
Scenario Details:
- Total Users : 250 (Specified in the JMeter .jmx file.)
- Regions : 2
- Machines : 3 (Each region is allocated three machines.)
Resulting Test Distribution:
-
Load Distribution Across Regions : The total of 250 virtual users is not divided across the regions because no overrides were applied. Instead, each region receives the full 250 users.
-
Machine Allocation : Each region is allocated three machines. The total user load for the region is replicated across all three machines in the region:
- Region 1 : 3 machines → 250 users per machine.
- Region 2 : 3 machines → 250 users per machine.
-
User Allocation per Machine : Each machine in both regions processes 250 users, resulting in a total of 750 users (250 users × 3 machines) per region, and overall 1500 users (250 users x 3 machines * 2 regions).
Key Takeaways:
- Default Behavior : Without overrides, the user load from the .jmx file is replicated across all configured machines in each region.
- Resource Replication : Instead of splitting the total users among machines, HyperExecute applies the same load to each machine in a region.
- Importance of Overrides : To distribute users proportionally across machines and regions, use the UI to override parameters such as total users, maximum users per machine, or load percentages.
This behavior highlights how HyperExecute ensures flexibility in test execution while allowing for configuration control based on project requirements.
Frequently Asked Questions
Why is my JMeter job failing before reaching 2000 users?
"Up to 2000 users" describes the ceiling HyperExecute's infrastructure can support under favorable conditions: lightweight requests, sensible timeouts, and load spread across enough machines and regions. It isn't a guarantee for every test plan. The actual achievable concurrency depends on what each virtual user does and how much CPU, memory, and network bandwidth that consumes on the load generator machine. When a job fails before reaching your configured user count, it's almost always because the load generator resources were exhausted before ramp-up completed, not because of an arbitrary platform limit.
What factors impact the maximum achievable load in JMeter?
Four configuration patterns most commonly reduce the number of users a JMeter test can sustain:
- UI/browser-based testing through JMeter: JMeter is built for protocol-level (HTTP/API) load generation, not browser rendering. Driving an actual browser (for example through a WebDriver Sampler) makes each virtual user consume CPU and memory comparable to a full browser session, which can reduce the number of concurrent users a single machine can sustain by an order of magnitude.
- Test scripts without proper timeouts: if HTTP Request timeouts are unset or too high, slow requests cause threads to pile up instead of failing fast and releasing resources. Set explicit Connect Timeout and Response Timeout values on your HTTP Request Defaults, and use a Duration Assertion or thread interrupt settings so hung threads are released rather than accumulating.
- APIs with large request/response payloads: larger payloads require more memory per in-flight thread and more network throughput per request, so large-payload APIs support fewer concurrent users per machine than lightweight requests do at the same request rate.
- End-to-end or chained API workflows: multi-step scenarios (such as login → search → add-to-cart → checkout) require more CPU and per-thread memory each iteration, so the more work JMeter does per virtual user, the fewer users a single machine can sustain within the same resource limits.
How can I identify why my JMeter test is failing?
Match the symptom to its likely cause and where to investigate:
| Symptom | Likely Cause | Where to Look |
|---|---|---|
| Job errors out well before the target user count is reached | Load generator resource exhaustion, driven by test design | Task Metrics → Scenario Stage CPU/memory graph |
| High error rate but resource usage looks normal | The application under test is the bottleneck (server-side errors, timeouts, or capacity limits) | HTTP response codes / error breakdown in the execution report |
| Response times/thread counts increase gradually and never recover | Thread or connection leak from missing timeouts in the script | Response Time graph trend and thread count over time |
| Failures concentrated during ramp-up spikes | Ramp-up too aggressive for the target system or machine allocation | Load and Response Time graph, correlated with ramp-up schedule |
| Failures on one region only | Load distribution misconfigured, or a network/latency issue to that region | Total Load Distribution settings and per-region error breakdown |
How do I know if the load generator has reached its resource limits?
HyperExecute's Task Metrics feature shows CPU and memory consumption at the task level (for each individual task) and the stage level (broken into pre-stage, scenario stage, and post-stage). For load-ceiling investigations, focus on the scenario stage graph: a curve that climbs steadily and flattens near 100% CPU or memory shortly before failures begin is a clear sign the load generator itself, not your application, is the limiting factor. Specific signs a machine has hit its ceiling:
- CPU utilization sustained near 90-100% while the error rate rises
- Memory utilization climbing continuously without stabilizing
- Throughput plateaus or drops even as the configured user count keeps ramping up
- Job logs show OutOfMemoryError, thread-creation failures, or GC-related stalls
If you see these signs, reduce per-machine load (fewer users per machine, more machines/regions in your Total Load Distribution) or optimize your JMX.
Can I load test private or internal endpoints with JMeter?
Yes, but the recommended way to reach them differs from functional automation. For automation testing it's common to use a tunnel, but for load testing a tunnel isn't feasible: it adds an extra network hop with its own resource and latency overhead, and since load testing specifically measures response time and how much load an API can handle, that overhead gets mixed into your results. Instead, reach out to the TestMu AI support team and ask for HyperExecute's static outbound IPs. Whitelist those IPs in your firewall/security group, and HyperExecute's load generators will reach your private endpoints directly, without a tunnel, so your results stay accurate.
Can JMeter be used for UI testing?
JMeter is not recommended for UI/browser-based testing. It has no native rendering engine, so it can't validate what actually renders in a browser, execute JavaScript, or verify visual behavior. Any UI testing bolted onto JMeter through browser-driving samplers reintroduces full browser overhead per virtual user, defeating the purpose of lightweight load generation and significantly lowering achievable concurrency. Use JMeter for backend/API load and throughput testing, and a browser-based automation tool (such as Selenium or Playwright) for validating UI behavior. The two are complementary, not interchangeable.
