Introducing LambdaTest Analytics: Test Reporting Made Awesome 📈
Devansh Bhardwaj
Posted On: November 15, 2022
![]() 28663 Views
28663 Views
![]() 10 Min Read
10 Min Read
Collecting and examining data from multiple sources can be a tedious process. The digital world is constantly evolving. To stay competitive in this fast-paced environment, businesses must frequently test their products and services. While it’s easy to collect raw data from multiple sources, it’s far more complex to interpret it properly.
Organizations with enterprise customers who want to grow their customer base would have their QA heads run around 100,000 to 1 million tests in the ballpark.
A QA manager leading a team of 10 to 20 testers running multiple tests across LambdaTest, like web automation, app automation, and HyperExecute, often faces the challenge of keeping a tab on how the team runs the tests in every particular product.
Along with this, several other concerns arise, like whether they need to visit the dashboard of every particular product to check the number of tests passing and failing errors and how they can streamline these processes so that the team performs better and thus the product performs better.
Since Analytics is a crucial aspect of QA and plays a significant role in making the product successful, LambdaTest has developed a one-stop solution for accessing, analyzing, and streamlining your QA processes and test data – LambdaTest Analytics!
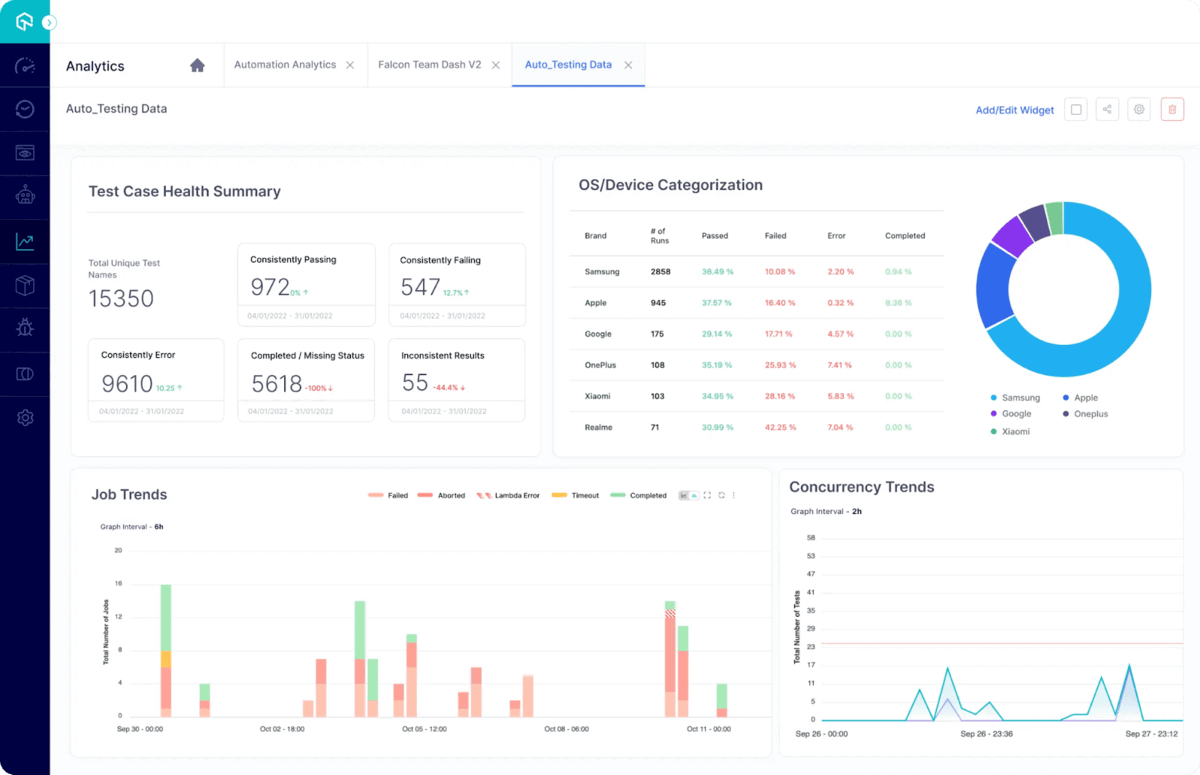
LambdaTest’s centralized test analytics platform allows you to unify all your test execution data on a single dashboard so you can make an informed decision. The newly added customization features will enable you to make your dashboards more useful with widgets and modules and share metrics specific to your stakeholders by building custom dashboards.
LambdaTest is the only platform allowing users to customize their analytics dashboard per their testing requirements. Along with this, a simple click of a button now lets you share real-time test execution data with your team. This will enable you to close the gap between data, insight, and action to make better and faster decisions.
Users can also customize their analytics dashboard by adding their favorite widgets. Currently, users can categorize their data across the LambdaTest product offerings – Web Automation, App Automation, and HyperExecute. Under the product categories, users are provided with a list of modules and widgets. They can easily add a suitable widget for analyzing their data.
Let’s discuss the analytics modules you will get with the all-new LambdaTest Analytics!
Get A Birdeye’s View Of All Your Tests
The Test Overview module lets users get an overview of the tests running on LambdaTest. This module covers the essential details about each test, including its inconsistencies, total number of executions, and categorization by Status and platform.
You will get access to 7 widgets under the Test Overview module. These are:
- Test Case Health Snapshot
- Test Summary
- Test Browser
- Test OS
- Test Trends
- Test Device Coverage [App Automation specific]
- Test Status Ratio
Let’s discuss these widgets in detail.
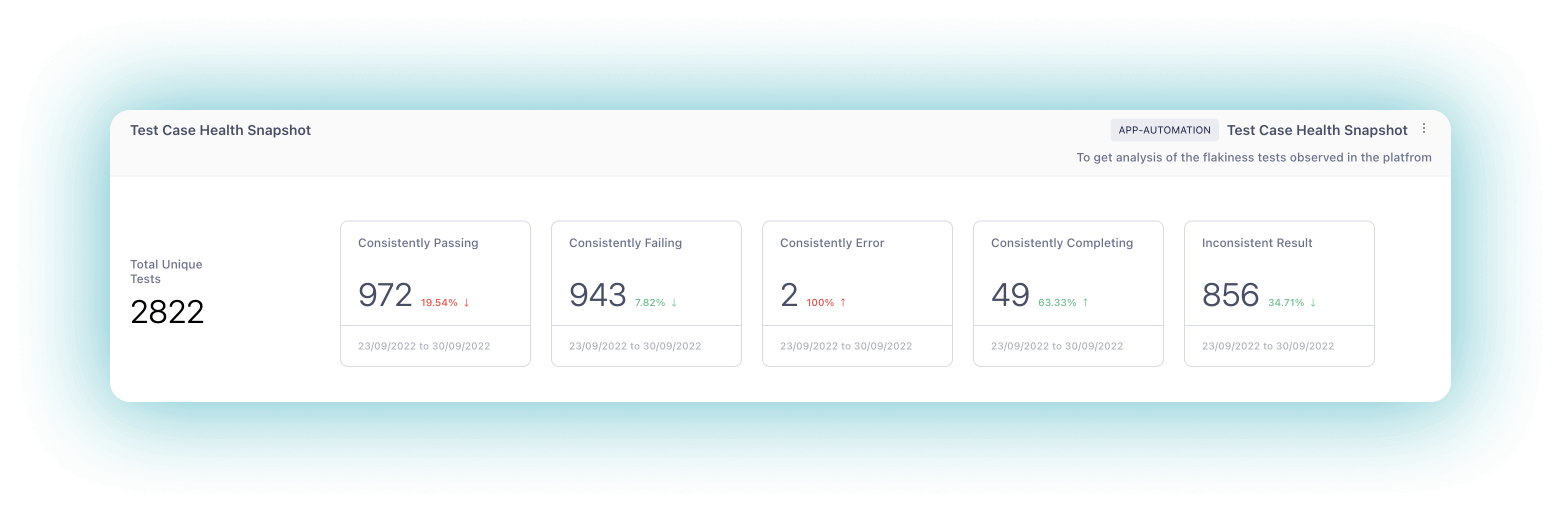
Test Case Health Snapshot
The Test Case Health Snapshot widget gives the user a clear picture of the performance of tests on the platform. This widget lets users easily track the number of tests that consistently pass or fail, illustrating their inconsistencies over time. With this widget, the user can understand the health status of the test cases run on the platform for a specific environment.
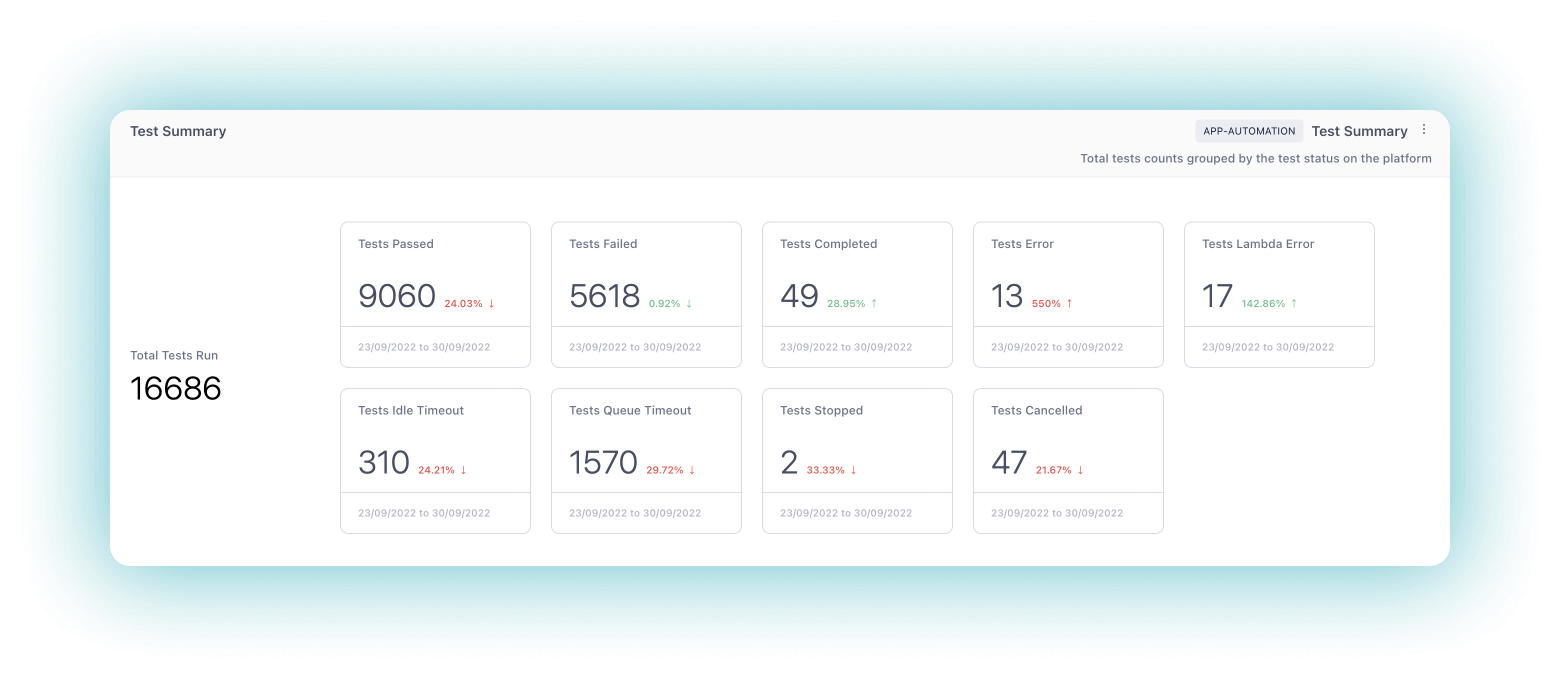
Test Summary
The Test Summary widget lets you track the total number of tests being run on the platform, grouped by their Status. This widget also includes information about the errors encountered, including test case errors, idle timeouts, queue timeouts, and Lambda errors.
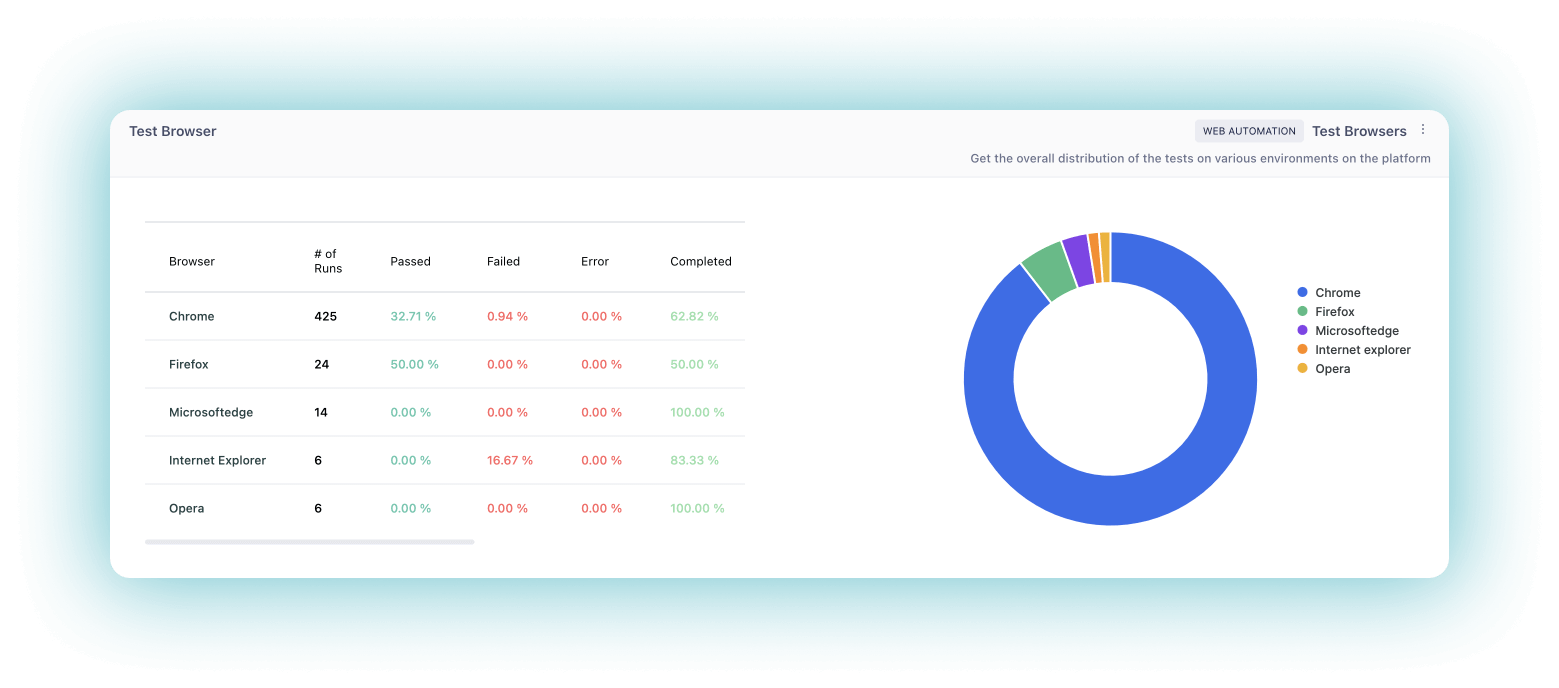
Test Browser
The Test Browser widget displays the overall distribution of tests on various browsers on the platform. It can be used to analyze the results by selecting a particular browser, which will display information about the specific versions of that browser where tests are executed. With this, the user can determine if any test cases are failing for a particular browser and get information about the test logs.
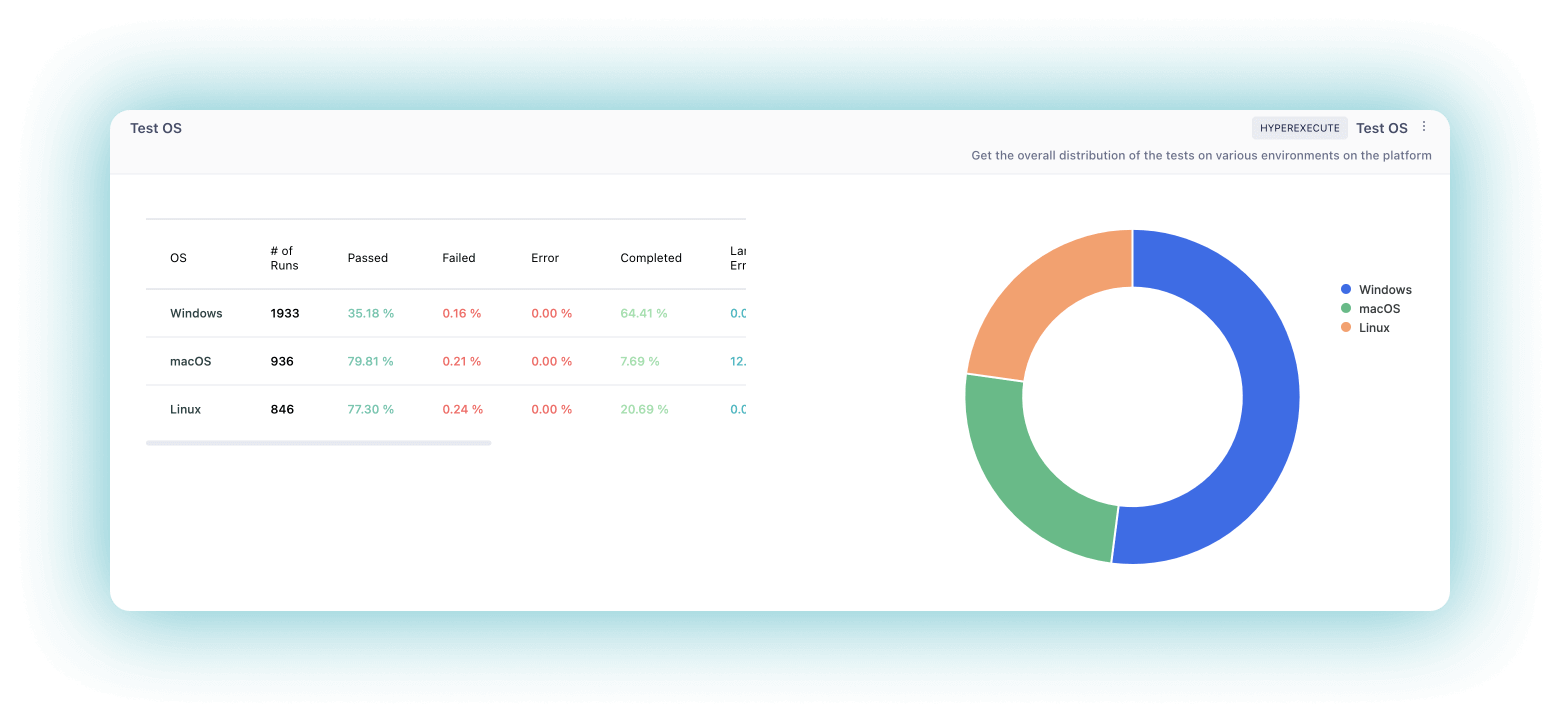
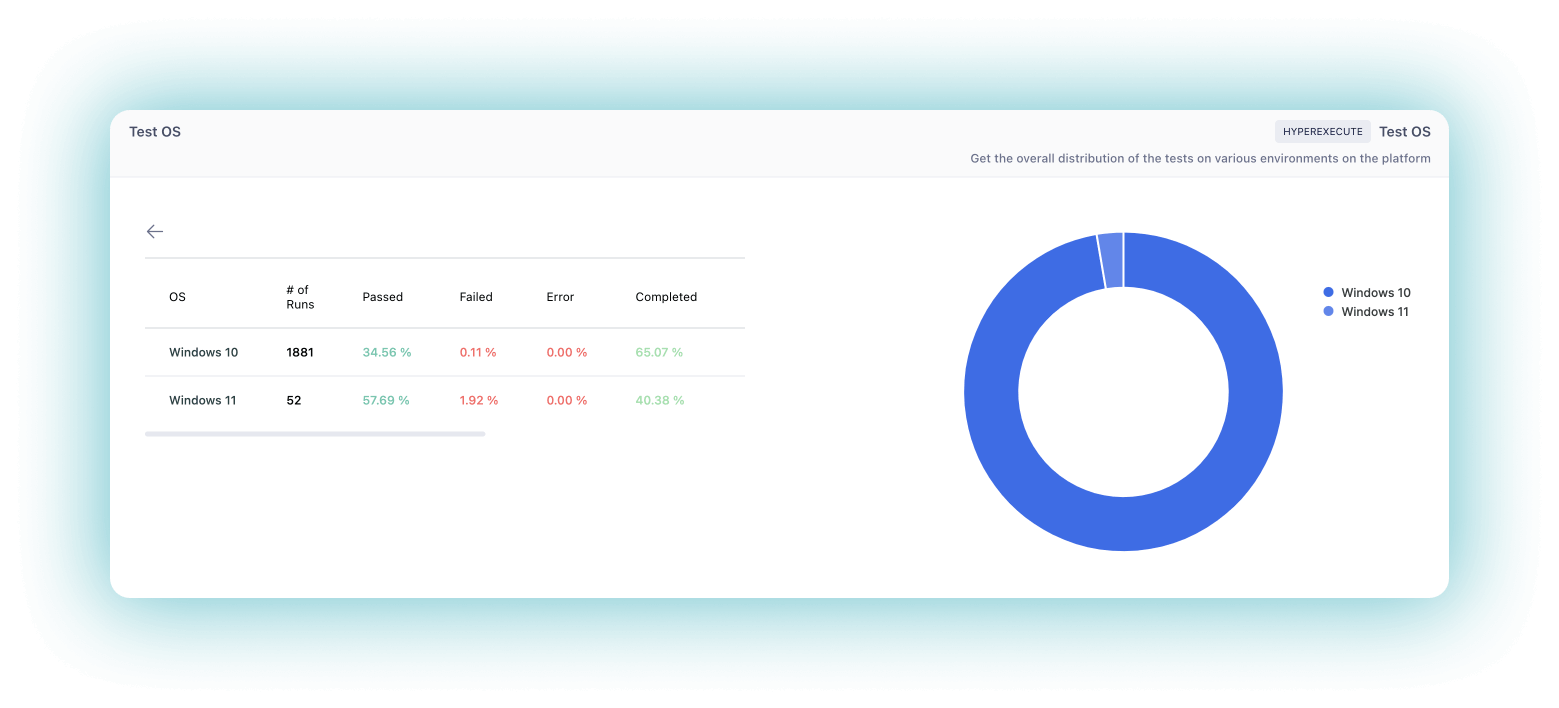
Test OS
The Test OS widget displays the overall distribution of tests on various Operating Systems on the platform. It can be used to analyze the results by selecting a particular Operating System, which will display information about the specific versions of that Operating System where tests are executed. With this, the user can determine if any test cases are failing for a particular Operating System and get information about the test logs.
Test Trends
The Test Trends widget makes it easy for users to analyze the trends of tests executed on the platform over a period of time. By selecting a legend at the bottom of the graph, the user can compare current trends with previous trends. You can interact with the graph and change the view in various formats like hourly, weekly, daily, and monthly.
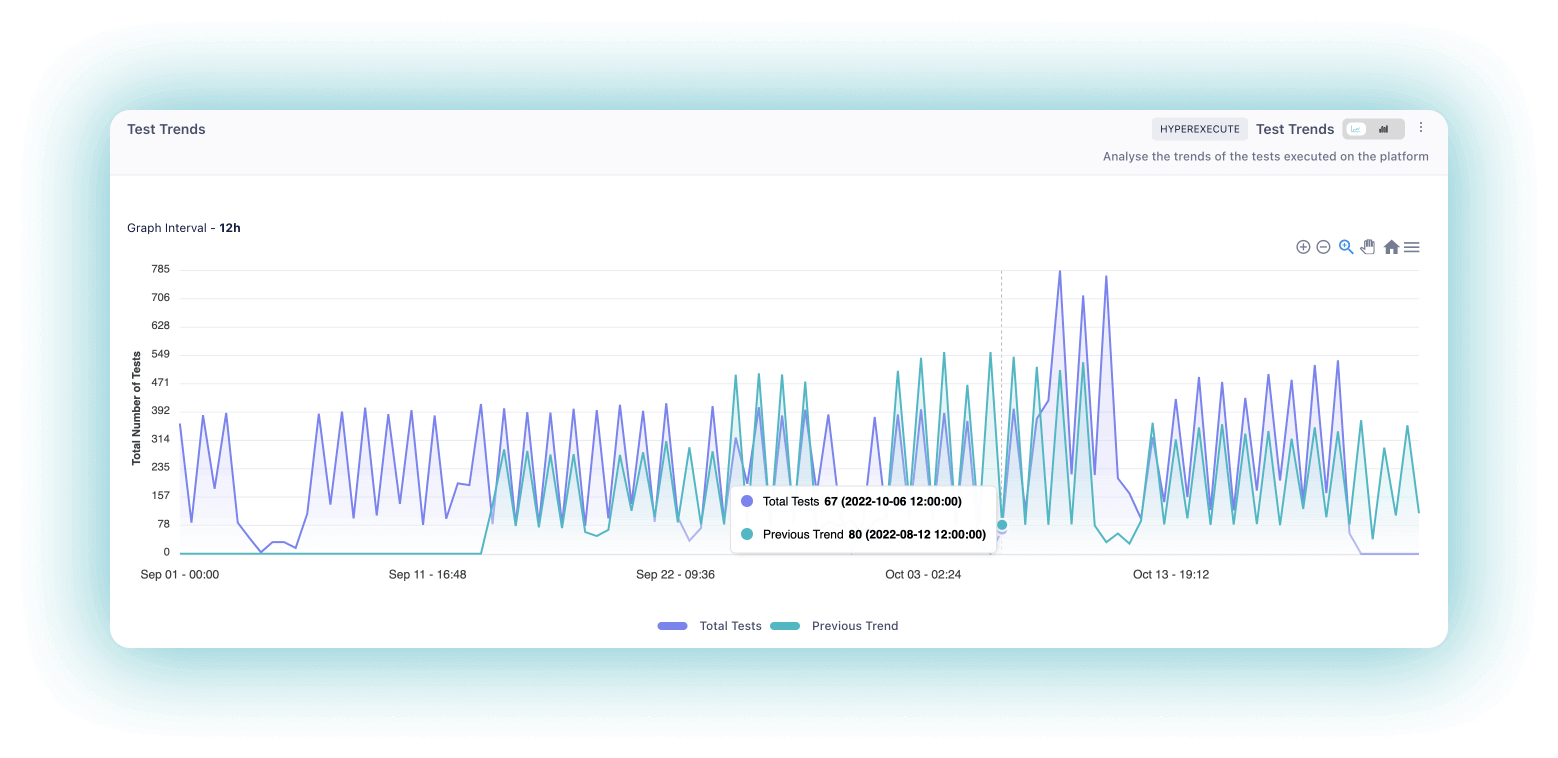
Not only this, but users can also change how they want to view their test data graph. They can change the view from Line graphs to Bar graphs and even get the option to download/export graph widgets in various formats (SVG, PNG, and CSV). Also, users can specify the test data execution timeline to find information about a specific period.
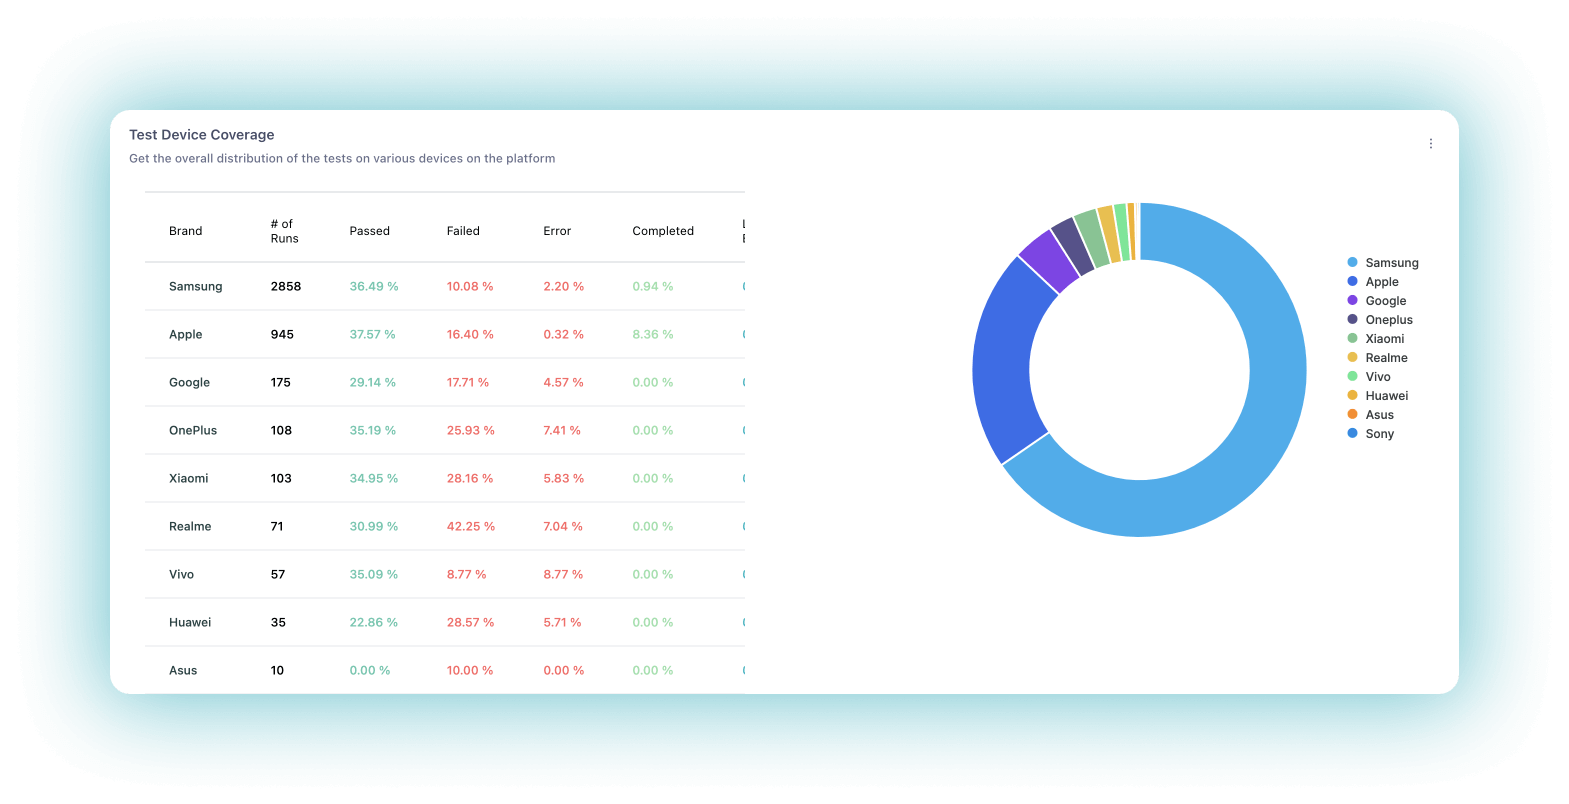
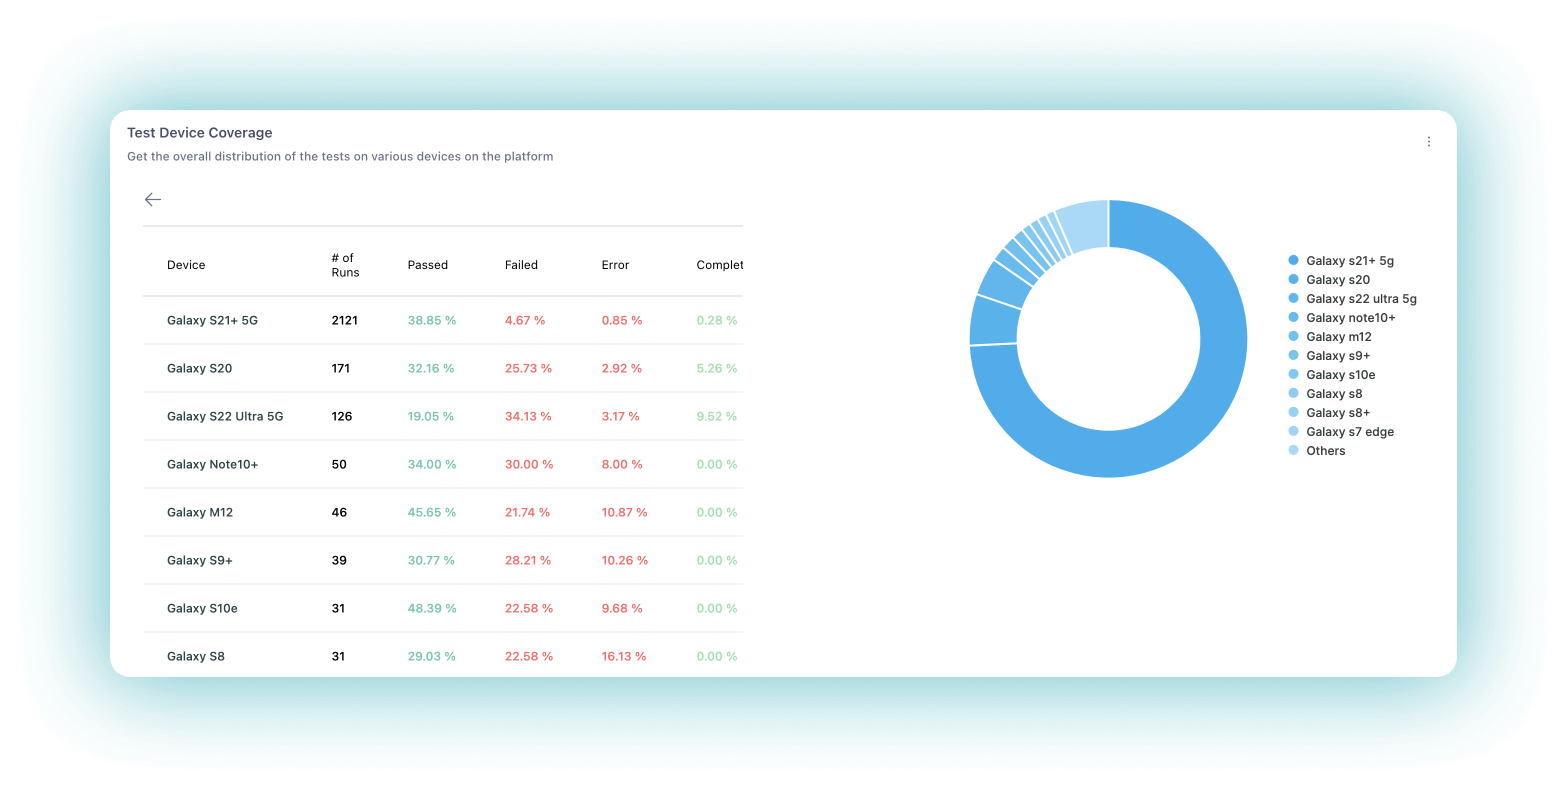
Test Device Coverage
Test Device Coverage is an App Automation-specific widget that displays the distribution of your tests on various mobile devices. It displays information about specific models of mobile devices where the tests are being executed and further categorizes the distribution by selecting a particular model.
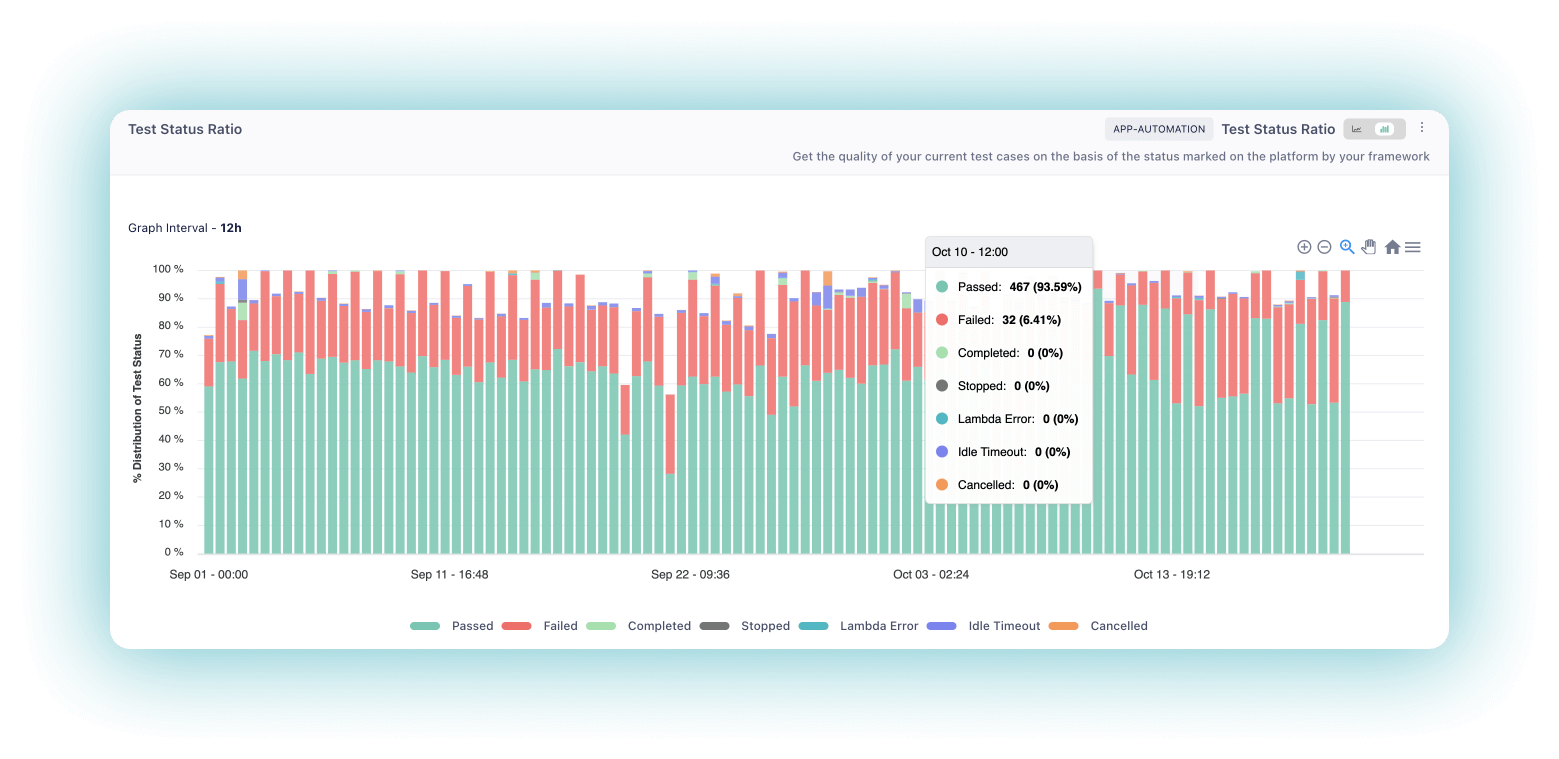
Test Status Ratio
The Test Status Ratio widget seamlessly provides information about the quality of the user’s test cases based on the Status marked on the platform. You can filter the data and see trends over time by clicking on the relevant legends at the bottom. With the Test Status Ratio widget, you can easily get and resolve a list of failing tests or facing an error.
Access To All Error Insights In One Place
The Error Insights module is a powerful tool that allows users to get all the test error insights in one place. Users can easily find information about the count and type of test errors through highly customizable widgets.
You will get access to only one widget under the Error Insights module:
- Error Stats
Let’s discuss this widget in detail.
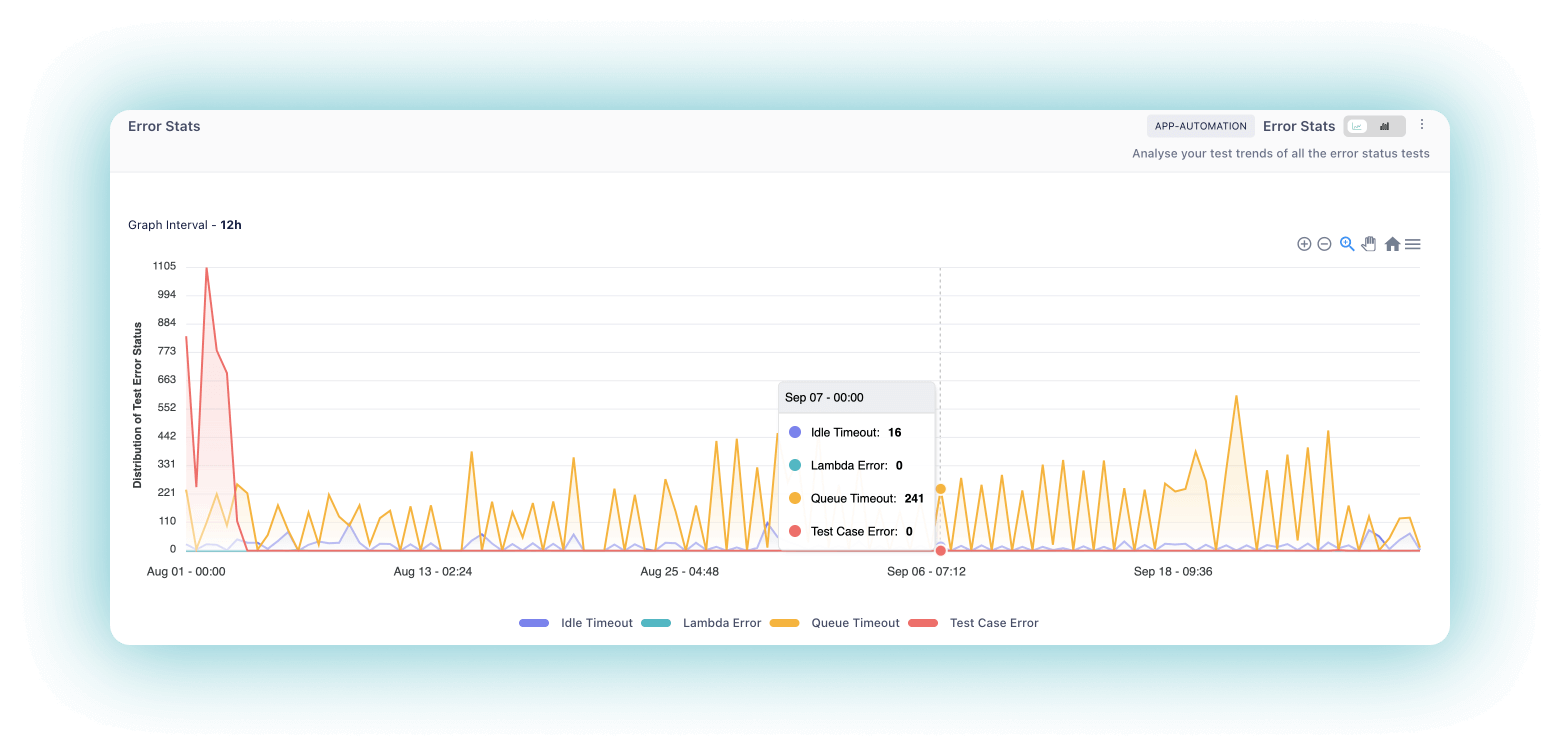
Error Stats
With the Error Stats widget, you can analyze tests categorized by their Error Status on the LambdaTest platform, including Test Case Errors, Idle Timeout, Queue Timeout, and Lambda Error. You can identify and resolve the list of tests with a particular error by filtering the graph.
Know How Your Team Utilizes LambdaTest Resources
The Resource Utilization module lets the QA Managers get an overview of their teams’ LambdaTest resources. There is only one widget under this module, called Concurrency Trends.
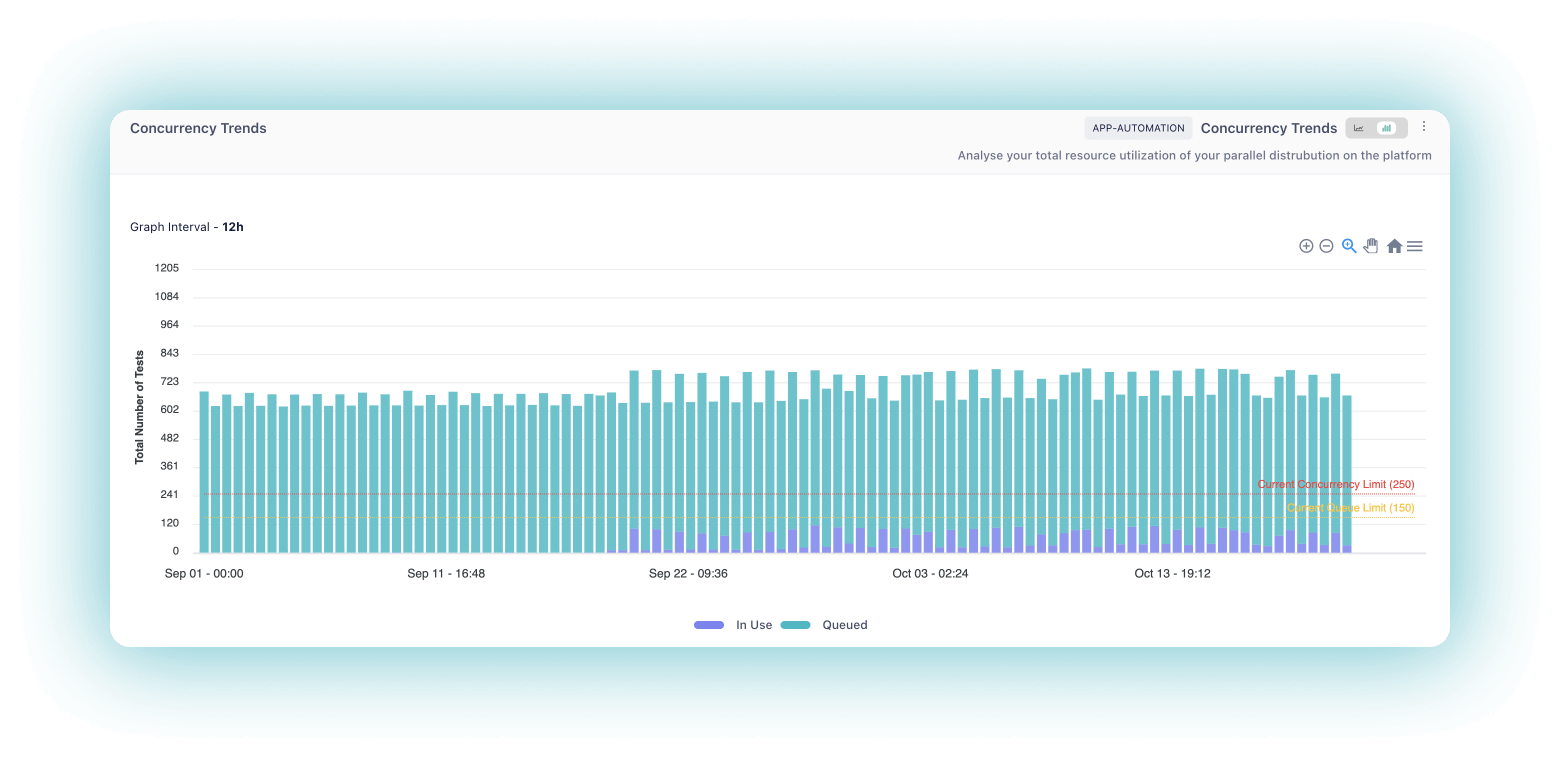
Concurrency Trends
The Concurrency Trends widget provides QA team leaders with a visual way to track the workload of their teams. With this widget, they can easily see which tests are running and waiting to run. The widget also allows them to filter the information on the graph by clicking on the relevant legends at the bottom. This function makes it easy for them to optimize their LambdaTest plan subscribed by their team.
Click here to create your first Dashboard with LambdaTest Analytics! Try LambdaTest Now!
One Stop For All The HyperExecute Insights You Need
The HyperExecute module enables QA managers to get all the HyperExecute insights in one place. With this information, they can easily find data on the number of Jobs, Tasks, and Stages run on the platform, along with details about their performance.
You will get access to Seven widgets under the HyperExecute module. These are:
- Job Trends
- Job Insights
- Stage Trends
- Task Trends
- Job Summary
- Task Summary
- Stage Summary
Let us discuss these widgets in detail.
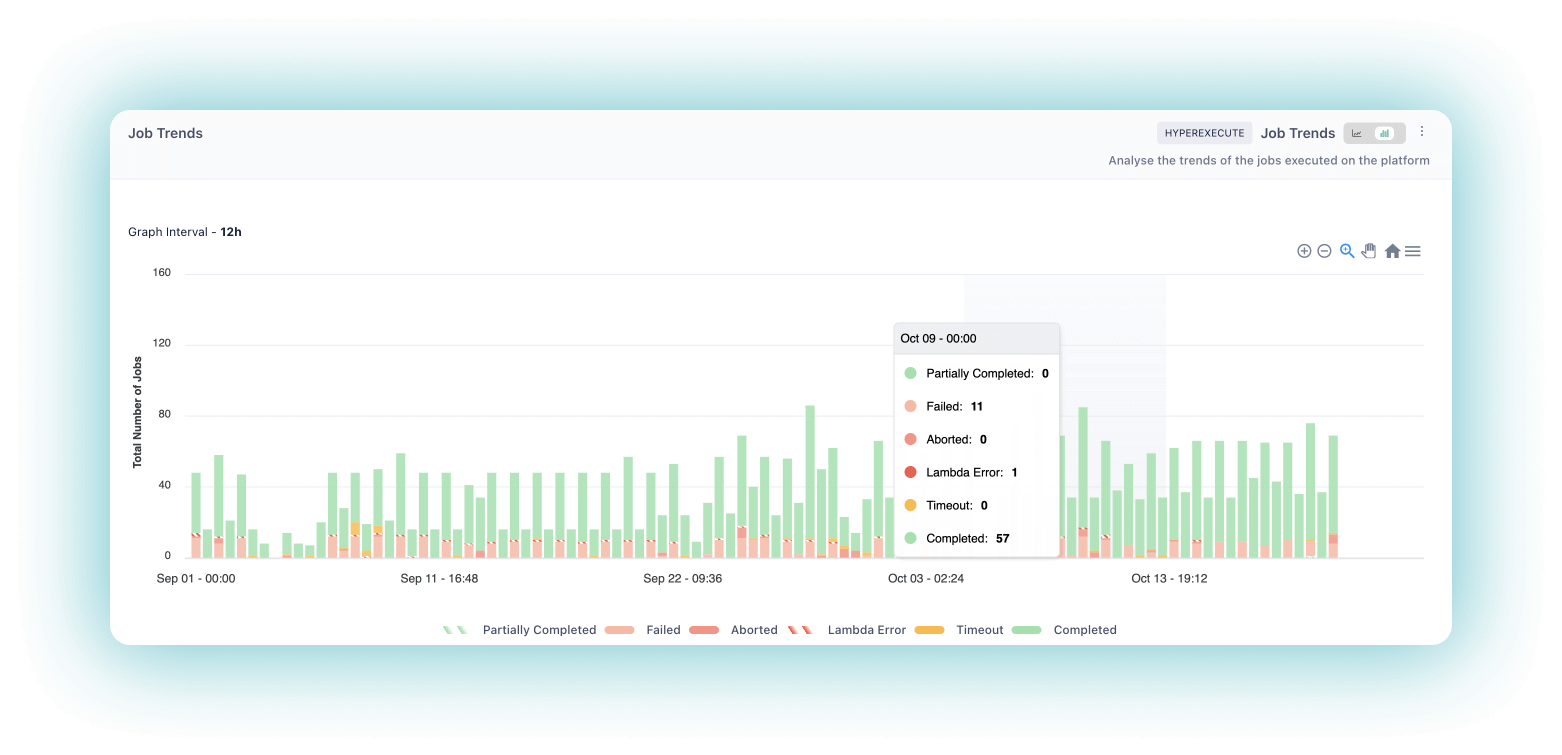
Job Trends
The Job Trends widget allows users to analyze the status of their Jobs, providing them with information about whether a Job Failed or was Aborted, Completed successfully, Timeout, or had a Lambda Error. The Job Trends widget can also be filtered by accessing the legends at the bottom.
Job Insights
The Job Insights widget gives you a comprehensive overview of the Jobs executed on the platform. These include Completed, Failed, Lambda Error, Timeout, and Cancelled Jobs. You can see the high-level overview for the day by clicking on a bar representing that day.
The Job Insights widget can be drilled down to see the exact count of each Step and Scenario of a specific job run on the platform for a particular day by expanding the bar
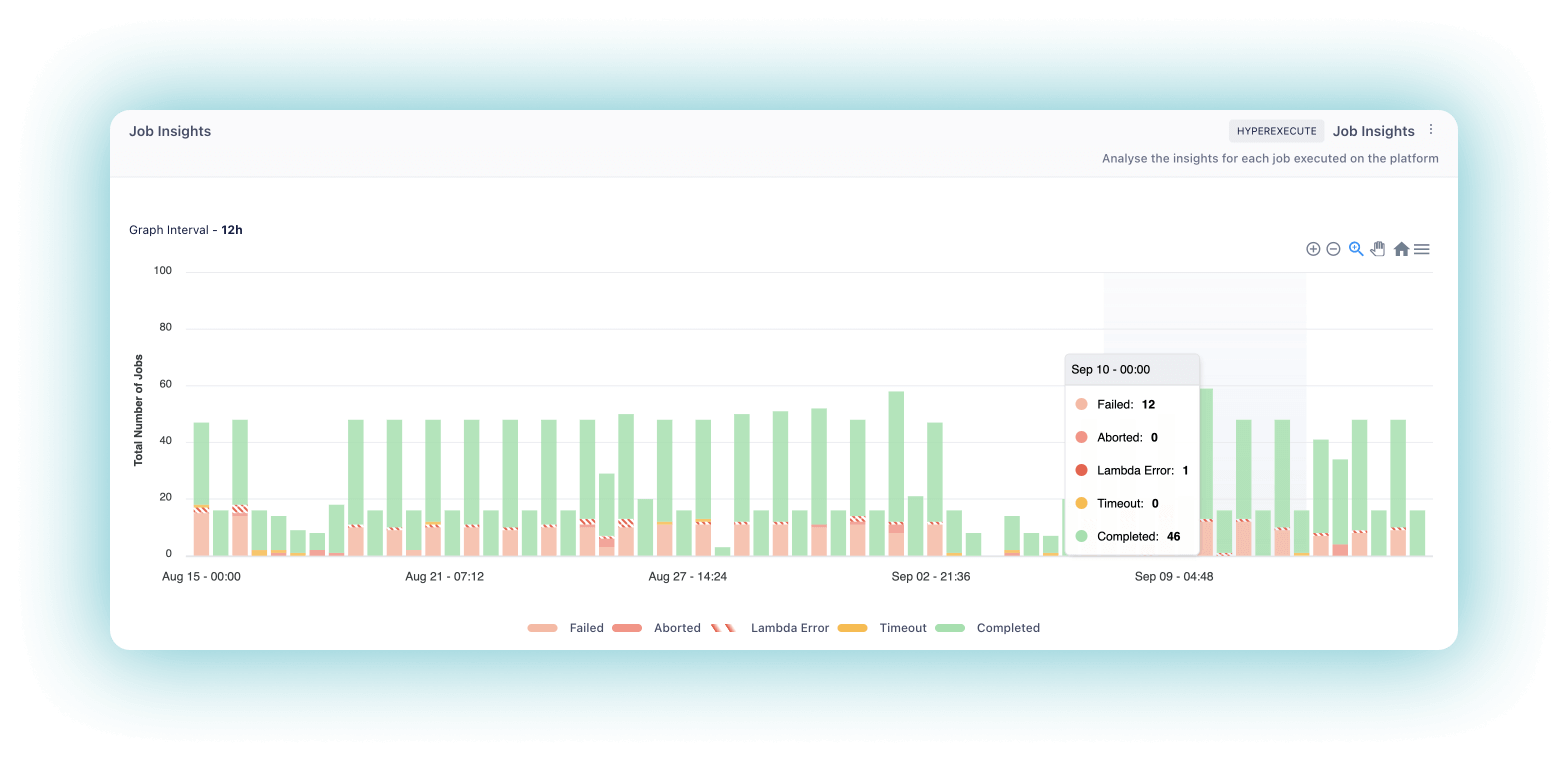
Suppose a QA wants to troubleshoot why a certain Job failed. He can use the status distribution of his team’s Jobs and drill down into each failed Job number to understand where the error lies and troubleshoot it.
Stage Trends
With the help of the Stage Trends widget, users can analyze the Stage trends for each Job executed on the platform categorized into Completed, Failed, Lambda Error, and Cancelled.
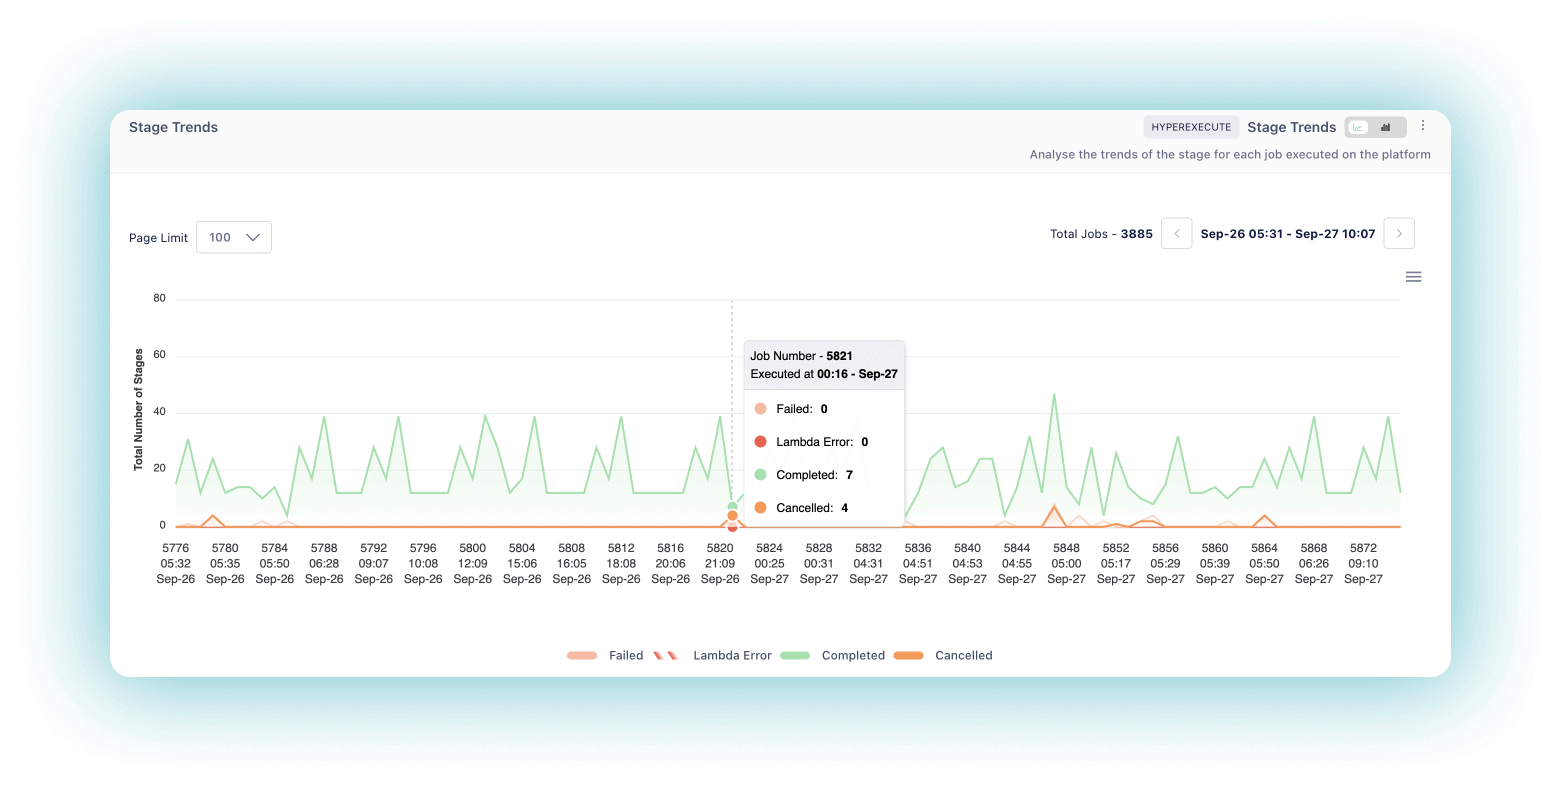
Suppose a quality assurance (QA) representative wants to know the status distribution of the Stages in the jobs executed by his team to understand why their application is failing. He can use this information to identify which stage of the Job is failing and get information about that particular stage.
Task Trends
Users can use the Task Trends widget to analyze trends in how their Lambda functions are used. The widget displays statistics for each Job executed on the platform, categorized into Completed, Failed, Aborted, Lambda Error, and Cancelled. Users can also filter by a specific date and time.
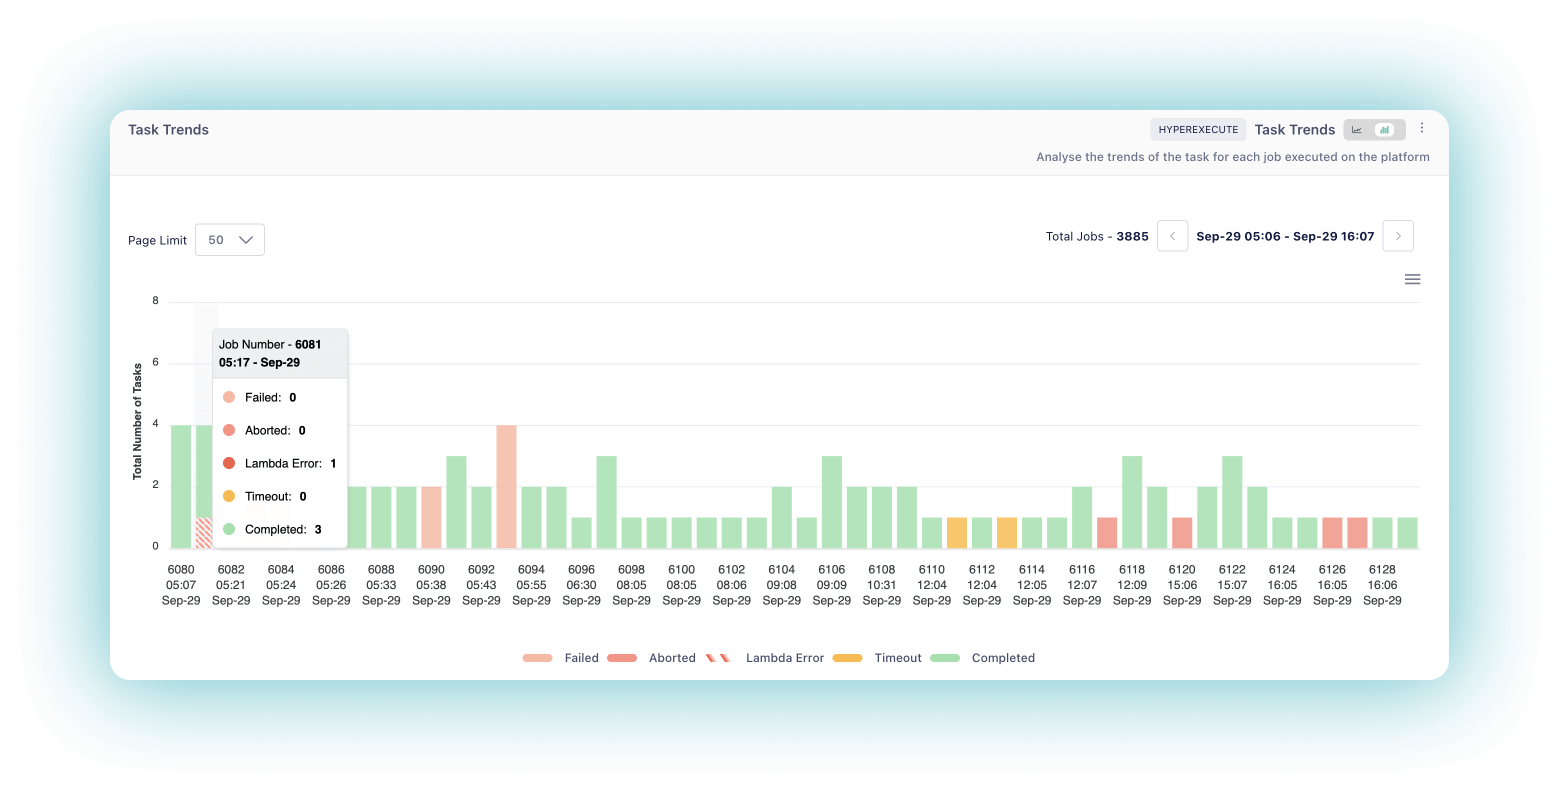
By identifying the status distribution of Tasks in Jobs and analyzing those results, a QA can determine if any particular Task is failing or underperforming, which may indicate an issue with the application.
Not only this, the newly launched LambdaTest Analytics would be launching more useful features to cater to your testing and test data analysis needs.
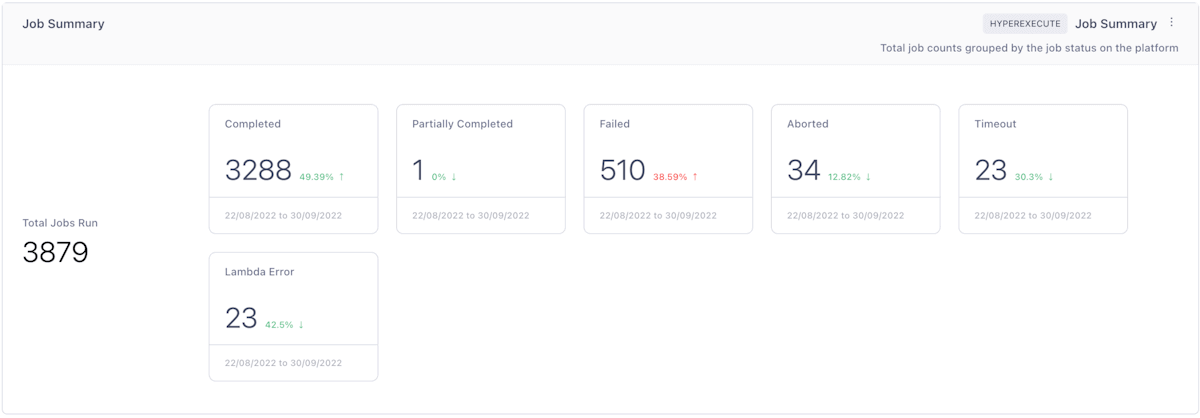
Job Summary
With the help of the Job Summary widget, users can easily track the number of Jobs being run on HyperExecute by their status, including Completed, Partially Completed, Failed, Aborted, and Timeout Jobs.
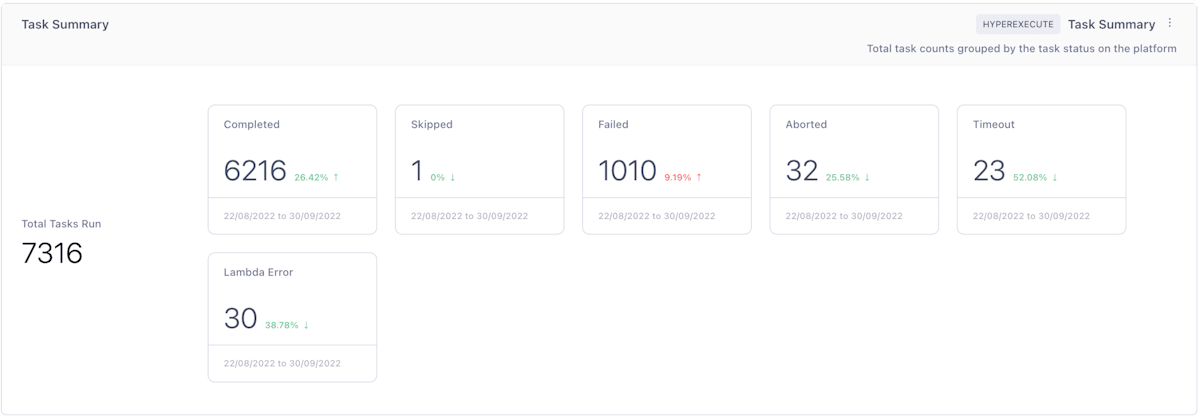
Task Summary
By implementing the Task Summary widget, users can track the total Tasks being executed in specific Jobs on HyperExecute. The widget groups each Task’s status, including Completed, Skipped, Failed, Aborted, Timeout, and Lambda Error.
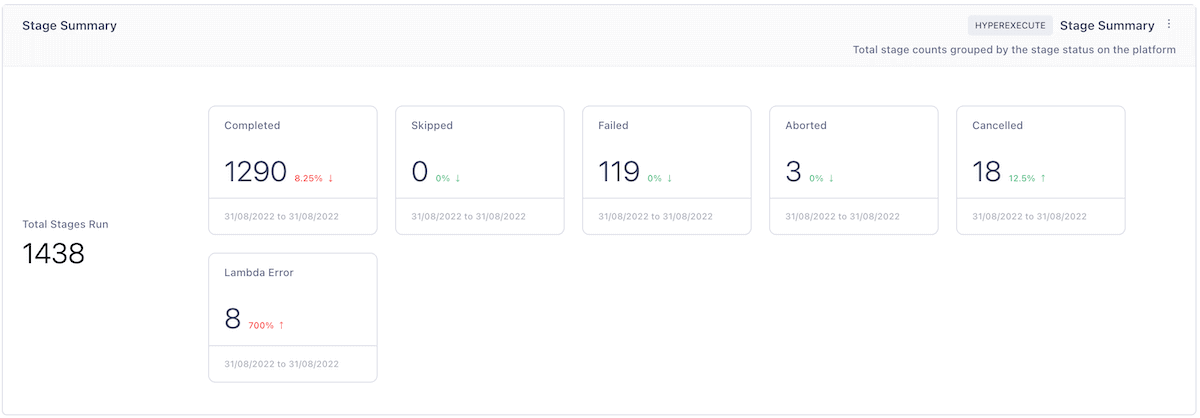
Stage Summary
The Stage Summary widget lets you track the total Stages being processed for every Task inside HyperExecute, grouped by status, including Completed, Skipped, Failed, Aborted, Cancelled, and Lambda Error.
Checkout LambdaTest HyperExecute on Microsoft Azure marketplace
Conclusion
The process of integrating data from multiple sources is complex, and organizations must consider this when testing their products.
With the previously unseen test data customization on LambdaTest Analytics, QAs and testers can easily unify their test execution data, build custom dashboards, and share real-time test execution data with a single click to make an informed decision.
Assess and share all your test analytics from a single dashboard with LambdaTest Analytics!
Happy Testing!


Author’s Profile
Devansh Bhardwaj
Devansh works as a Product Marketing Executive at LambdaTest. With a degree in Business Administration and a keen interest in technology, he loves to write about the latest technology trends.
Blogs: 44
Got Questions? Drop them on LambdaTest Community. Visit now