

Apr’23 Updates: The All-New LT Debug 2.0, Selenium Telemetry Logs, And More
Salman Khan
Posted On: May 3, 2023
![]() 24147 Views
24147 Views
![]() 6 Min Read
6 Min Read
Greetings, folks! The LambdaTest latest product updates are here. Our team has been hard at work to provide you with a seamless digital experience. In this release, we are excited to introduce the all-new LT Debug 2.0, a major upgrade to our debugging tool – LT Debug, offering improved performance and an enhanced user experience. To further enhance your debugging process, we’ve added Telemetry Logs for Selenium Debugging, making identifying and troubleshooting issues even easier.
And that’s not all – several other exciting new features and improvements are included in this release that will make your digital experience testing even smoother.
Without further adieu, here are the features to help you supercharge your workflows into action.
TABLE OF CONTENTS
Boost Your Debugging Game with LT Debug 2.0
LT Debug is a Chrome extension that combines online web design, development, and debugging tools with LambdaTest’s digital experience testing cloud to simplify and speed up your web development.
You can use its nine unique debugging features to improve the debugging process. To further enhance your debugging experience, we have introduced three additional powerful features in LT Debug 2.0:
- Record and Replay Tests
- CSS Inspector
- Color Picker
Record and Replay Tests
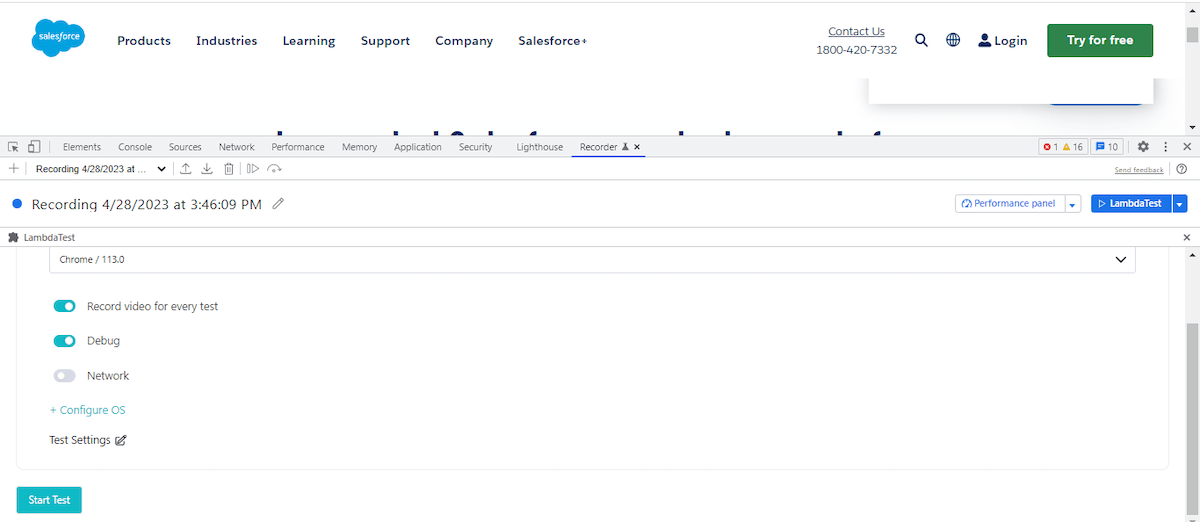
In LT Debug 2.0, you can record debugging process with the help of the Chrome recorder panel with zero knowledge of automation testing tools or scripts. LT Debug 2.0 lets you replay or retest user flows as automated tests using 3000+ browser and OS combinations without manually downloading and running the code. Additionally, developers do not have to install different programming language compilers and frameworks.
Using the record and playback tests feature in your testing process can be a game-changer. It can save you time and reduce errors by automating repetitive tasks and letting you concentrate on more critical aspects of your development work.
Record & Replay Tests across 3000+ real browser environments. Try LT Debug 2.0 now
CSS Inspector
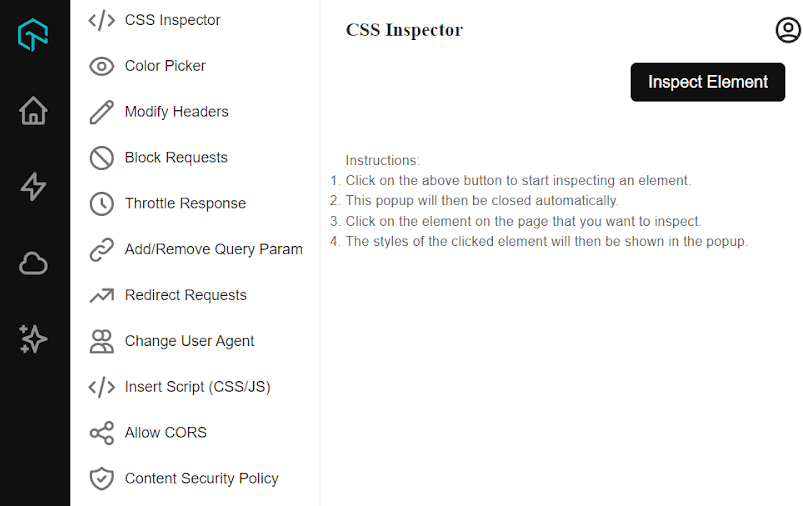
Using the CSS Inspector by LT Debug 2.0, you can select any HTML element on a web page and access its CSS properties. This enables you to make real-time adjustments to a website’s CSS rules, which can be helpful in different scenarios.
For example, it helps you troubleshoot layout issues, experiment with various color schemes, and enhance a website’s performance by identifying and eliminating unused CSS code.
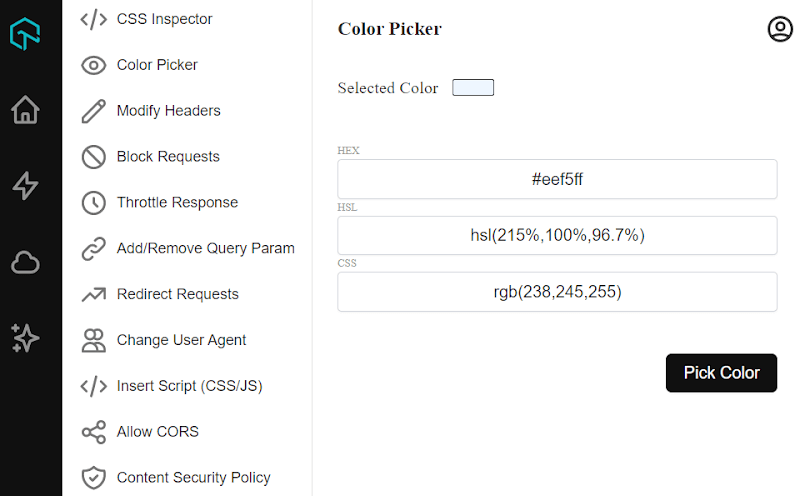
Color Picker
Using the Color Picker feature of LT Debug 2.0, you can get the color of any pixel on the screen with a click of a button. It allows you to select and apply colors to various elements of a web page, making it easier to debug and customize the visual appearance of your website.
Intrigued to know more about the above features? Read our blog to learn what’s new in LT Debug 2.0.
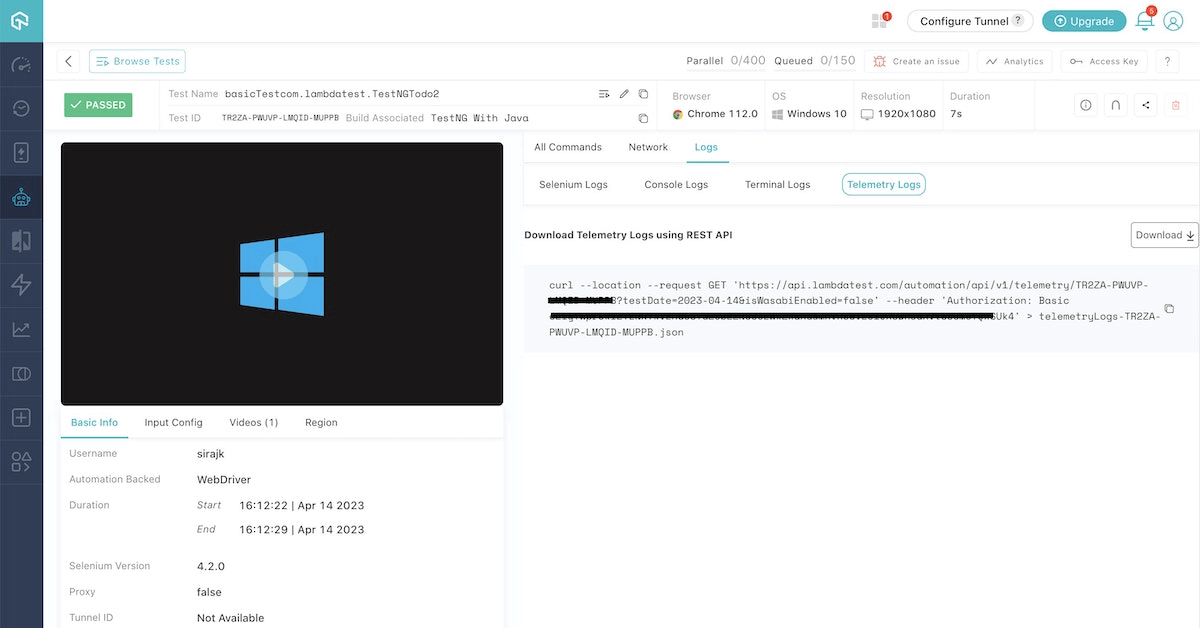
Live with Telemetry Logs for Selenium Debugging
We have now added support for Telemetry Logs for Selenium tests allowing you to take your debugging experience to the next level.
It is now much easier to gain a deeper understanding of your Selenium tests by using Telemetry Logs and identify issues faster than ever before when using Telemetry Logs. With Selenium 4 and OpenTelemetry integration, you can view the tracing of requests and event logs for each request to troubleshoot your test sessions.
Currently, we have provided the Selenium Telemetry Logs support on the following OSes:
- Windows 11
- Windows 10
- macOS Ventura
- macOS Catalina
- macOS Mojave
To enable the Telemetry Logs for Selenium testing, you need to:
- Pass the seTelemetryLogs capability in your test scripts and set it to true.
- Next, pass the selenium_version capability and set it as 4.2.0.
caps.setCapability("seTelemetryLogs", true);
caps.setCapability(“selenium_version”, “4.2.0”);
For more details, check our documentation Selenium Telemetry Logs
Latest Features in HyperExecute
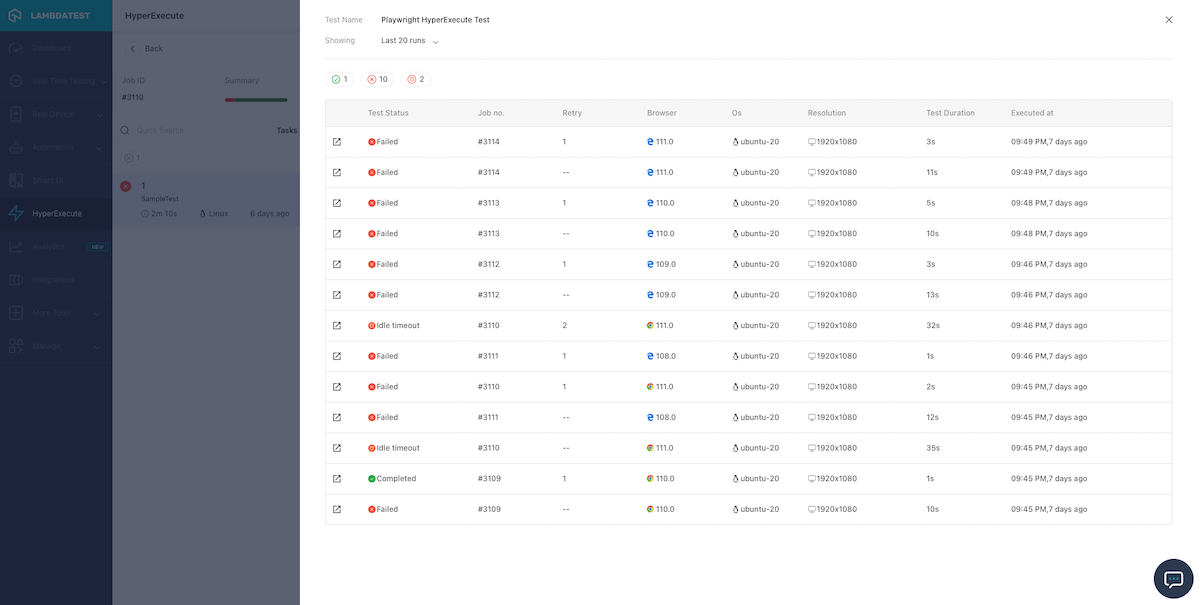
In the latest patch of the HyperExecute release, we have launched a couple of features, like the ability to view test case history, archiving jobs, and support for Appium testing on real devices. Let’s look at them one by one.
- With HyperExecute, you can now view the history of a test case, providing valuable insights. This lets you quickly determine if a test case failure is actually of value or has been failing frequently.
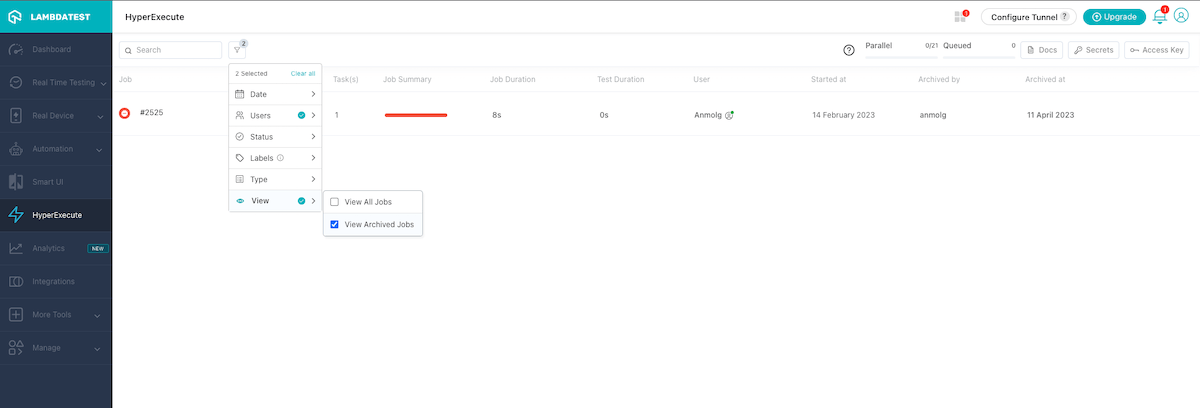
- We have added a feature to archive jobs that are no longer relevant or were aborted by your team. With this feature, you can group archived jobs in one location, making it easy to reference them in the future if needed.
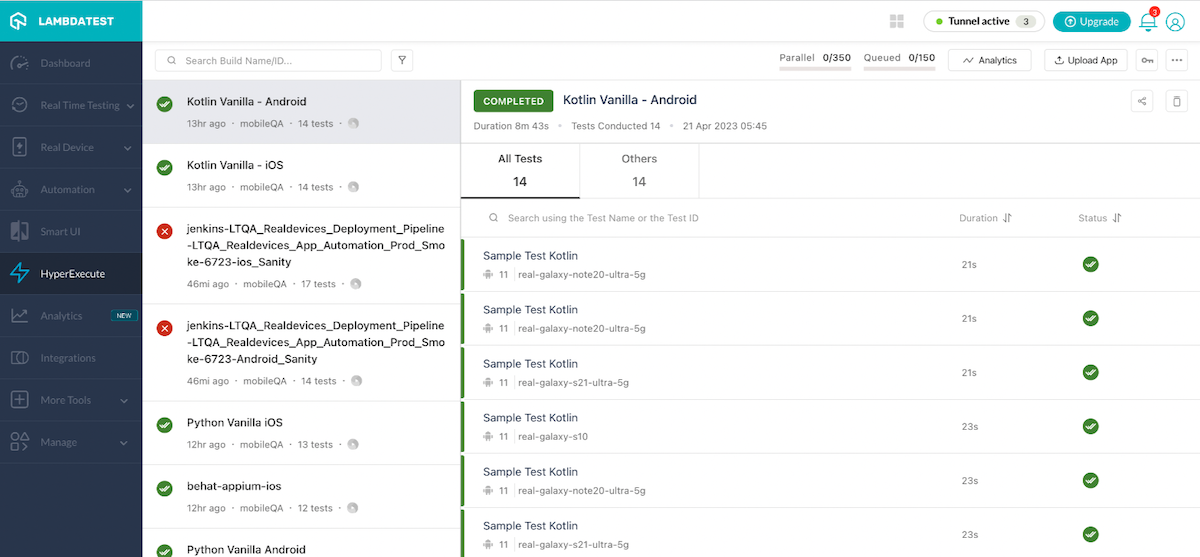
- HyperExecute now allows you to perform app test automation using the Appium framework on real devices. In addition, you can distribute and perform parallel testing, enabling faster and accelerated release cycles.
New HyperExecute Widget: Job Queue Time Trends
With the Job Queue Time Trends widget for HyperExecute, you can now easily visualize your job queue time using a time-series plot. This widget provides an overview of the efficiency of your testing pipeline by showing you how much time each job spends in the queue before test execution.
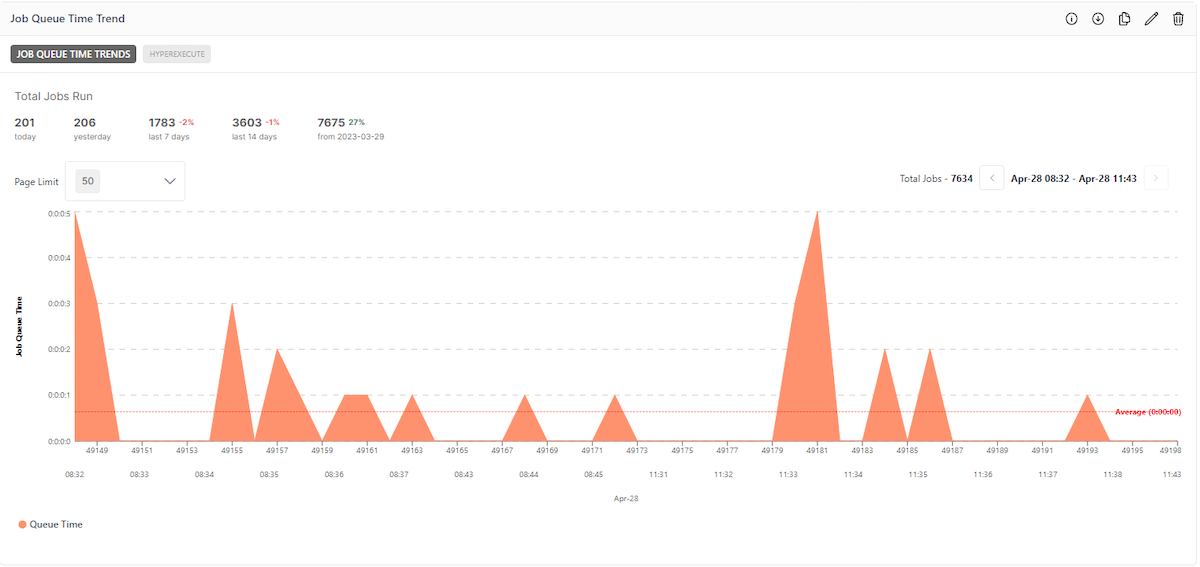
- Monitoring your job queue time helps you quickly identify potential bottlenecks and take necessary actions to improve the efficiency of your testing pipeline.
- This widget helps you make informed decisions about resource allocation, ensuring your test infrastructure is used optimally.
- You can easily share insights with your colleagues and team members to foster collaboration.
That’s a Wrap…
We hope these new features will supercharge your productivity. LambdaTest is constantly striving to bring in more exciting features for you on board. Do give a spin on these new features and share your feedback with us through our 24×7 Chat Support, support@lambdatest.com, or the LambdaTest Community.
In case you missed out on our previous features, catch up by checking our past Product Updates.


Author’s Profile
Salman Khan
Salman works as a Product Marketing Manager at LambdaTest. With over four years in the software testing domain, he brings a wealth of experience to his role of reviewing blogs, learning hubs, product updates, and documentation write-ups. Holding a Master's degree (M.Tech) in Computer Science, Salman's expertise extends to various areas including web development, software testing (including automation testing and mobile app testing), CSS, and more.
Blogs: 86
Got Questions? Drop them on LambdaTest Community. Visit now


