

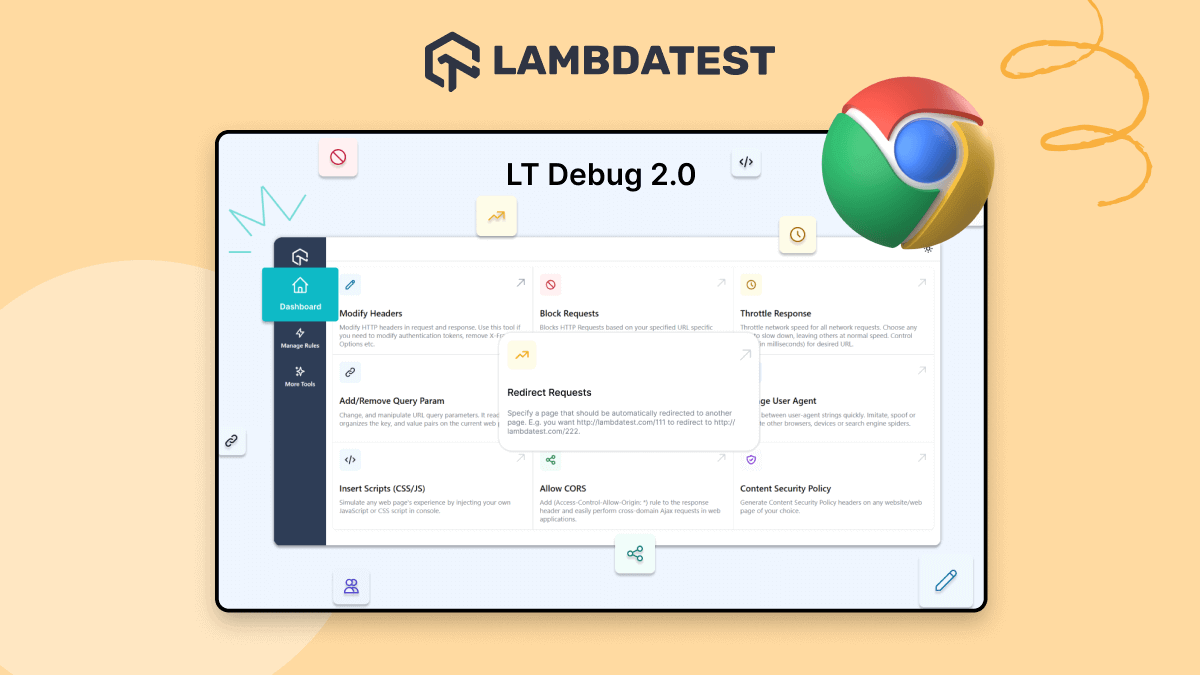
Simplify Your Debugging Process With Enhanced LT Debug 2.0
Devansh Bhardwaj
Posted On: April 28, 2023
![]() 28096 Views
28096 Views
![]() 6 Min Read
6 Min Read
After launching LT Debug in 2022, we got an overwhelming response from developers and testers across the globe. Achieving 1000+ active users per the Chrome Webstore in such a short time was indeed a milestone for us. But we at LambdaTest believe in striving for continuous betterment. So with valuable developer feedback and some brainstorming sessions, we brewed these magical upgrades that will surely take your debugging experience to the next level.
Without further ado, let’s take a deep dive into these new features of LT Debug 2.0. that are in store for you!
What’s New in LT Debug 2.0?
For those of you who don’t know what LT Debug is, let me give you a brief introduction.
After listening to the requests of many awesome testers needing a debugging tool, our team of talented engineers developed this simple and free Chrome extension called LT Debug. It provides web developers and testers with more than nine unique debugging features that can be used to dramatically improve their daily debugging process.
To make your debugging experience even more seamless, we have now introduced three more powerful features, which are as follows:
- Record and Replay Tests with LambdaTest
- CSS Inspector
- Color Picker
Record and Replay Tests with LambdaTest
LT Debug 2.0 enhances the debugging experience by allowing developers and testers to record their debugging process with the help Chrome recorder panel. Developers can now record test cases with zero knowledge of automation testing tools or scripts. LT Debug 2.0 extension allows users to replay or retest user flow as an automated test on 3000+ browser and OS combinations on the LambdaTest cloud grid without downloading the code and running it manually on their local machine.
Along with this, developers do not require installing compilers and frameworks for different programming languages.
To access the Chrome recorder, head to More tools > Developer tools > Recorder.
Here are the steps to use the recorder feature:
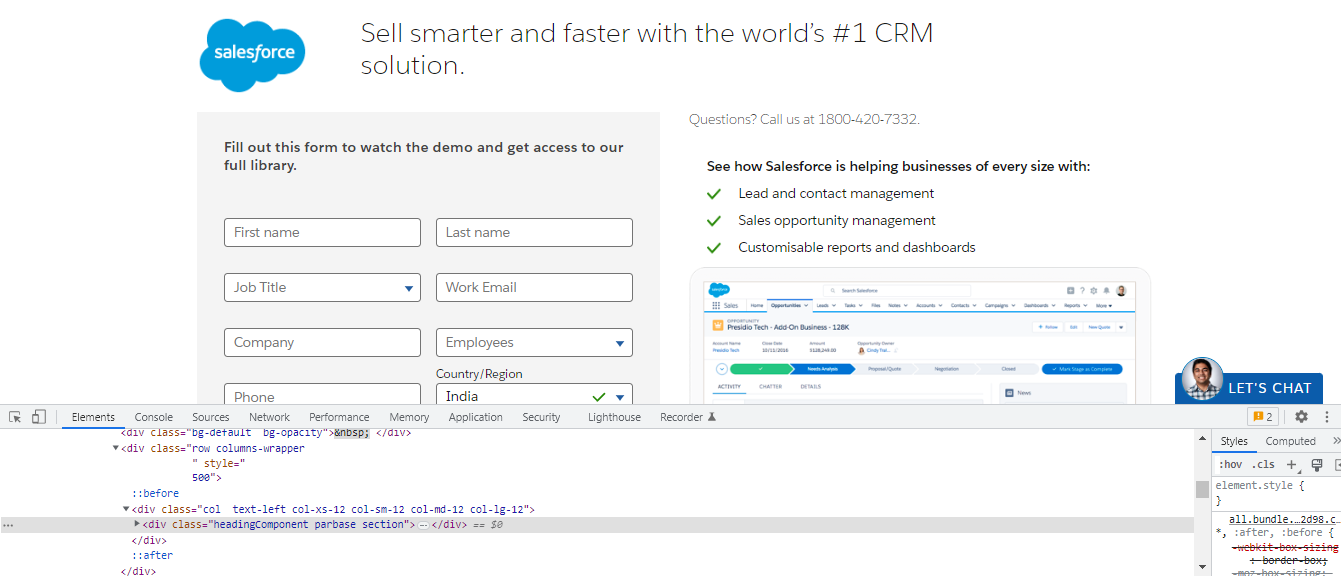
- Open Chrome DevTools by inspecting the webpage.
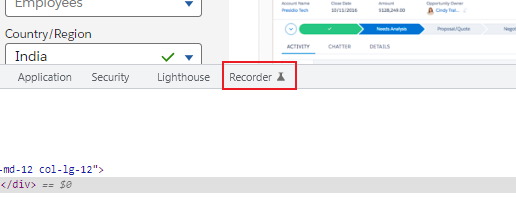
- Head to the Recorder tab.
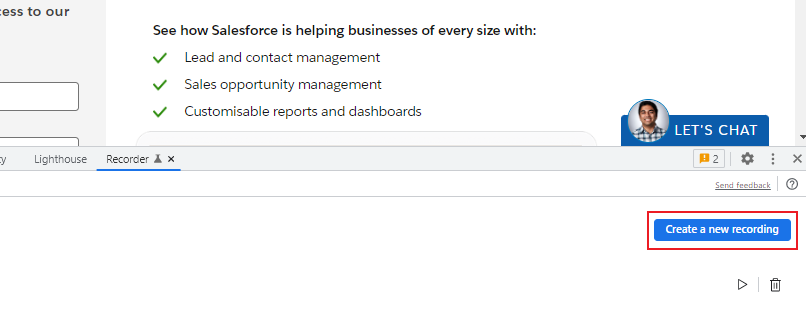
- Click Create a new recording.
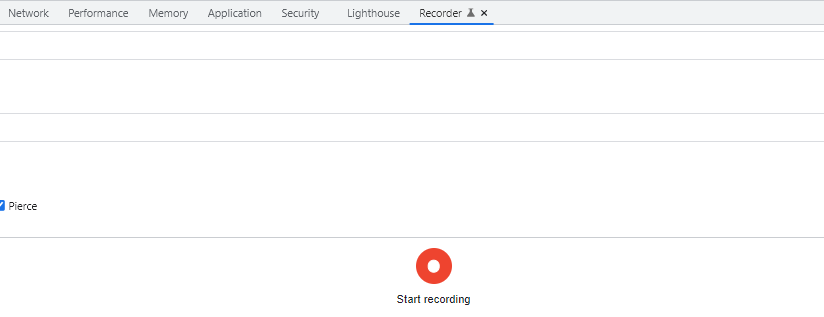
- Click Start recording.
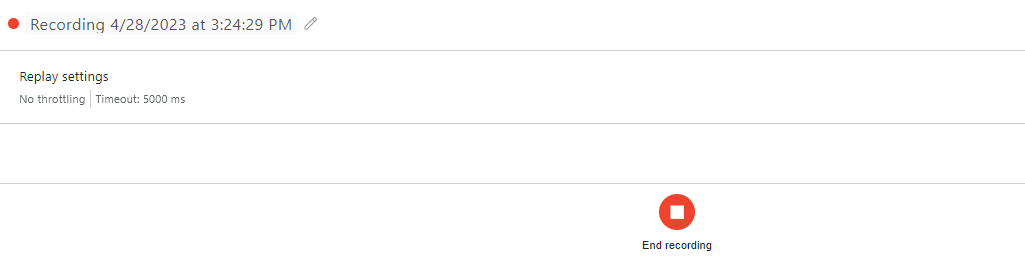
- After recording the user flow, click on End recording.
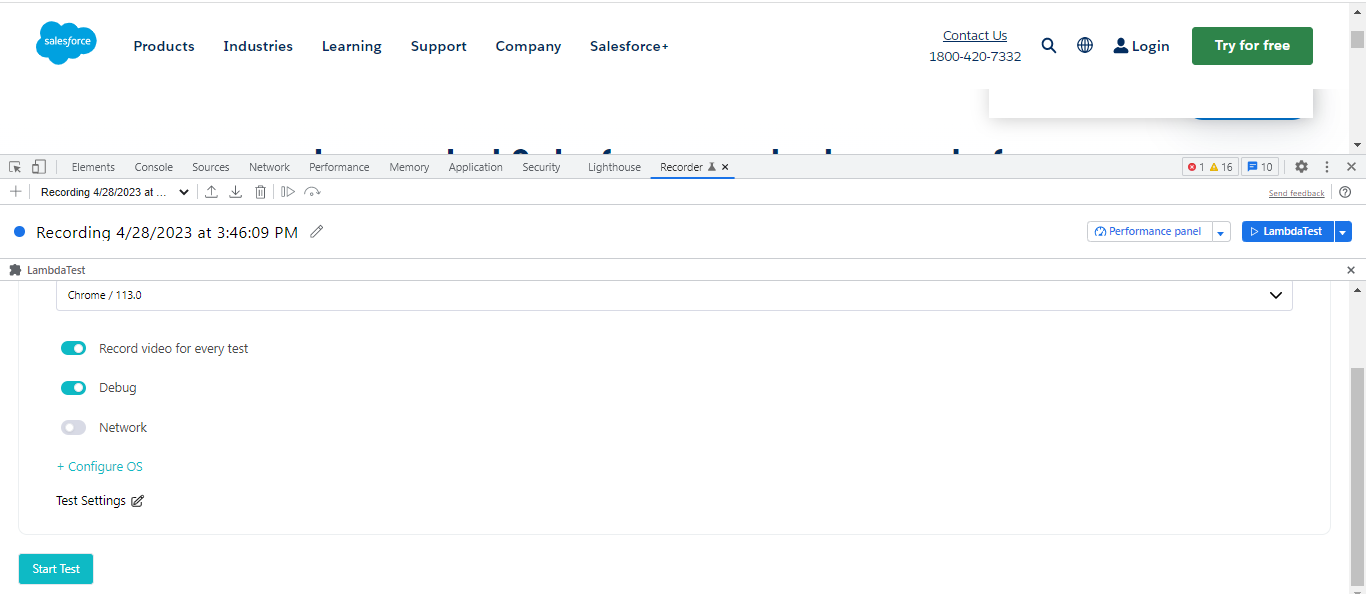
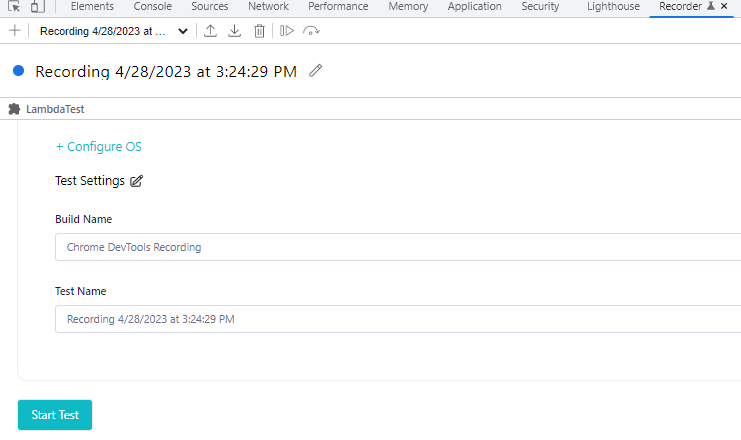
- Once you click on End recording, a LambdaTest replay icon will appear. Select the LambdaTest replay icon.
- Now configure your test capabilities like Browser/OS Version, Build Name, and Test Name, and click Start Test.
You will be redirected to your LambdaTest Automation Dashboard, where your recently recorded test session will be present.
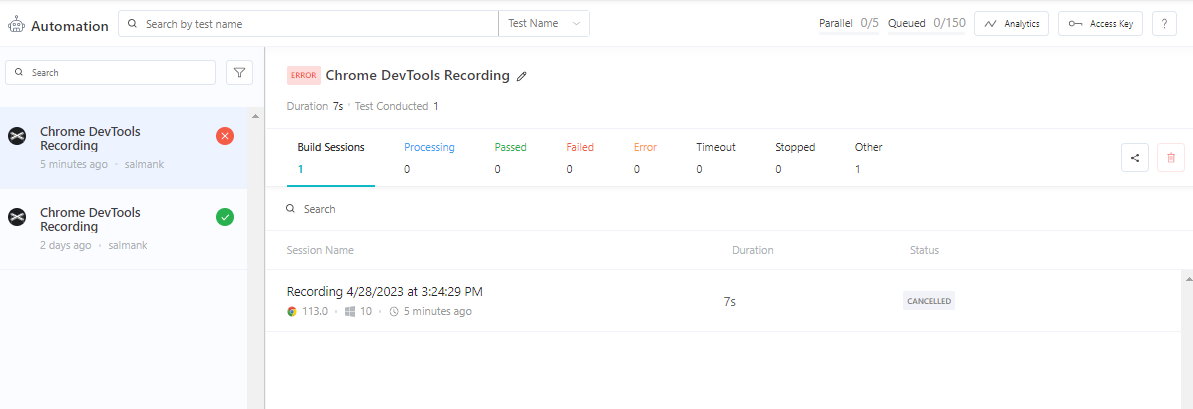
Record your user flow across 3000+ environments. Try LT Debug 2.0 now!!
CSS Inspector
With the CSS Inspector feature, developers can now access the CSS properties of any HTML element by selecting that element on the webpage.
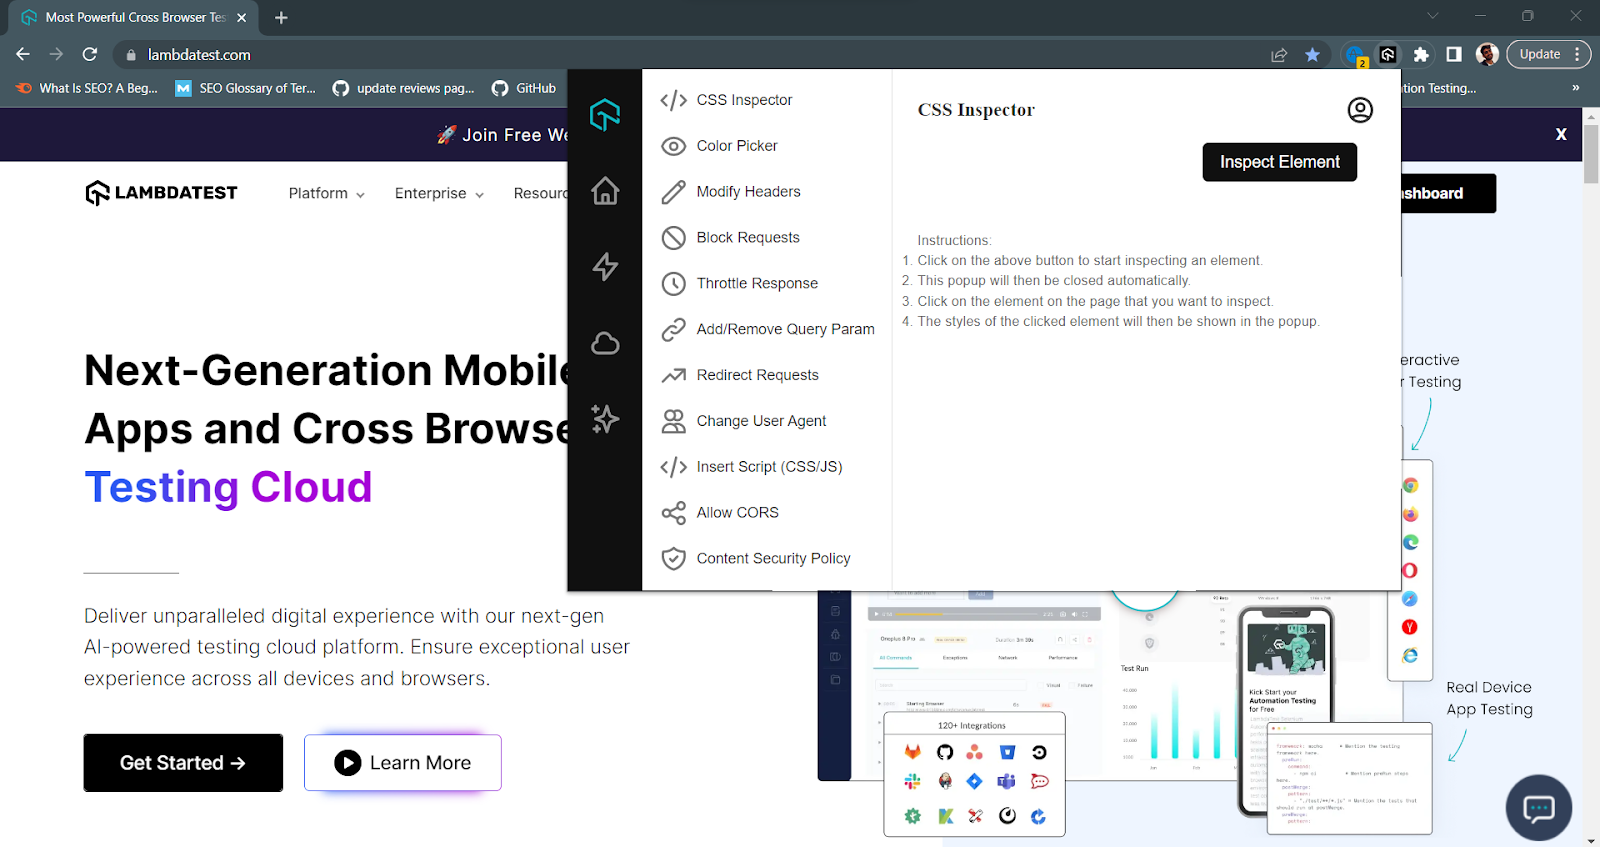
Developers can use the CSS inspector feature to make changes to a website’s CSS rules in real-time, which is helpful for debugging layout issues, testing different color schemes or font choices, or optimizing a website’s performance by identifying and removing unused CSS code.
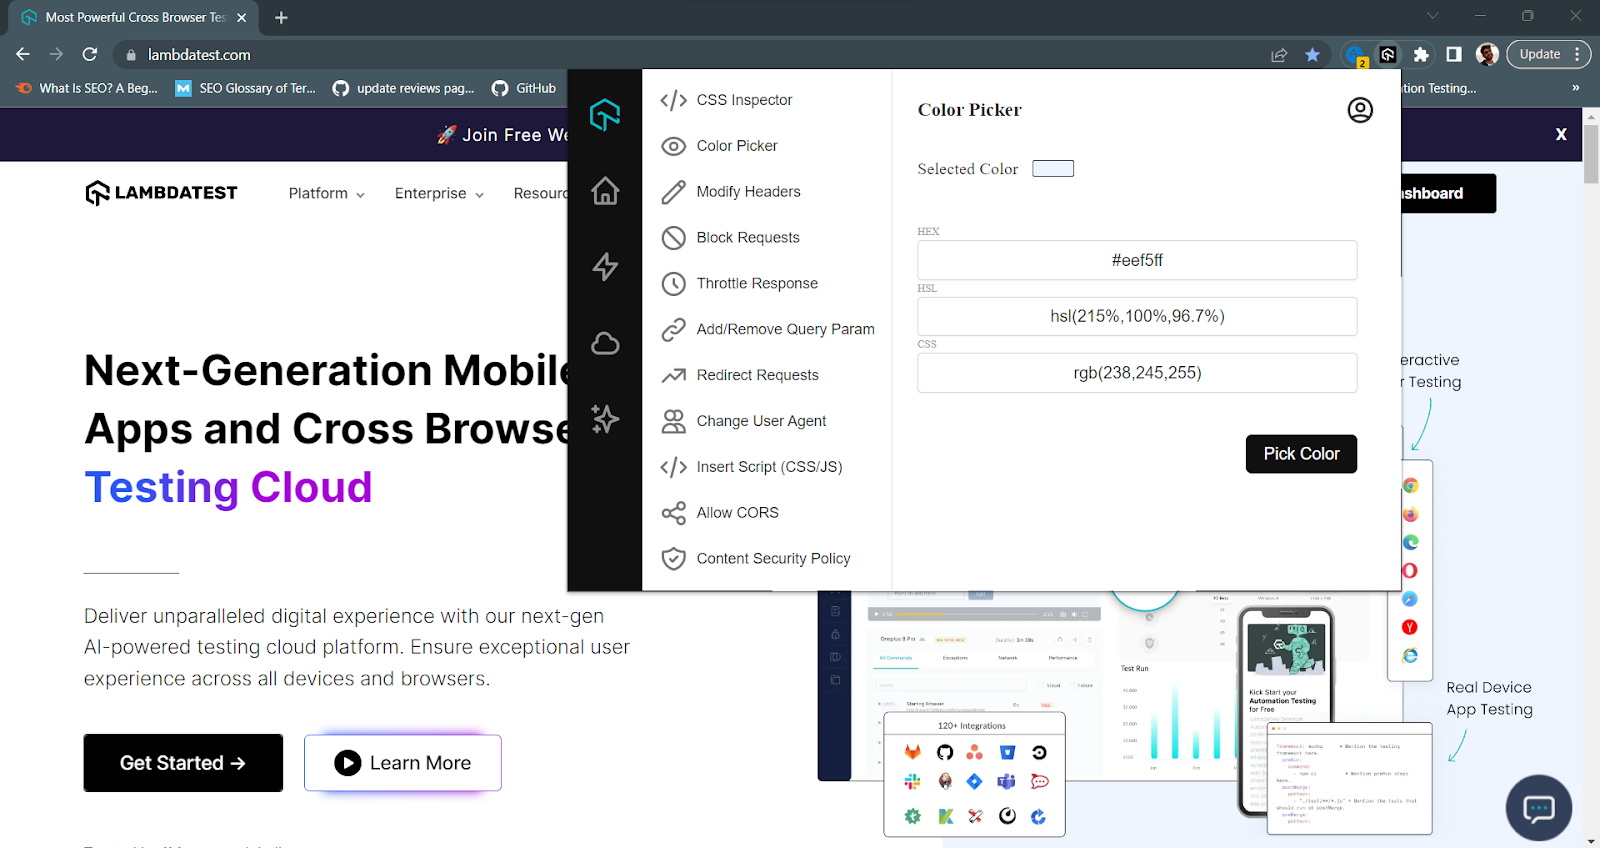
Color Picker
The all-new Color Picker feature allows developers to get the color of any pixel on the screen with a single click on the extension. With this feature, developers can select and apply colors to various elements of a web page or application, making it easier to debug and customize the visual appearance of the interface.
Other Top Features of LT Debug 2.0
However, if you haven’t got the chance to try LT Debug, here are a few reasons why it could be your perfect debugging tool.
- Add/Modify Headers
Using this feature, developers can add or remove headers on the fly. This enables them to test a website’s request headers and modify them as needed.
- Block Requests
LT Debug allows you to block HTTP requests based on your specific URL filter conditions. This feature makes it easy to filter out unwanted requests as needed.
- Throttle Response
With this feature, you can control the speed of your network requests to optimize your bandwidth. You can choose a specific URL to slow down your connection or set a specific URL to have normal-speed connections. You can also choose if you want a millisecond delay when requesting that URL.
Speed up your website without diving into Chrome element inspector. Only some users would have access to 4G or 5G. You can also check your website performance in a slow 3G network to understand its performance in such geographical areas.
- Add/Remove Query Param
This feature lets you easily change and modify the URL query parameters. URL parameters are used to read and organize key-value pairs present on a web page. This simplifies debugging by allowing you to modify page elements without reloading it each time.
- Redirect Requests
Use the redirect request tool to ensure that all links to a particular URL are redirected to another address.
- Change User Agent
You can simulate, imitate, and spoof different browsers, devices, and search engine spiders. To perform cross browser testing, you should switch between different user-agent strings. You can easily switch between other user-agent strings in a faster manner.
- Insert Scripts (CSS/JS)
Simulate the web page experience as soon as you inject the CSS or JavaScript into your code.
- Allow CORS
If you want to perform cross-domain Ajax requests faster, adding the (Access-Control-Allow-Origin: *) rule to your response header will allow you to do so. For example, you can bypass CORS on lambdatest.com when you turn it on while accessing the resources.
If you want to know more about LT Debug and how you can install it on your system, check out our detailed blog about Introducing LT Debug.
Conclusion
We hope these new features will enhance your debugging experience and help you deliver seamless products. We at LambdaTest consistently innovate and brainstorm new features and ideas to add maximum value to the developers’ lives. Debugging will be a breeze for web developers and testers with LT Debug 2.0. You can also depend on our 100+ free online tools to make your testing life seamless.
Happy debugging!


Author’s Profile
Devansh Bhardwaj
Devansh works as a Product Marketing Executive at LambdaTest. With a degree in Business Administration and a keen interest in technology, he loves to write about the latest technology trends.
Blogs: 46
Got Questions? Drop them on LambdaTest Community. Visit now


