Building Observability In Distributed Systems
Matt Heusser
Posted On: May 9, 2023
![]() 14693 Views
14693 Views
![]() 7 Min Read
7 Min Read

Last time I wrote about the advantages of observability for DevSecOps. Let’s say you are convinced and want to implement it. Now what?
Today I’ll explain the options to implement observability, particularly in a distributed system. By distributed I mean multiple servers, likely connecting over APIs. This could be a mobile app connecting to APIs, or a web application that delivers static web pages populated by API results. Modern microservices patterns can lead to a confusing “layer upon layer” architecture; this article describes how to make that manageable.
Begin with the end in mind
The three “pillars” of observability are metrics, logs, and tracing. Depending on your organization’s needs, you might need some (or all) of them, and getting one category might be wildly more difficult than another. Understanding the benefits of each, your needs, and the relative cost, will make the project easier.
Logs are the building block under which observability is built. These represent a recording of what happens for every important, relevant event in the system. They could be recorded in a database or simply in a text file on each server. Without logs, figuring out where a distributed problem went wrong is incredibly expensive, if possible at all. With logs, it is only difficult. That makes logs the first step toward observability.
Metrics provide a high-level overview of what is happening in the different services. That can include how often a service is on time, mean delay at the service, network propagation delay, percentage of service calls that are errors, and timeouts. Beyond “mean” (average) other interest metrics include top 25%, bottom 25%, segmenting calls by origin or customer class, as well as domain-specific cases, such as credit rating, if a procedure is covered by health insurance, and so on.
Tracing is the third step down – the ability to understand exactly what happened on a request. With Tracing a tester or service representative can look at the user or sessionID and find out exactly which APIs were called, in what order, with which input data, which took how long, and produced which result. You can think of tracing data as similar to a “call stack” error in a monolithic program.
Flow Graphs are a visual representation of the network flow within a system. They can provide the status (green, yellow, red colors), volume (depth of color), and delay information (perhaps through a mouse over or right click). By clicking into details, it may be possible to see metrics or even log summary data in a relevant, column format. In this way, flow graphs combine metrics, logs, and tracing to provide aggregate (average) or detailed information about the customer experience as it works through a system. This makes finding bottlenecks, for example, a visual experience.
Once you understand what the company needs, it is time to consider an approach.
 Note
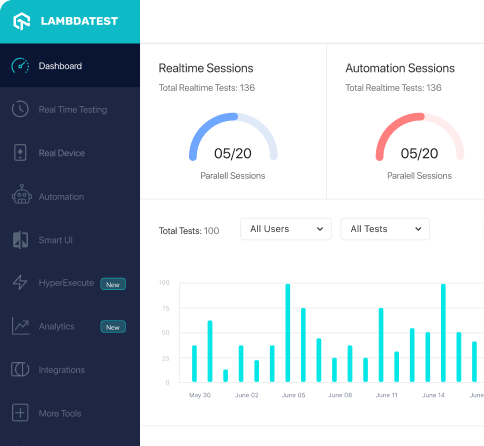
NoteYou can use LambdaTest Cloud to test on a variety of simulators, emulators and real devices. No need to install anything, just sign up for a free account and start testing.
Decide where to record and how to aggregate
Making the data observable is the job of Telemetry – the automatic measurement of data from remote sources. The three major ways to do this are to have the APIs record themselves (application layer), to use infrastructure to inject a recorder, or to purchase a tool to observe the data.
An application layer solution is a fancy way of saying “code it yourself.” This could be as simple as having each API drop its data into a log file. APIs will have similar data (request, response, HTML code, time to live), so it might be possible to have the API write to a database – or you could have a separate process reading the log and writing to the database. If the log includes the sessionID, UserID, requestID, and a timestamp, it might be possible to build tracing through a simple query sorted by time. Another approach is to have a search engine tool, such as splunk, index the logs. This can provide many of the benefits of observability for a modest investment. If that isn’t good enough, you may need a more cloud-native approach.
An infrastructure solution will rely on the nature of the software. For example, if the company uses Kubernetes and Docker, it may be possible to create additional containers, or “sidecars” that sit in the middle and monitor and record traffic. Prometheus, for example, is an open-source tool for Kubernetes that can provide metrics for APIs out-of-the-box, often paired with Graphite to produce trend and history graphs. Zipkin and Jaeger are two open-source tracing tools that are cloud native.
A third approach is to purchase a tool. These can generally work in most environments. It will be the vendor’s job to figure out how to work with containers, your data center, the cloud, as well as how to track, graph, trace, and visualize the data. AppDynamics, for example, attaches every server with an agent; each agent reports traffic back to a controller. The tool can also simulate real workflows with synthetic users, tracking performance over time. That makes it possible to not only find errors within seconds of their emergence but also identify bottlenecks as they emerge before they become a serious problem.
Pros and Cons, Tips and Tricks
You’ll notice that these tools tend to work in one of three ways. Either they create a protocol where the API writers can log things themselves, or else make the API automatically write to a log (for example making API classes inherit from a meta-class that has built-in behavior), or else they spy on the traffic and send that information on to a collector. Once the data is in some kind of database, reporting is a secondary concern.
The problem here is space and bandwidth.
Logs can take up a great deal of space, but no bandwidth. Companies can also create a log rotation policy, and either offline store or just delete the data after some time. Reporting databases tend to be more permanent, but contain less data. The real problem can come with the reporting tools that use the internet to send data back to a controller. If they try to re-send every message in real-time, that can essentially double the traffic on the internal network. In the cloud that can lead to unnecessary expense. If there are any restrictions on bandwidth, the doubling of traffic can cause congestion. If the project started because the software was slow in the first place … lookout.
When experimenting with these tools, start with the most problematic subsystem at a time. Typically testers, programmers, network administrators, and product owners know what that subsystem is. Do a small trial. If that doesn’t provide enough information and network monitoring is in place, do a slow rollout. One common pattern is to use synthetic monitoring plus metrics to cover the entire network, and only have tracing data available for the most problematic systems.
Getting Started
First, identify the problem you’re looking to resolve. If every developer and customer service representative has problems debugging any requests, the answer might be full tracing and flow throughout the system. Either way, the next step is likely to experiment with several approaches in a test environment. Building observability is an infrastructure project, not that much different than software development. The ideal approach may be to handle it as a platform engineering project. That is, build the capability for product management to understand the holistic flow through the system, but also the capability for engineering teams to build their own telemetry as they need it. Create the architecture for traceability, then let the teams turn on what they need for debugging and problem resolution. If that isn’t enough, product management can schedule more development, just like any other feature.
It’s been sixteen years since Ed Keynes claimed that “Production Monitoring, sufficiently advanced, is indistinguishable from testing.” He wasn’t wrong then, and he’s even less wrong today.
Got Questions? Drop them on LambdaTest Community. Visit now


