How To Avoid Memory Leaks In JavaScript
Nikhil
Posted On: December 3, 2018
![]() 75423 Views
75423 Views
![]() 19 Min Read
19 Min Read
If you are wondering why your Javascript application might be suffering from severe slowdowns, poor performance, high latency or frequent crashes and all your painstaking attempts to figure out the problem were to no avail, there is a pretty good chance that your code is plagued by ‘Memory Leaks’. Memory leaks are fairly common as memory management is often neglected by developers due to the misconceptions about automatic memory allocation and release in modern high level programming languages like javascript. Failure to deal with javascript memory leaks can wreak havoc on your app’s performance and can render it unusable. The Internet is flooded with never-ending complex jargon which is often difficult to wrap your head around. So in this article, we will take a comprehensive approach to understand what javascript memory leaks are, its causes and how to spot and diagnose them easily using chrome developer tools.
What are JavaScript Memory Leaks?
A Memory leak can be defined as a piece of memory that is no longer being used or required by an application but for some reason is not returned back to the OS and is still being occupied needlessly. Creating objects and variables in your code consumes memory. Javascript is smart enough to figure out when you won’t need the variable anymore and will clear it out to save memory. A Javascript memory leak occurs when you may no longer need an object but the JS runtime still thinks you do. Also, remember that javascript memory leaks are not caused by invalid code but rather a logical flaw in your code. It leads to the diminished performance of your application by reducing the amount of memory available for it to perform tasks and could eventually lead to crashes or freezes.
Before diving deeper into memory leaks, it is crucial to have a sound understanding of memory cycles, memory management systems and garbage collector algorithms.
What is Memory Cycle?
A ‘memory’ consists of a series of flip-flops, which is a 2-state(0 & 1) circuit composed of 4 to 6 transistors. Once flip-flop stores a bit, it will continue to retain it until it is rewritten with the opposite bit. So memory is nothing but an array of reprogrammable bits. Each and every single piece of data being used in a program is stored in the memory.
Memory Cycle is the complete sequence of events for a unit of memory to go from an idle/free state through a usage(read or write) phase and back to the idle state. Memory cycle can be broadly broken down to 3 major steps –

-
- Memory Allocation: memory is allocated by the OS to the program during execution as per need. In low level languages like C and C++ this step is handled by the programmer but in high level languages like javascript, this is done on its own by the automatic memory management system. Some examples of memory allocation in javascript –
|
1 2 3 4 5 6 7 8 9 10 11 |
var n = 5; // allocates memory for a number var s = 'Hello World'; // allocates memory for a string var obj = { // allocates memory for an object a: 100, b: "some string", c: null, }; var arr = [100, "some string", null]; // allocates memory for the array function foo(x, y) { // allocates memory for a function return x * y; } |
- Memory Usage: Program performs read and write function on the allocated memory. This can be reading or writing the value of a variable, an object or even passing an argument to a function.
- Memory Release: when the task is finished and allocated memory is no longer needed, it is released and made free for new allocation.
The third step of the memory cycle is where the complications lie. The most difficult challenge here is to determine when “the allocated memory is not needed any longer and should be freed”. This is where memory management systems and their garbage collector algorithms come to the rescue.
You can take this certification as proof of expertise in the field of test automation with JavaScript to empower yourself and boost your career.
Here’s a short glimpse of the Selenium JavaScript 101 certification from LambdaTest:
Memory Management Systems – Manual vs Automatic
Memory Management is the process of assigning memory blocks to various programs during execution at their request, and free it for reallocation when no longer needed. Different programming languages use different approaches depending upon their complexity to deal with memory management.
- Low-level languages like Pascal, C and C++, have manual memory management system where the programmer must manually/explicitly allocate memory when needed and then free up the memory after it has been used by the program. For example, C uses malloc() and calloc() to reserve memory, realloc() to move a reserved block of memory to another allocation and free() to release memory back to the system.
- High-level programming languages like Javascript and VB have an automated system that allocates memory each time you create an entity like – an object, an array, a string, or a DOM element and automatically frees it up when they are not used anymore, by a process called garbage collection. Memory leaks happen when your program is still consuming memory, which ideally should be released after the given task was completed. For some reason, the garbage collector fails to serve its purpose and the program refuses to release the memory, which keeps on being consumed without any need for it to happen.
Garbage Collectors
Garbage collectors execute the process of finding memory which is no longer in use by the program and releasing it back to the OS for future reallocation. To find the memory which is no longer being used, garbage collectors rely on algorithms. Though the garbage collection method is highly effective, it is still possible for Javascript memory leaks to occur. The main cause for such leaks is very often- ‘unwanted reference’. The primary reason for this is the fact that garbage collection process is based on estimations or conjectures, as the complex problem of whether some memory needs to freed cannot be determined by an algorithm correctly at every instance.
Before moving further, let’s take a look at the two most widely used GC Algorithms
As we discussed earlier, any garbage collection algorithm must perform 2 basic functions. It must be able to detect all the memory that is no longer in use and secondly, it must free/deallocate the space used by the garbage objects and make it available again for reallocation in future if needed.
The 2 most popular algorithms are –
- Reference count
- Mark and Sweep
-
-
Reference Count Algorithm
This algorithm relies on the notion of ‘reference’. It is based on counting the number of reference to an object from other objects. Each time an object is created or a reference to the object is assigned, it’s reference count is increased. In JavaScript every object has an implicit reference to its prototype and explicit reference to its property values.
Reference count algorithm is the most basic garbage collector algorithm, It reduces the definition of “an object is not needed anymore” to “an object has no other objects referencing it”. An object is considered garbage collectible and deemed to be no longer in use if there are zero references pointing to it.
12345678910111213141516<script>var o = { // 2 objects are created. One is referenced by the other as one of its properties.a: { // The other is referenced by virtue of being assigned to the 'o' variable.b: 2; // Obviously, none can be garbage-collected}};var o2 = o; // the 'o2' variable is the second thing that has a reference to the objecto = 1; // now, the object that was originally in 'o' has a unique reference embodied by the 'o2' variablevar oa = o2.a; // reference to 'a' property of the object.This object now has 2 references: one as a property,// the other as the 'oa' variableo2 = 'yo'; // The object that was originally in 'o' has now zero references to it. It can be garbage-collected.// However its 'a' property is still referenced by the 'oa' variable, so it cannot be freedoa = null; // The 'a' property of the object originally in o has zero references to it. It can be garbage collected.};</script>Drawback of reference count algorithm
There is however a big limitation to reference counting algorithm in case of cycles. Cycle is an instance where 2 objects are created by referencing to one another. Since both the objects have a reference count of at least 1(referenced at least once by each other), the garbage collector algorithm does not collect them even after they are no longer in use.
-
|
1 2 3 4 5 6 7 8 9 10 11 |
<script> function foo() { var obj1 = {}; var obj2 = {}; obj1.x = obj2; // obj1 references obj2 obj2.x = obj1; // obj2 references obj1 return true; } foo(); </script> |
-
Mark-and-sweep Algorithm
Unlike the reference count algorithm, Mark-and-sweep reduces the definition of “an object is not needed anymore” to “an object is unreachable” rather than “not referenced”.
In javascript, the global object is called ‘root’.Garbage collector will first find all the root objects and will map all references to these global objects and references those object, and so on. Using this algorithm, the garbage collector identifies all the reachable objects and garbage collects all the unreachable objects.
Mark-and-Sweep Algorithm works in 2 phases:
-
Mark phase
Every time an object is created, its mark bit is set to 0(false). In the Mark phase, the mark bit of every ‘reachable’ object is changed and set to 1(true)
-
Sweep phase
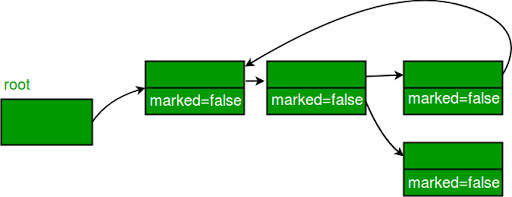
All those objects whose mark bit is still set to 0(false) after the mark phase are unreachable objects and hence they are garbage collected and freed from memory by the algorithm.
All the objects initially have their marked bits set to 0 (false)

All Reachable objects have their marked bits changed to 1 (true)
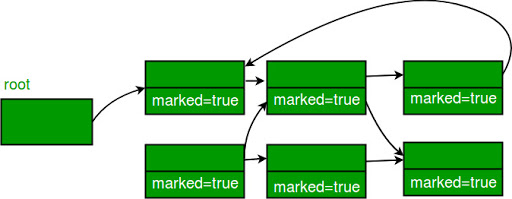
Non reachable objects are cleared from the memory.
Advantages of Mark-and-Sweep Algorithm
Unlike reference count algorithm, mark-and-sweep deals with cycles. the 2 objects in a cycle are not referenced by anything reachable from the root. They are deemed unreachable by the garbage collector and swept away.
Drawbacks of Mark-and-Sweep Algorithm
The main disadvantage of this approach is that program execution is suspended while the garbage collector algorithm runs.

Causes of Javascript Memory Leaks
The biggest key to prevent Javascript memory leaks lies with the understanding of how unwanted references are created. Depending upon the nature of these unwanted references we can categorise memory sources into 7 types:
1. Undeclared/Accidental Global Variables
JavaScript has two types of scopes – Local scope and global scope. Scope determines the visibility of variables, functions, and objects during runtime.
- Locally scoped variables are only accessible and visible within their local scopes (where they are defined). Local variables are said to have ‘Function scope’: They can only be accessed from within the function.
1234567<script>// Outside myFunction() variable ‘a’ cannot be accessedfunction myFunction() {var a = "This is a local scope variable";// variable ‘a’ is accessible only inside myFunction()}</script> - On the other hand Globally scoped variables can be accessed by all scripts and functions in a javascript document. When you start writing JavaScript in a document, you are already in the Global scope. Unlike local scope, there is only one Global scope throughout a JavaScript document. All global variables belong to the window object.
If you assign a value to a variable that has not been previously declared, it will automatically become a ‘global variable’.
12345678<script>// variable ‘a’ can be accessed globallyvar a = "This is a global variable";function myFunction() {// the variable a is accessible here inside the myFunction() as well}</script>
Accidental Global Variable Case :
If you assign a value to a variable without prior declaration, it will create an ‘automatic’ or ‘accidental global variable’. This example will declare a global variable a, even if it is assigned a value inside a function.
|
1 2 3 4 5 6 7 |
<script> // variable ‘a’ has global scope function myFunction() { a = "this is an accidental global variable"; // variable ‘a’ is global as it has been assigned a value without prior declaration } </script> |
SOLUTION: Global variables by definition are not swept away by garbage collectors. This is why as a best practice for javascript programmer it is always vital to use global variables carefully and never forget to either null it or reassign it after their use. In above example set the global variable a to null after the function call. Another way is to use ‘strict’ mode for parsing your JS code. This will prevent creation of undeclared accidental global variables. Another way is to use ‘let’ instead of ‘var’ for variable declaration. Let has a block scope. Its scope is limited to a block, a statement, or an expression. This is unlike the var keyword, which defines a variable globally.
2. Closures
A closure is a combination of a function and the lexical environment within which that function was declared. A closure is an inner(enclosed) function that has access to the outer (enclosing) function’s variables(scope). Also the inner function will continue to have access to the outer function’s scope even after the outer function is executed.
A memory leak occurs in a closure if a variable is declared in outer function becomes automatically available to the nested inner function and continues to reside in memory even if it is not being used/referenced in the nested function.
|
1 2 3 4 5 6 7 8 9 10 11 12 13 14 15 16 17 18 |
<script> var newElem; function outer() { var someText = new Array(1000000); var elem = newElem; function inner() { if (elem) return someText; } return function () {}; } setInterval(function () { newElem = outer(); }, 5); </script> |
In the above example, function inner is never called but keeps a reference to elem. But as all inner functions in a closure share the same context, inner(line 7) shares the same context as function(){} (line 12)which is returned by outer function. Now in every 5ms we make a function call to outer and assign its new value(after each call) to newElem which is a global variable. As long a reference is pointing to this function(){}, the shared scope/context is preserved and someText is kept because it is part of the inner function even if inner function is never called. Each time we call outer we save the previous function(){} in elem of the new function. Therefore again the previous shared scope/context has to be kept. So in the nth call of outer function, someText of the (n-1)th call of outer cannot be garbage collected. This process continues until your system runs out of memory eventually.
SOLUTION: The problem in this case occurs because the reference to function(){} is kept alive. There will be no javascript memory leak if the outer function is actually called(Call the outer function in line 15 like newElem = outer()();). A small isolated javascript memory leak resulting from closures might not need any attention. However a periodic leak repeating and growing with each iteration can seriously damage the performance of your code.
3. Detached DOM/Out of DOM reference
Detached DOM or Out of DOM reference implies that the nodes which have been removed from the DOM but are still retained in memory through JavaScript. It means that as long as there’s still a reference to a variable or an object anywhere, that object isn’t garbage collected even after being removed from the DOM.
DOM is a doubly-linked tree, having reference to any node in the tree will prevent the entire tree from garbage collection. Let’s take an example of creating a DOM element in javascript and then later at some point deleting this element (or it’s parent/s element) but forget to delete the variable holding on to it. This leads to a Detached DOM which holds a reference to not only the DOM element but the entire tree as well.
|
1 2 3 4 5 6 7 8 9 10 11 12 13 14 15 16 17 18 |
<script> var demo = document.createElement("p"); demo.id = "myText"; document.body.appendChild(demo); var lib = { text: document.getElementById('myText') }; function createFunction() { lib.text.innerHTML = "hello World"; } createFunction(); function deleteFunction() { document.body.removeChild(document.getElementById('myText')); } deleteFunction(); </script> |
Even after deleting #myText from DOM, we still have a reference to #myText in the global lib object. This is why it cannot be freed by the garbage collector and will continue to consume memory. This is another case of memory leak that must be avoided by tweaking your code.
SOLUTION: As a javascript best practice, a common way is to put the var demo inside the listener, which makes it a local variable. When a demo is deleted, the path for the object is cut off. The garbage collector can deallocate this memory.
4. Timers
There are 2 timing events in Javascript namely – setTimeout and setInterval. ‘setTimeout()’ executes a function, after waiting a specified number of milliseconds while ‘setInterval()’ does the some but repeats the execution of the function continuously. The setTimeout() and setInterval() are both methods of the HTML DOM Window object. Javascript timers are the most frequent cause of memory leaks as their use is quite common.
Consider the following javascript code involving timers that creates a memory leak
|
1 2 3 4 5 6 7 8 9 10 11 12 13 14 |
<script> for (var i = 0; i < 100000; i++) { var buggyObject = { callAgain: function() { var ref = this; var val = setTimeout(function() { ref.callAgain(); }, 1000000); } } buggyObject.callAgain(); buggyObject = null; } </script> |
Timer callback and its tied object, buggyObject will not be relaesed until the timeout happens. In this case timer resets itself and runs forever and therefore its memory space will never be collected even if there is no reference to the original object..
SOLUTION: To avoid this scenario, stick to javascript best practice by providing references inside a setTimeout/setInterval call, such as functions are needed to be executed and completed before they can be garbage collected. Make an explicit call to remove them once you no longer need them. Except for old browsers like Internet Explorers, majority of modern browsers like chrome and firefox will not face this problem. Also libraries like jQuery handle it internally to makes sure that no javascript memory leaks are produced.
5. Older Browsers and Buggy Extensions
Older browsers especially IE6-7 were infamous for creating memory leaks as their garbage collector algorithm couldn’t handle couldn’t handle circular references between DOM objects and JavaScript objects. Sometimes faulty browser extensions might also be the cause of leaks. For example, FlashGot extension in firefox once created a memory leak.
6. Event listeners
The addEventListener() method attaches an event handler to a specific element. You can add multiple event handlers to a single element. Sometimes if a DOM element and its corresponding event listener don’t have the same lifecycle, it could lead to a memory leak.
7. Caches
Objects in large tables, arrays and lists being repeatedly used are stored in caches. Caches that grow unbounded in size can result in high memory consumption as it cannot be garbage collected. To avoid this make sure to specify an upper bound for its size.
Using Chrome DevTools To Hunt Javascript Memory Leaks
In this section we will learn how to use the Chrome DevTools to identify javascript memory leaks in your code by making use of these 3 developer tools –
- Timeline View
- Heap Memory Profiler
- Allocation Timeline (or Allocation profiler)
First open any code editor of your choice and create an HTML doc with the code below and open it in chrome browser
|
1 2 3 4 5 6 7 8 9 10 11 12 13 14 15 16 17 18 19 20 21 22 23 24 25 26 |
<!------ JQuery 3.3.1 ------> <script src="https://code.jquery.com/jquery-3.3.1.min.js" integrity="sha256-FgpCb/KJQlLNfOu91ta32o/NMZxltwRo8QtmkMRdAu8=" crossorigin="anonymous"></script> <button id="leak-button">Start</button> <button id="stop-button">Stop</button> <script> var foo = []; function grow() { foo.push(new Array(1000000).join('foo')); if (running) setTimeout(grow, 2000); } var running = false; $('#leak-button').click(function () { running = true; grow(); }); $('#stop-button').click(function () { running = false; }); </script> |
When the ‘Start’ button is clicked, it will call the grow() function which will append a string 1000000 characters long. The variable foo is a global variable which will not be garbage collected as it is being called by the grow() function recursively every second. Clicking the ‘Stop’ button will change the running flag to false to stop the recursive function call. Every time the function call ends, the garbage collector will free up memory but the variable foo will not be collected, leading to a memory leak scenario.
1. Timeline View
The first Chrome Developer Tool that we will put to use for identifying memory leaks is called ‘Timeline’. Timeline is a centralized overview of your code’s activity which helps you to analyze where time is spent on loading, scripting, rendering etc. You can visualize your memory leaks using the timeline recording option and compare memory usage data before and after the garbage collection.
- Step1: Open our HTML doc in Chrome browser and press Ctrl+Shift+I to open Developer Tools.
- Step2: Click on performance tab to open timeline overview window. Click Ctrl+E or click the record button to start timeline recording. Open your webpage and click on ‘start button’.
- Step3: wait for 15 seconds and proceed to click ‘Stop button’ on your webpage. Wait for 10 seconds and click on garbage icon to the right to manually trigger garbage collector and stop the recording.
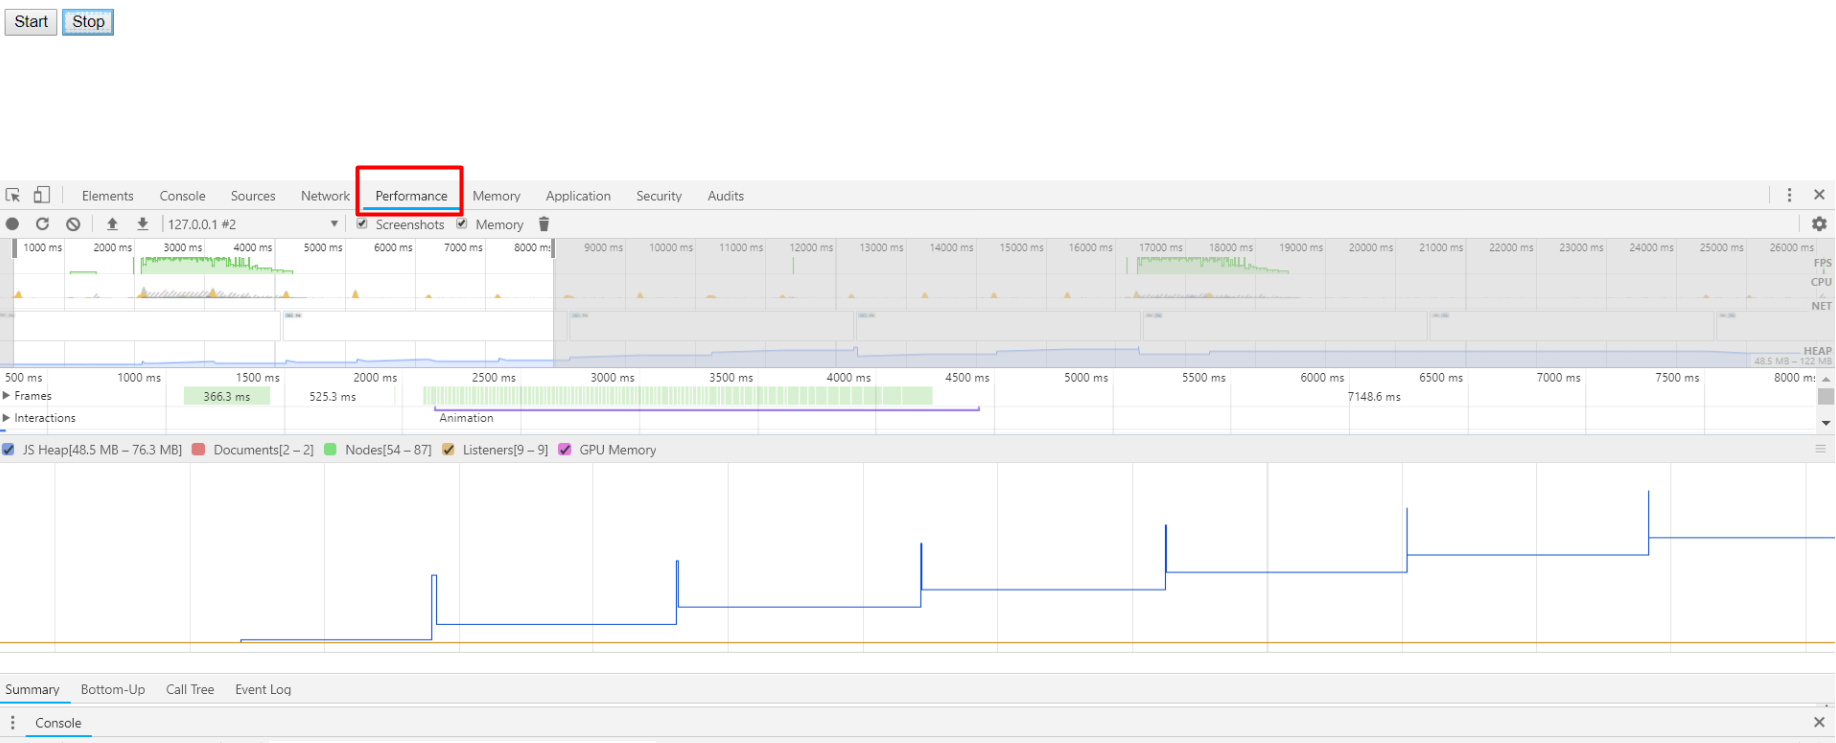
As you can see in the screenshot above, memory usage is going up with time. Every spike indicates when the grow function is called. But after the function execution ends, garbage collector clears up most of the garbage except the global foo variable. It keeps on increasing more memory and even after ending the program, the memory usage in the end did not drop to initial state.
2. Heap Memory Profiler
The ‘Heap Memory Profiler’ shows memory distribution by JavaScript objects and related DOM nodes. Use it to take heap snapshots, analyze memory graphs, compare snapshot data, and find memory leaks.
-
- Step1 : Press Ctrl+Shift+I to open Chrome Dev Tools and click on memory panel.
- Step2 : Select ‘Heap Snapshot’ option and click start.
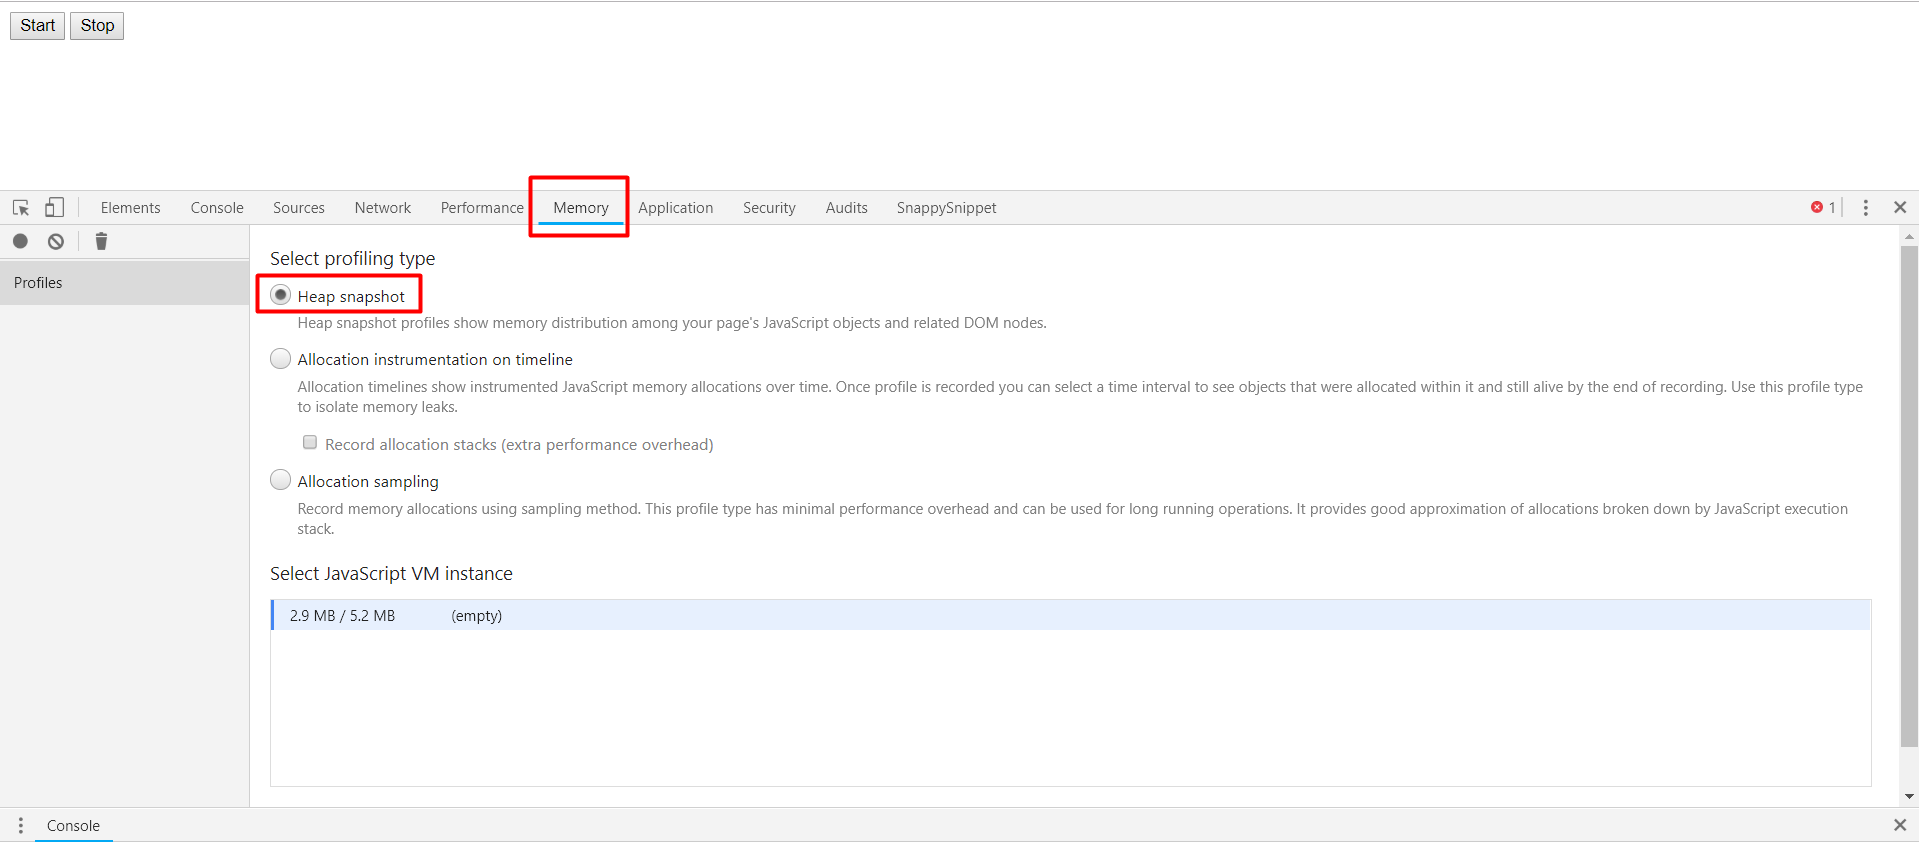
- Step3 : Click the start button on your webpage and select the record heap snapshot button at top left under memory panel. Wait for 10-15 seconds and click close button on your webpage. Proceed ahead and take a second heap snapshot.
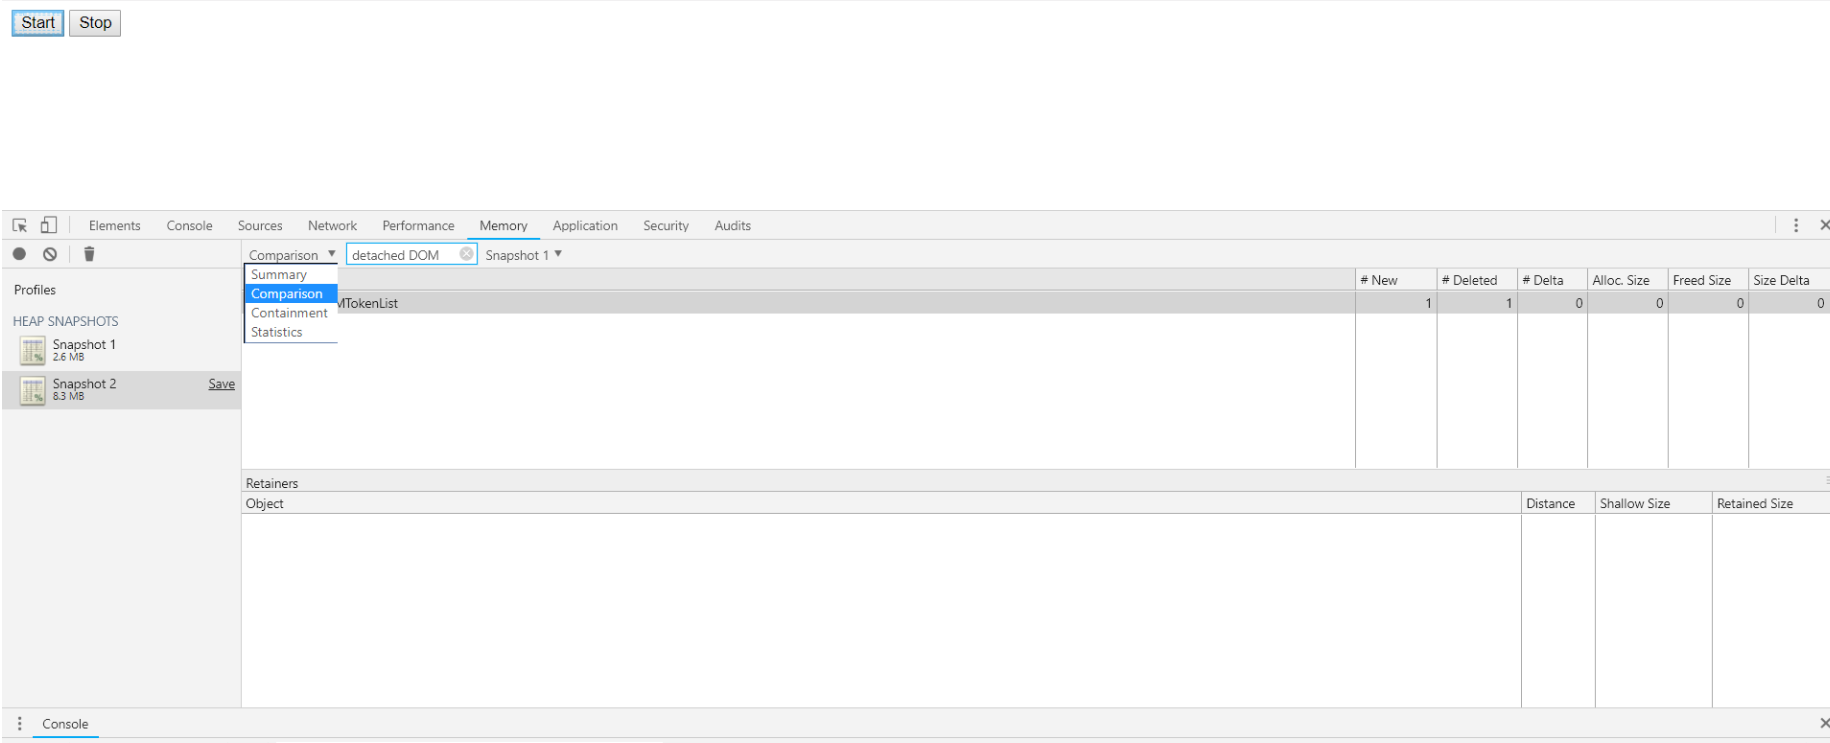
- Step4 : select ‘comparison’ option from the drop down instead of ‘summary’ and search for detached DOM elements. This will help to identify Out of DOM references. There are none in our example case(the memory leak in our examle is due to global variable)
3.) Allocation Timeline/Profiler
The allocation profiler combines the snapshot information of the heap memory profiler with the incremental tracking of the Timeline panel. The tool takes heap snapshots periodically throughout the recording (as frequently as every 50 ms!) and one final snapshot at the end of the recording. Study the generated graph for suspicious memory allocation.
In newer versions of chrome, ‘Profiles’ tab has been removed. You can now find allocation profiler tool inside the memory panel rather than the profiles panel.
-
- Step1 : Press Ctrl+Shift+I to open Chrome Dev Tools and click on memory panel.
- Step2 : Select ‘Allocation Instrumentation on timeline’ option and click start.

-
- Step 3: Click and record and wait for allocation profiler to automatically take snapshots in a periodical manner. Analyse the generated graph for suspicious memory allocation.


Removing the memory leak by modifying our code
Now that we have successfully used chrome developer tools to identify the memory leak in our code, we need to tweak our code to eliminate this leak.
As discussed earlier in the ’causes of memory leaks’ section, we saw how global variables are never disposed of by garbage collectors especially when they are being recursively called by a function. We have 3 ways in which we can modify our code –
- Set the global variable foo to null after it is no longer needed.
- Use ‘let’ instead of ‘var’ for variable foo declaration. Let has a block scope unlike var. It will be garbage collected.
- Put the foo variable and the grow() function declarations inside the click event handler.
|
1 2 3 4 5 6 7 8 9 10 11 12 13 14 15 16 17 18 19 20 |
<script> var running = false; $('#leak-button').click(function () { /* Variable foo and grow function are now decalred inside the click event handler. They no longer have global scope. They now have local scope and therefore will not lead to memory leak*/ var foo = []; function grow() { foo.push(new Array(1000000).join('foo')); if (running) setTimeout(grow, 2000); } running = true; grow(); }); $('#stop-button').click(function () { running = false; }); </script> |
Conclusion
It’s nearly impossible to completely avoid javascript memory leaks, especially in large applications. A minor leak will not affect an application’s performance in any significant manner. Moreover, modern browsers like Chrome and Firefox armed with advanced garbage collector algorithms do a pretty good job in eliminating memory leaks automatically. This doesn’t mean that a developer must be oblivious to efficient memory management. Good coding practices go a long way in curbing any chance of leaks right from the development phase to avoid complications later. Use Chrome Developer tools to identify as many javascript memory leaks as you can to deliver an amazing user experience free from any freezes or crashes.
Got Questions? Drop them on LambdaTest Community. Visit now


