Workshop: Unveiling the Power of Web Performance Metrics for Testers [Spartans Summit 2024]
LambdaTest
Posted On: February 6, 2024
![]() 9783 Views
9783 Views
![]() 13 Min Read
13 Min Read
In this world of web applications, creating a uniform user experience is key. As testers, understanding and using crucial client-side performance metrics can make a big difference in improving the overall quality of your web application.
In this workshop of Spartans Summit 2024, Srinivasan Sekar – Lead Consultant at Thoughtworks, gives a hands-on demonstration of metrics like Largest Content Paint (LCP), Cumulative Layout Shift (CLS), Time to First Flat (TTFB), and more.
He uses real-life examples and leads interactive discussions to show how these metrics affect when users use your web app. Srinivasan also discusses ways to find performance issues, use effective testing methods, and how to work in synchronization with development teams to improve performance.
Couldn’t catch all the sessions live? Don’t worry! You can access all the recordings easily by visiting the LambdaTest YouTube Channel. If you are preparing for an interview you can learn more through Performance Testing interview questions.
Why Performance Matters?
Srinivasan begins the workshop session and explains the critical importance of client-side performance in web applications, emphasizing that it is not merely a technical concern but a fundamental aspect that significantly impacts user engagement. In his discussion, he highlights several key reasons why performance matters.
First and foremost, Srinivasan points out that a quick and responsive user experience is paramount. Users expect quick responses when interacting with web applications in a dynamic online environment. The ability to deliver a seamless experience directly influences user satisfaction and engagement. Any delays or lags in response times can lead to frustration, negatively impacting the overall user perception of the application.
Moreover, Srinivasan stresses the pivotal role of speed in user engagement. He asserts that speed is key to ensuring a smooth application flow, preventing interruptions or disruptions that could deter users from engaging with the platform. This aligns with the broader industry understanding that faster-loading websites tend to have higher user retention rates and increased customer satisfaction.
Beyond the immediate user experience, Srinivasan also touches upon the significance of performance in shaping the first impression of an application. He notes that a fast and responsive application contributes to a positive initial encounter, reinforcing the importance of a smooth onboarding process. In a competitive digital landscape, where users have abundant choices, a favorable first impression can significantly influence whether users continue using a particular application or explore alternatives.
Lastly, Srinivasan links performance directly to broader aspects such as brand reputation and product quality. He suggests that users often associate an organization’s reputation with the performance of its web applications. Therefore, consistent performance optimization is about technical efficiency, maintaining a positive brand image, and ensuring that users perceive the product as high-quality and reliable.
Significance of Google Core Web Vitals in Performance
Srinivasan delves into the significance of Google Core Web Vitals, which measures user experience and website performance.
Dive deep into the world of performance metrics with Srinivasan! Uncover the what, why, and how in his 1-hour interactive workshop. Gain valuable tips, tricks, and more. Join now for a performance knowledge boost! pic.twitter.com/G1YmlflFUM— LambdaTest (@lambdatesting) February 6, 2024
Here’s an overview of the three web vitals explained by him:
- Largest Contentful Paint (LCP): It measures the time it takes for the largest content element on a web page to be fully rendered and visible to the user. This content element could be an image, a video, or a significant text block.
- First Input Delay (FID): It gauges the time it takes for a user’s first interaction (such as clicking a button or a link) to receive a response from the browser. It measures the delay between the user initiating an action and the browser being able to respond.
- Cumulative Layout Shift (CLS): This quantifies the amount of unexpected layout shift that occurs during the loading of a web page. Layout shifts happen when page elements move around unexpectedly, causing a potentially frustrating experience for users.
LCP is critical because it directly influences how quickly users can see and interact with the primary content on a page. A fast LCP contributes to a positive user experience, preventing delays and ensuring that essential elements load quickly.
FID is crucial for assessing the responsiveness of a website. A low FID means users can interact with the site without noticeable delays, enhancing overall user satisfaction. Srinivasan mentions that Google is introducing a new metric called “Interaction to Next Paint,” which is likely intended to replace FID.
CLS is important for measuring visual stability. A low CLS indicates that the page elements are stable during loading, providing a more comfortable and reliable user experience. Minimizing unexpected layout shifts contributes to user satisfaction and prevents accidental clicks on the wrong elements due to sudden movements.
How Does Google Performance Observer API Help?
Srinivasan talks about Performance Observer API for developers to analyze the performance of web applications. While specifically mentioning its role in monitoring metrics like Largest Contentful Paint (LCP) and First Input Delay (FID), he highlights that the API extends its functionality to cover a broader spectrum of core web vitals. This suggests that developers can use the Performance Observer API to gain insights into various performance metrics, offering a comprehensive understanding of their web application’s responsiveness.
The Performance Observer API from Google lets you keep a track of the different Core Web Vitals. You can check out more about it at https://t.co/HKvpJvnAeP pic.twitter.com/igmSBX05t6— LambdaTest (@lambdatesting) February 6, 2024
He also stresses the importance of understanding user experiences beyond lab environments. Srinivasan suggests that the API enables developers to access data reflecting actual user behaviors and network conditions, ensuring that optimizations align with the diverse scenarios in which the web application is accessed.
Also, he mentions that the Performance Observer API is not limited to standalone use but can be integrated with various web performance tools and frameworks. The comparison of insights from tools like Lighthouse and PageSpeed Insights, alongside the Performance Observer API, suggests that developers can leverage multiple resources to gain a nuanced understanding of web performance from lab and field data.
Demo: Optimizing Web Performance
Through his portfolio website, Srinivasan shows a live demonstration of the Core Web Vitals principles.
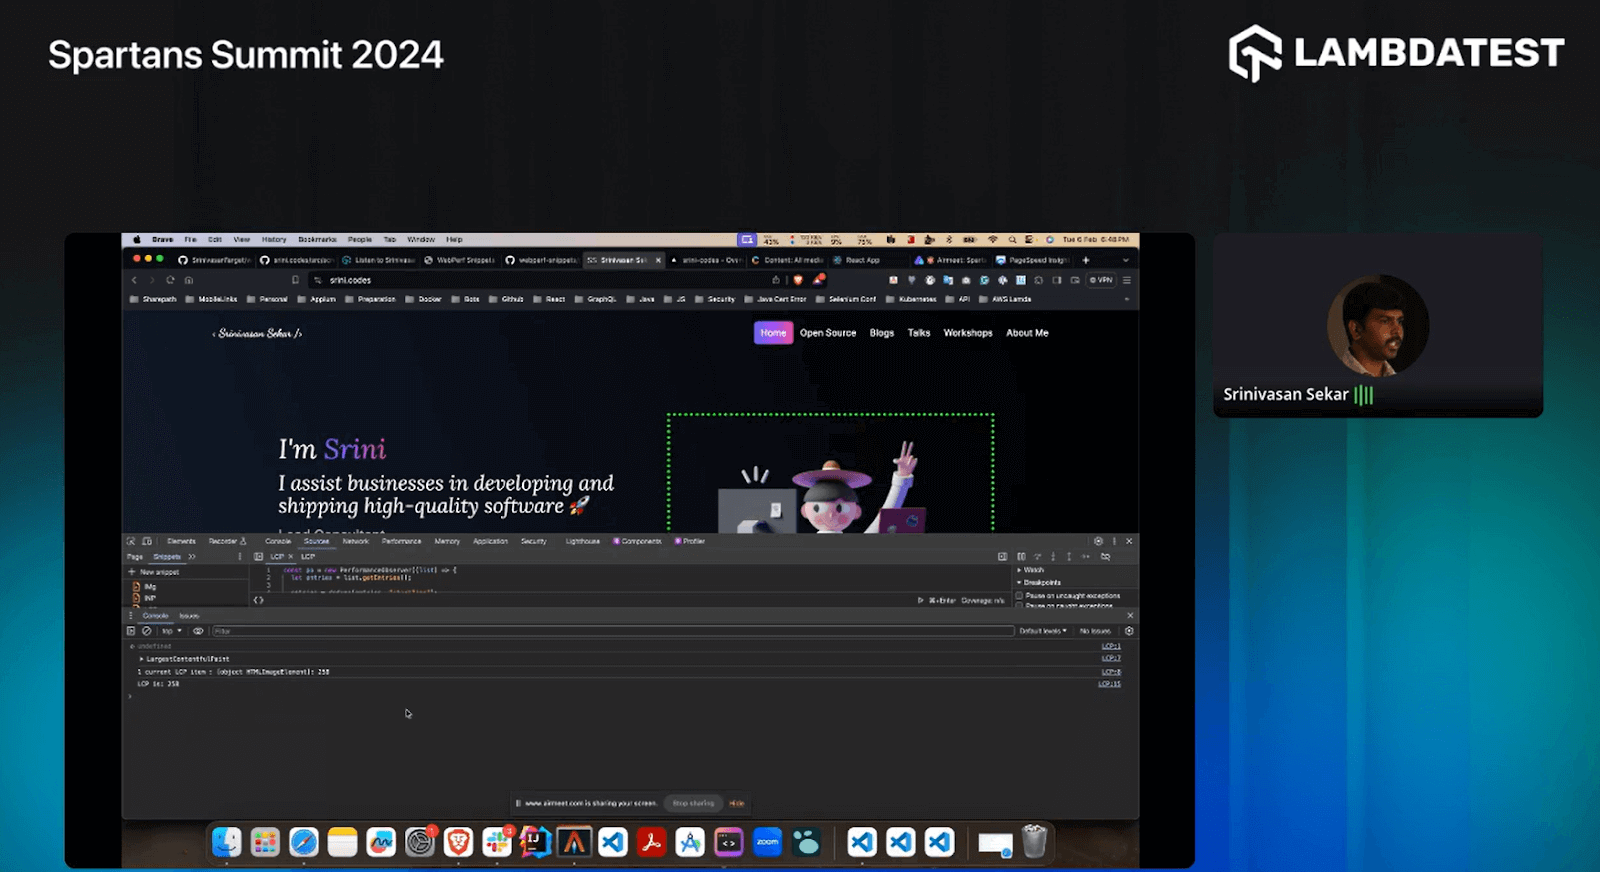
Firstly, he delves into the Largest Contentful Paint (LCP) using his hero image as the primary focus. According to him, it isn’t just about aesthetics; it’s about efficiently loading essential visual content for an impactful user experience. In this context, the hero image isn’t just a visual; it’s a strategic move to ensure a prompt and pleasing first impression.
Moving on, Srinivasan talks about fonts, highlighting the chaos too many fonts can cause. He sheds light on font optimization, steering developers toward a smoother and more consistent typographic performance.
Then comes the core of user experience – interaction. Here, he introduces Interaction to Next Paint, extending the focus beyond the initial interaction with the browser to encompass the entire user action.
Srinivasan shows how handling image loading, coupled with the proper adjustments, transforms a potentially sluggish experience into seamless interactions.
Cache Headers and ETag
Srinivasan mentions the importance of cache headers and ETag in optimizing web performance. Cache headers are directives to guide the browser in managing the caching of various assets within a web application. By strategically configuring cache headers, developers gain control over the duration resources are cached, leading to improved loading speeds.
ETags, or entity tags, are highlighted as particularly useful, especially in the context of handling larger files. ETags empower browsers to efficiently validate whether cached resources require updating, minimizing redundant data transfers and contributing to a streamlined web experience.
Boost performance by implementing caching and leveraging Content Delivery Networks (CDN) based on your specific scenario. Learn how these strategies can revolutionize your web experience on #SpartansSummit! pic.twitter.com/EcXQX7hi6w— LambdaTest (@lambdatesting) February 6, 2024
Content Delivery Network (CDN)
He suggests that leveraging a CDN can significantly enhance the loading speed of assets on a website. CDNs distribute content across multiple servers geographically closer to the user, reducing latency and accelerating content delivery.
In the context of his portfolio website, Srinivasan discusses how a CDN helps efficiently deliver users’ images, stylesheets, scripts, and other assets. This ensures the content is fetched from a nearby server regardless of a user’s location, minimizing the time it takes to load and improving overall site performance.
Image Optimization
On his portfolio website, Srinivasan discusses the importance of image optimization in enhancing web performance. He delves into strategies such as progressive loading, emphasizing the gradual display of images to prioritize essential visual content for an improved user experience. He also recommends using lazy load images, which dynamically load images as users approach them, reducing initial page load times.
Additionally, he talks about choosing optimal image formats like WebP, specifying dimensions and resolutions, and ensuring contentful delivery.
Font Optimization
Srinivasan sheds light on the significance of font optimization as a crucial aspect of web performance on his portfolio website. He discusses the potential pitfalls of using too many fonts, which can lead to suboptimal loading experiences and default font displays before the intended fonts are rendered. He emphasizes the need for font optimization, advocating for strategies such as prioritizing font loading and ensuring a smooth, consistent typographic performance.
Preloading fonts is a proven technique for improving the performance and user experience of your application.
Srinivasan shows how exactly you can leverage the preloading of fonts for improving Core Web Vitals. pic.twitter.com/EnrzGktZ3O— LambdaTest (@lambdatesting) February 6, 2024
Interaction to Next Paint (INP)
Srinivasan then explains Interaction to Next Paint (INP) on his portfolio website, emphasizing its significance in enhancing user experience. According to him, INP is not merely about the initial interaction with the browser but the interactions, from initiation to the final rendering of content. He provides examples of how long each interaction takes through the metrics he showcases on his website.
Srinivasan shares how Interaction to Next Paint (INP) differs from First Input delay (FID). INP assesses the delay between user input and the next visual change on the screen, while FID focuses on the delay between user input and the browser's response to that input. pic.twitter.com/zk2c6fZVmf— LambdaTest (@lambdatesting) February 6, 2024
Render Blocking Resources
Render-blocking resources, such as stylesheets and JavaScript, can significantly affect the loading time of a web page. He emphasizes identifying and addressing these resources to optimize the overall user experience. Using tools like the Performance Observer API and Chrome DevTools, developers can profile their applications, pinpointing which resources are causing delays. Srinivasan suggests strategies like deferring specific resources, removing unused scripts, and compressing CSS to mitigate the impact of render-blocking resources and streamline the loading process.
Interaction to Next Paint (INP) is a key metric for assessing the responsiveness of web pages. Watch Srinivasan Sekar on Spartans Summit sharing how the elimination of Render-Blocking Resources can be looked into for improving the INP. pic.twitter.com/YD30MWaIXz— LambdaTest (@lambdatesting) February 6, 2024
Layout Shifts
Srinivasan then goes on to discuss the significance of Cumulative Layout Shifts (CLS) in his demo. CLS refers to the unexpected movement of elements on a webpage, which can frustrate users. Srinivasan emphasizes the impact of CLS on user experience, using examples like unintentional clicks due to layout shifts.
He delves into the factors contributing to CLS, such as images without proper dimensions, ads pushing content, and transforming animations. Srinivasan suggests solutions like providing image dimensions, reserving ad space, and preferring transform animations to minimize layout shifts. By addressing these aspects, developers can enhance the stability of their web layouts, leading to a smoother and more user-friendly browsing experience.
Q&A Session!
Q: Which is the best open-source tool for web performance testing?
Srinivasan: Consider using web performance snippets and options like Lighthouse, PageSpeed Insights, or CrUX. Real user monitoring tools are essential for understanding how users interact with your application.
Q: If a high-quality image is needed as per the client’s requirement, how can we build a site with good performance?
Srinivasan: Use progressive images, modern extensions like WebP, and Content Management Systems (CMS) such as Contentful to load progressive images of the appropriate size.
Q: Are there regulatory considerations for performance metrics in industries like finance or healthcare?
Srinivasan: Check for compliance with regulations, such as GDPR, in Europe. Hosting static assets within the designated geography is important for compliance.
Q: What common mistakes have you encountered in interpreting web performance metrics?
Srinivasan: Relying solely on tools like Lighthouse may lead to optimization that doesn’t align with actual user experiences. Understanding real user data is crucial, as lab testing may differ from the field.
Q: How do images and lazy loading techniques influence the Largest Contentful Paint (LCP)?
Srinivasan: Use fetch priorities, lazy loading, and techniques like lazy and eager loading based on the specific needs of your environment to impact LCP positively.
Q: How can snippets be created to track metrics in a presentation?
Srinivasan: Pre-built snippets are available; you can follow a specific website for helpful scripts. These scripts cover various aspects, including core web vitals and identifying render-blocking resources.
Q: Can low-code/no-code tools be used to check for the performance of a given page?
Srinivasan: Yes, if you have control over the generated code, you can experiment and improve performance metrics, including Largest Contentful Paint (LCP).
Q: How do you analyze the performance of a streaming web application?
Srinivasan: Prioritize fetch for streaming assets, load based on user network conditions, and consider progressive streaming techniques. Analyzing metrics like interaction to next paint (INP) can be challenging but may improve over time.
If you have more questions, please drop them on the LambdaTest Community.


Author’s Profile
LambdaTest
LambdaTest is a continuous quality testing cloud platform that helps developers and testers ship code faster.
Blogs: 175
Got Questions? Drop them on LambdaTest Community. Visit now