
Webinar: From Chaos To Control: Observability And Testing In Production [Voices Of Community]
Sparsh Kesari
Posted On: March 1, 2023
![]() 81198 Views
81198 Views
![]() 9 Min Read
9 Min Read
Microservice architectures are gaining immense popularity, offering many advantages over monolithic architecture, such as improved scalability, better resilience, and faster time-to-market. However, there are different microservices architecture challenges, one of the major ones being the difficulties in managing, monitoring, and maintaining the system.
With domain-driven design at the heart of microservices, different bounded contexts cooperate to accomplish a business process. Two important questions arise – is my process working fine? If not, why is it failing? This is where the concept of ‘Observability’ comes into play.
We’re sure you would have many questions about monitoring, observability, and how to develop your observability strategy.
But worry not! Our special guest Vanya Seth, Head of Technology, Thoughtworks India, has teamed up with Manoj Kumar, VP – Developer Relations & OSPO, LambdaTest, to discuss and share her ideas and thoughts on the concept of observability and how it facilitates the concept of testing in production.
If you missed the power-packed webinar, let us look at the event’s major highlights.
The Landscape Today
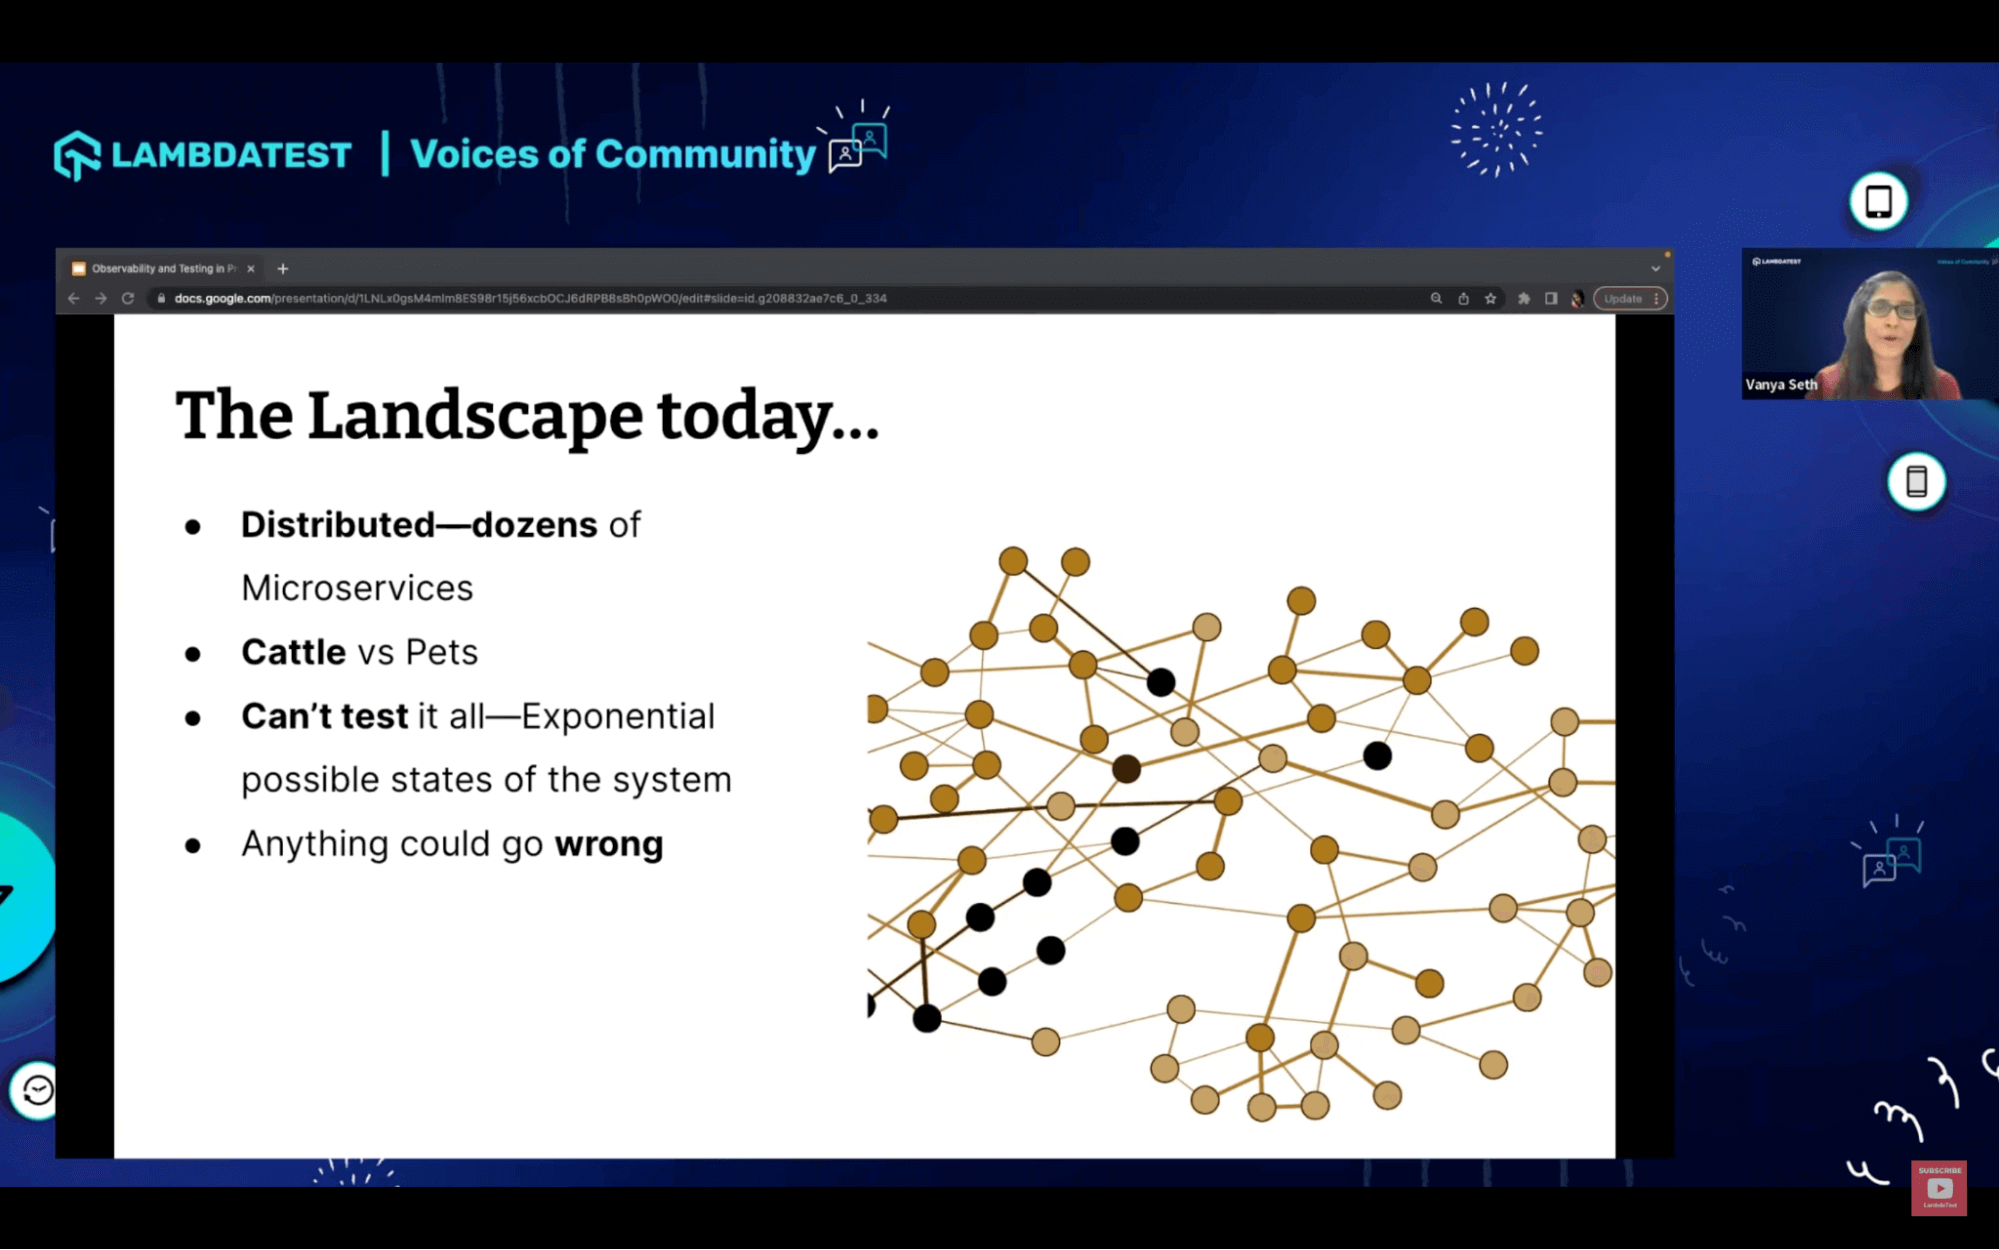
The webinar starts with Vanya contrasting the changes in the landscape of the monolithic application and between distributed architecture.
She explains that when she was working with a monolithic application, it was a single Deployable unit. She could monitor some of the signals of the application and derive whether her system was up or down. Hence, it was a very binary situation, whether the system was up because the web application was responding or down.
But since then, we have evolved a lot in terms of system architecture and more complex environments, including microservices. We have gained the autonomy to deploy different system parts depending on the use case or the business problem we were trying to solve.
With an analogy of pet and cattle, Vanya explains the difference; with the monolithic system acting more like a pet, she knew the IP address to get inside the system and figure out what was happening.
During the last decade, with the cloud’s rise and serverless popularity due to managed cloud services, infrastructure has become more like cattle, where we aren’t concerned about its ephemeral nature because it can spin up and die down at free will.
The Unknowns
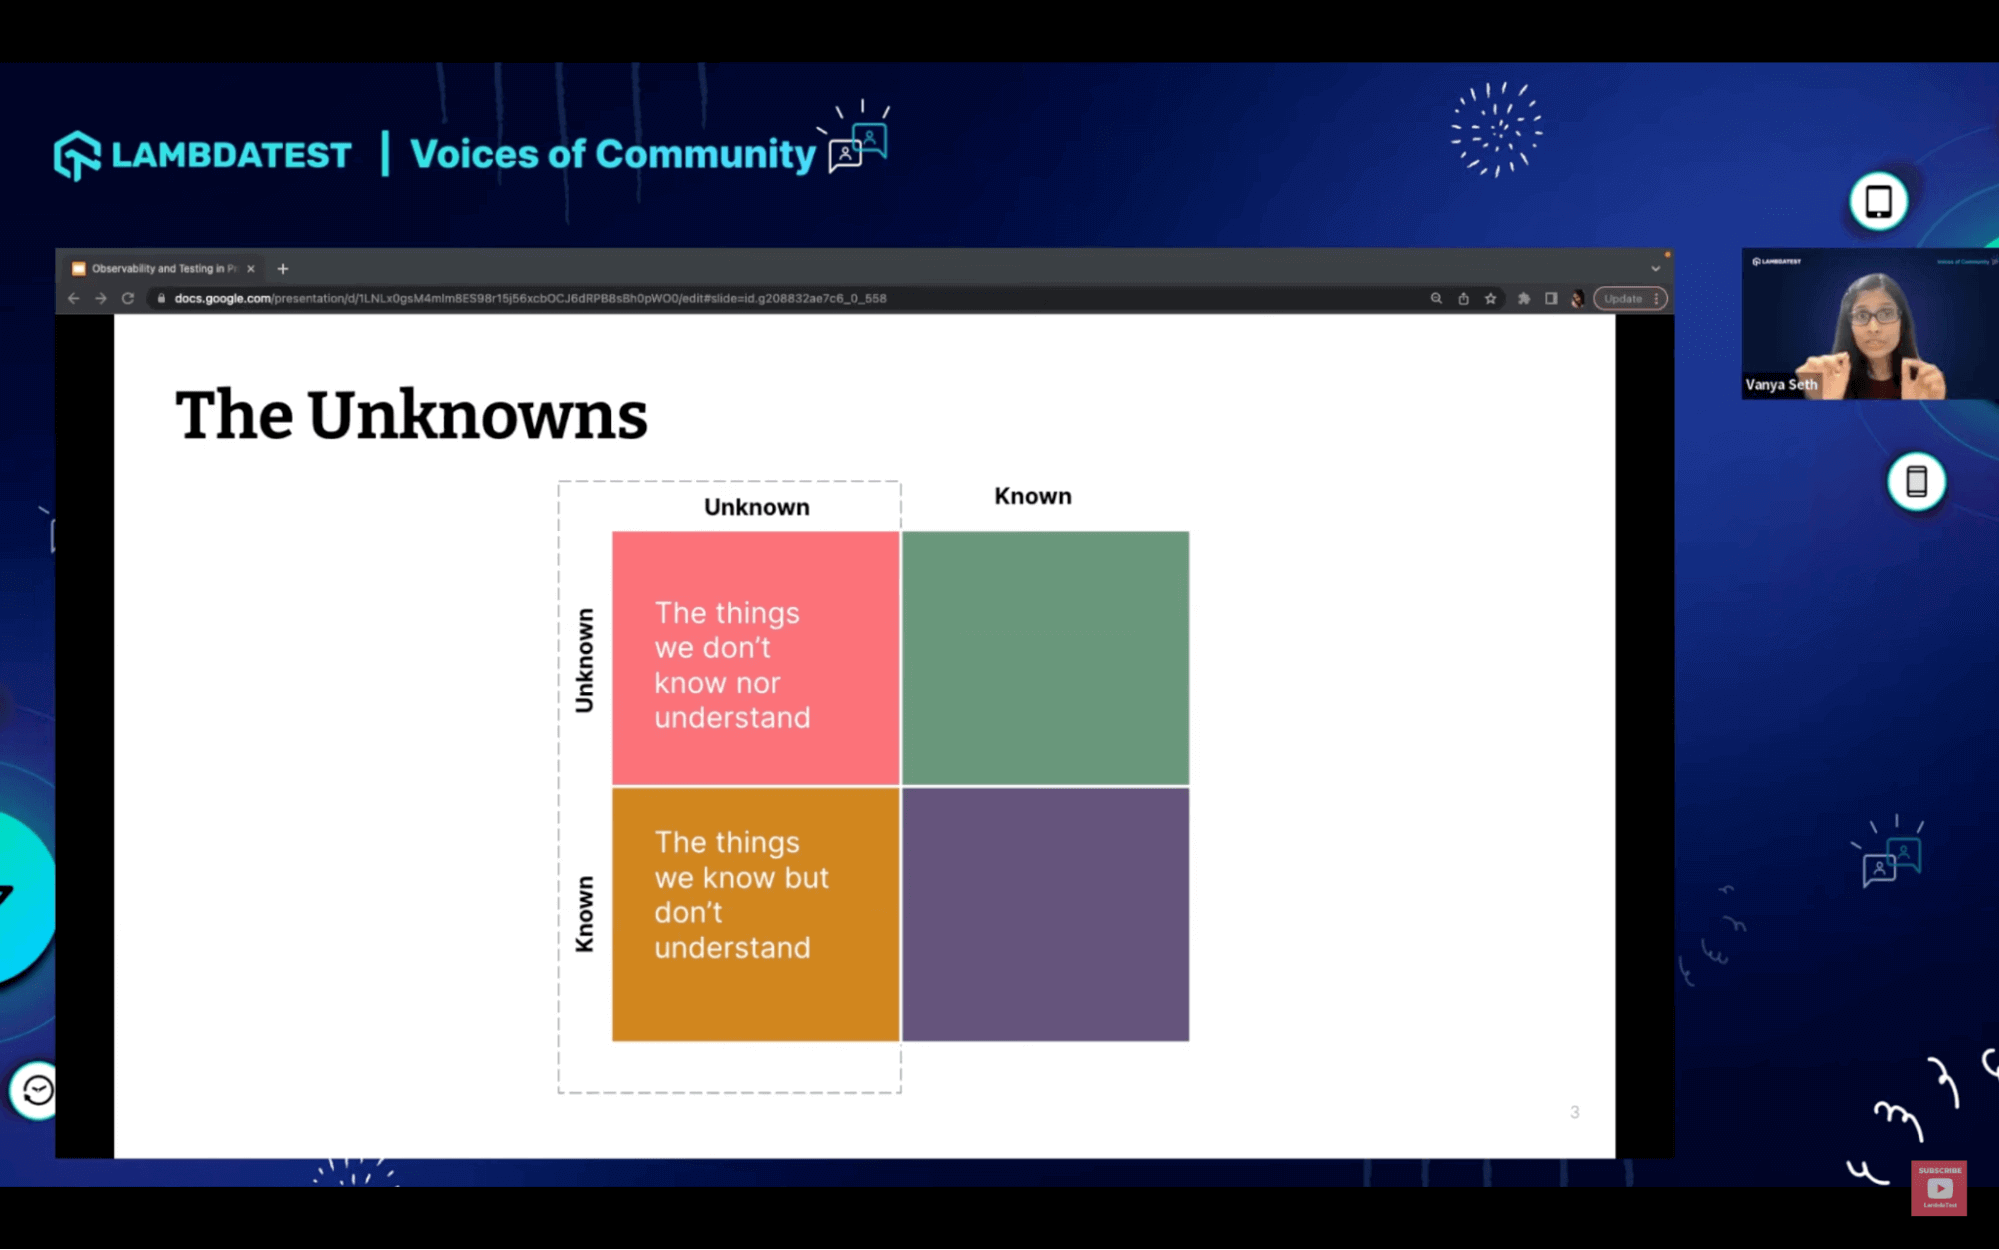
Vanya shares an interesting outlook on how we can understand and differentiate between observability and monitoring with the help of mapping the Knowns and Unknowns framework.
In a real situation, Vanya explains the difference; Monitoring allows teams to watch and understand the state of their systems with the help of gathering predefined sets of metrics or logs, whereas Observability is a solution that will enable teams to actively debug their system and help understand why something is behaving the way it is behaving right now.
What is Observability?
Vanya explains observability for her is “what” is not working to “why” something is not working and the transition from what to why.
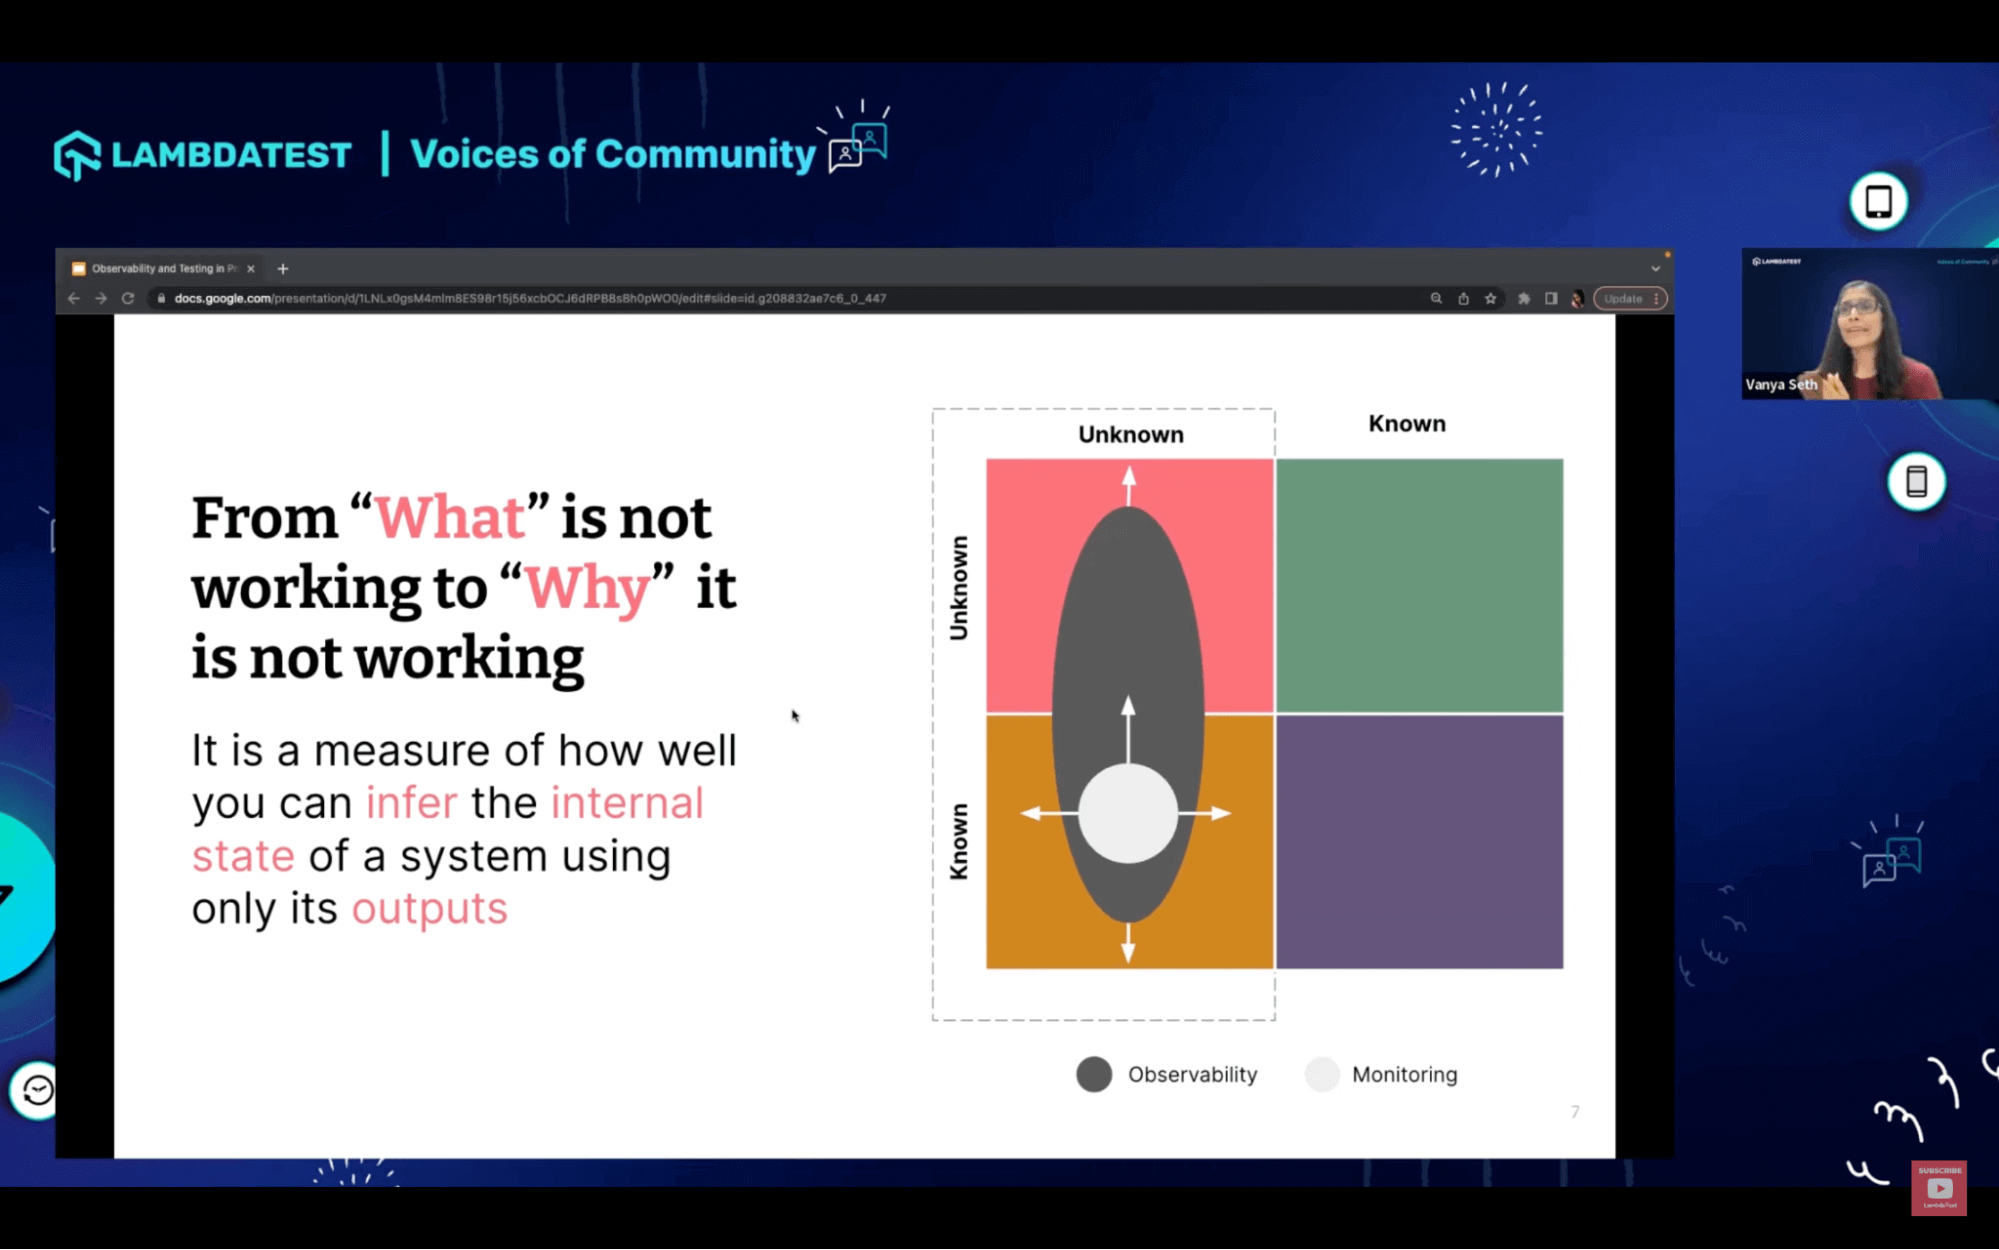
Vanya also explains with the help of a quadrant graph of known – unknown framework, the black oval marks the spectrum of observability and monitoring being a part, as showcased by the white color in the known quadrant. The outward pushing arrows denote that the more we expand our monitoring scope, the more we will understand the system failures.
In other words, we can infer observability as a measure of how well we can understand the internal state of the system using only its outputs that we are monitoring. She further explains from a QA’s perspective. It means observing our systems and making some hypotheses on how the system is behaving in production.
She also further explains interdependency with an example Latency – a metric that is a known symptom that we should all monitor from a monitoring perspective, but as soon as we get an alert, we need to observe and investigate from the logs and trace the actual reason for increasing latency, explaining the interrelationship between observability and monitoring.
Pillars of Observability
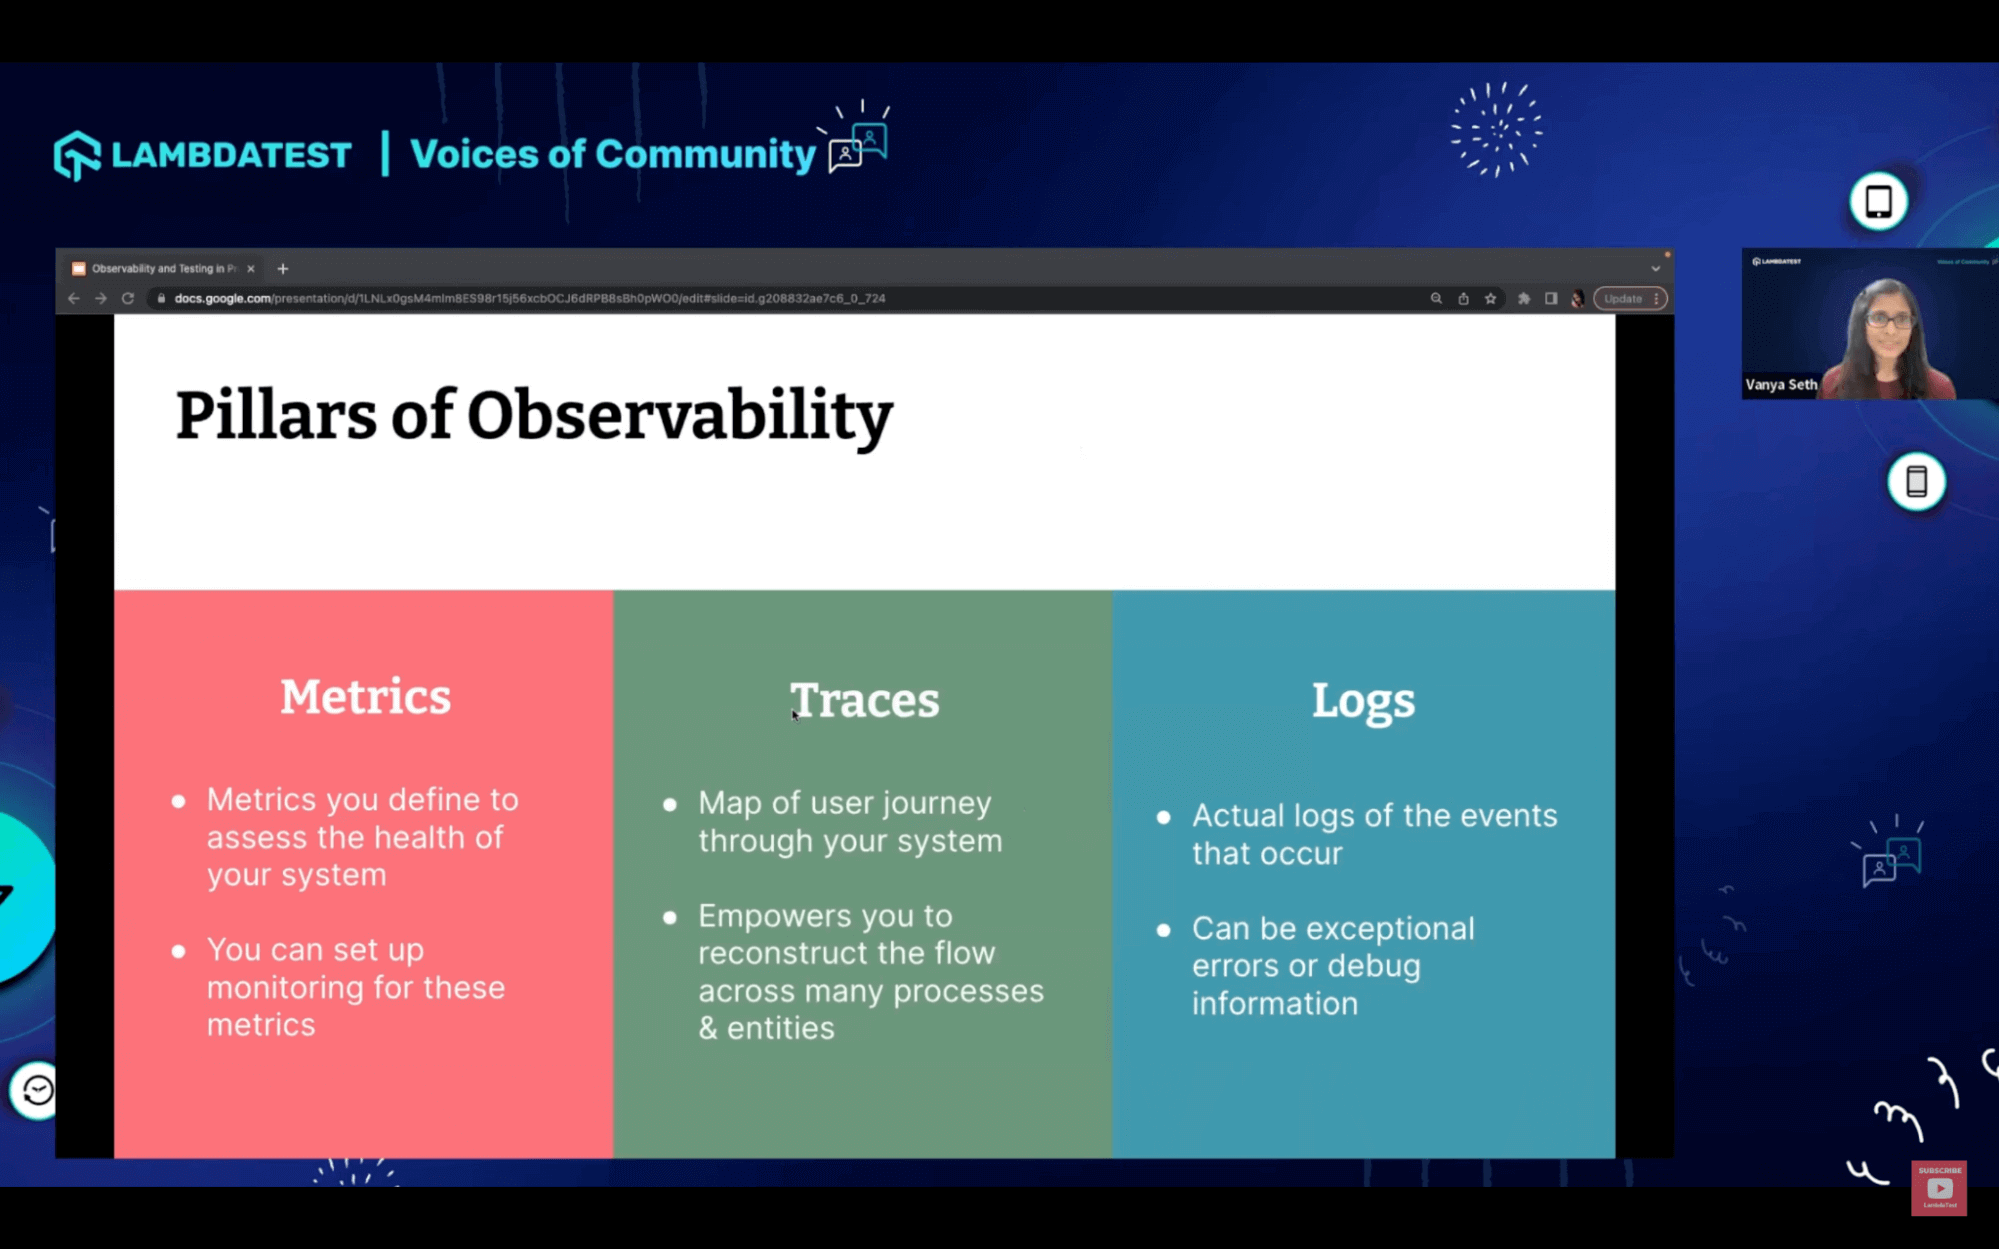
Moving forward, Vanya talks about the three main pillars of observability: Metrics, Traces, and Logs
- Metrics are the key pointers that define the health of your system. You can set up monitoring for these metrics.
- Traces map the user’s journey through the various systems. Traceability also deals with how you can audit the complete business process.
- Logs are actual logs emitted by the events that occurred, which also help to take the decision and debug at the info level.
What’s your Observability Strategy?
Vanya adds some of the questions that should come to our mind when planning our observability strategy:
Are we able to do a post-mortem of our production issues? Are we able to do root cause analysis and debugging? How is your software robustness at any point in time? How are you designing your system for debuggability?
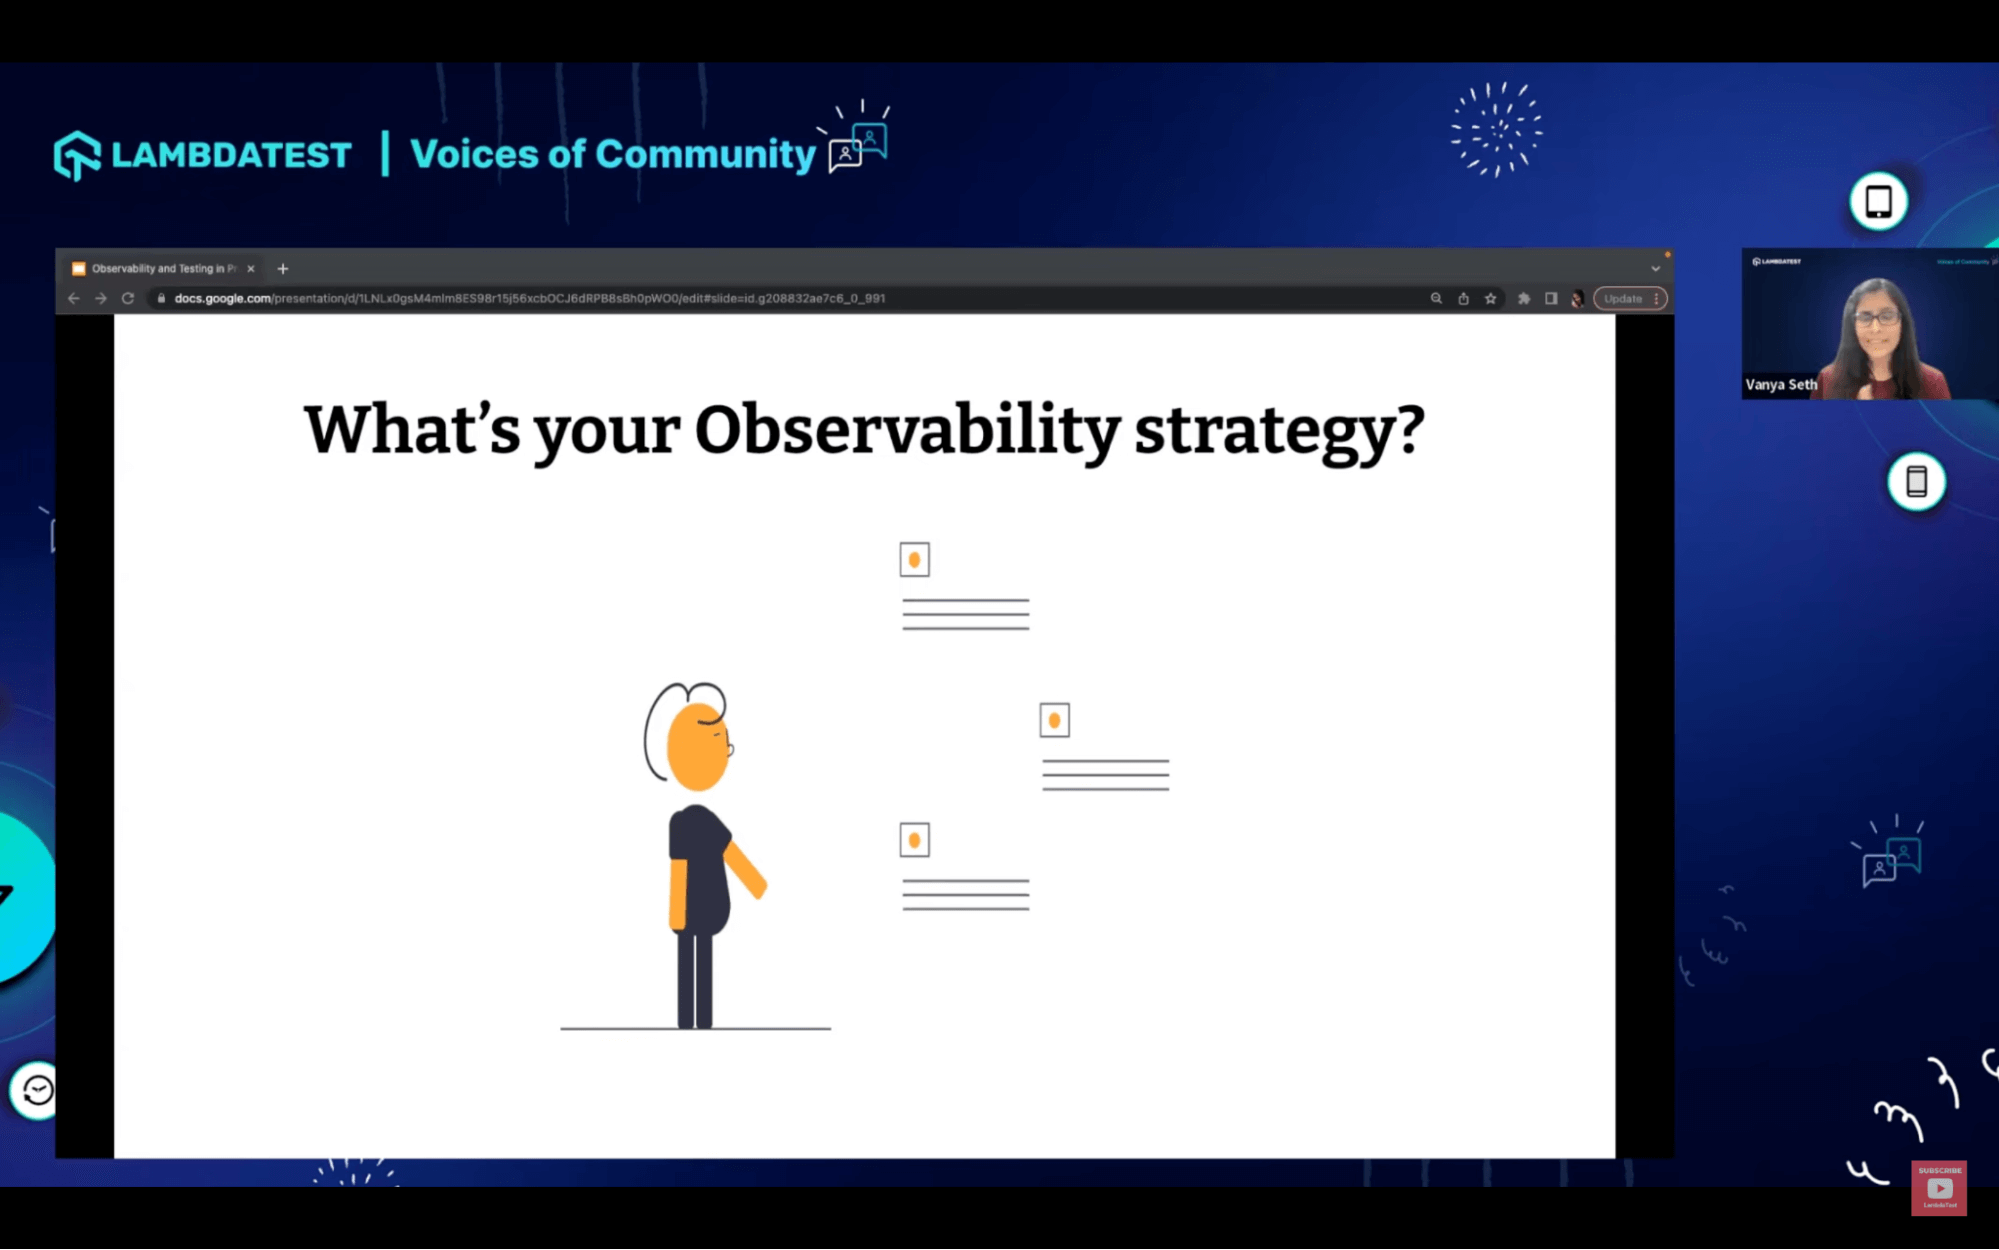
And most importantly, how is observability a first-class concern in your software development life cycle or your various cross-functional requirements?
In the next section, Vanya shared some important, relevant tenets when considering our observability strategy.
As a quality engineer, looking at the entire part of the production is extremely relevant and important.
How am I delivering software? How am I writing software? How are your stories being groomed? How are the acceptance criteria for your story being identified? and How QA’s are evangelizing observability as a first-class concern across the software value chain of development?
Next, let’s look at some other key aspects of observability strategies.
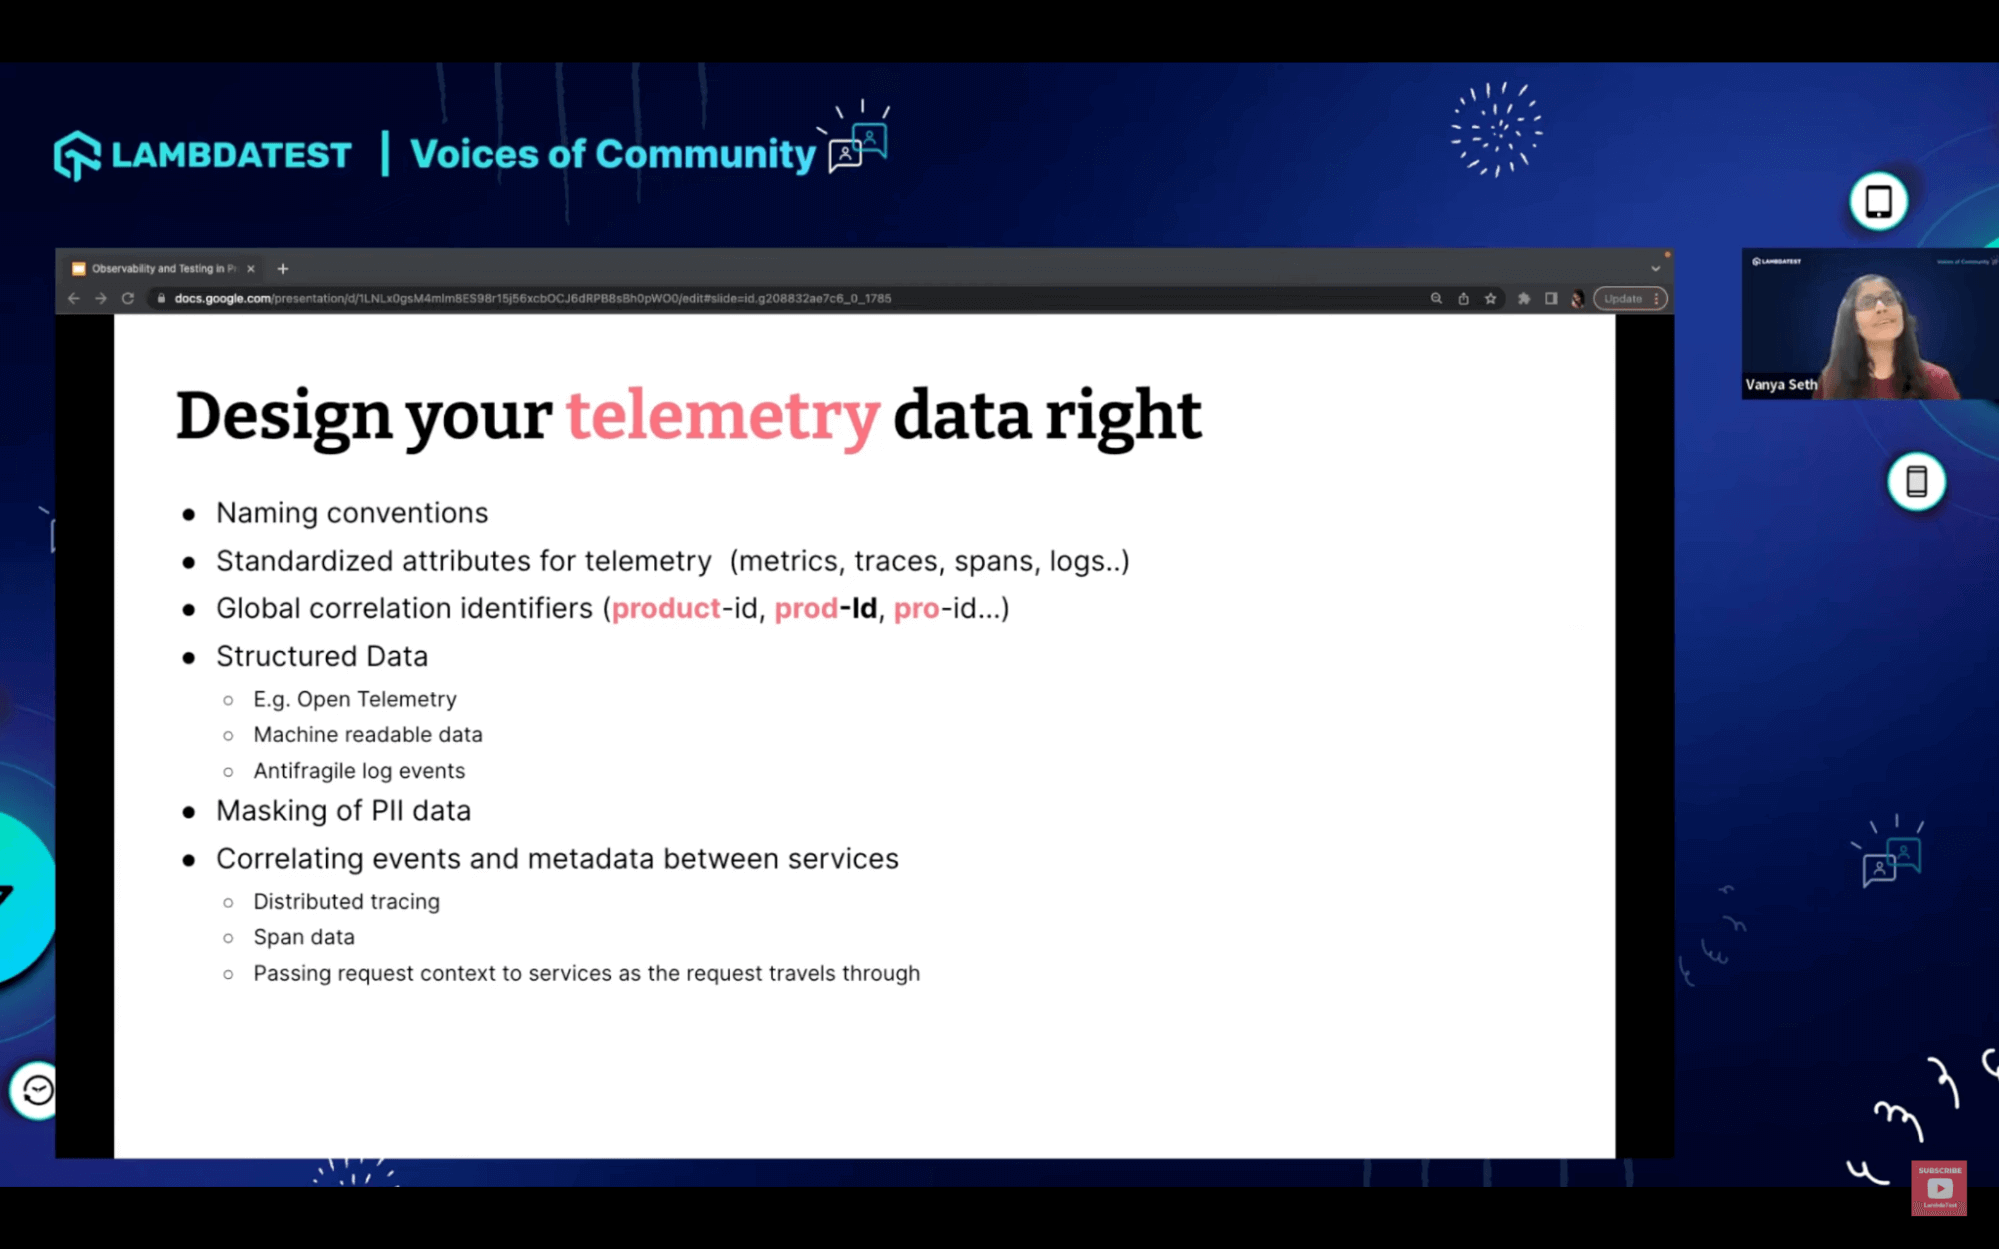
Designing your telemetry data right
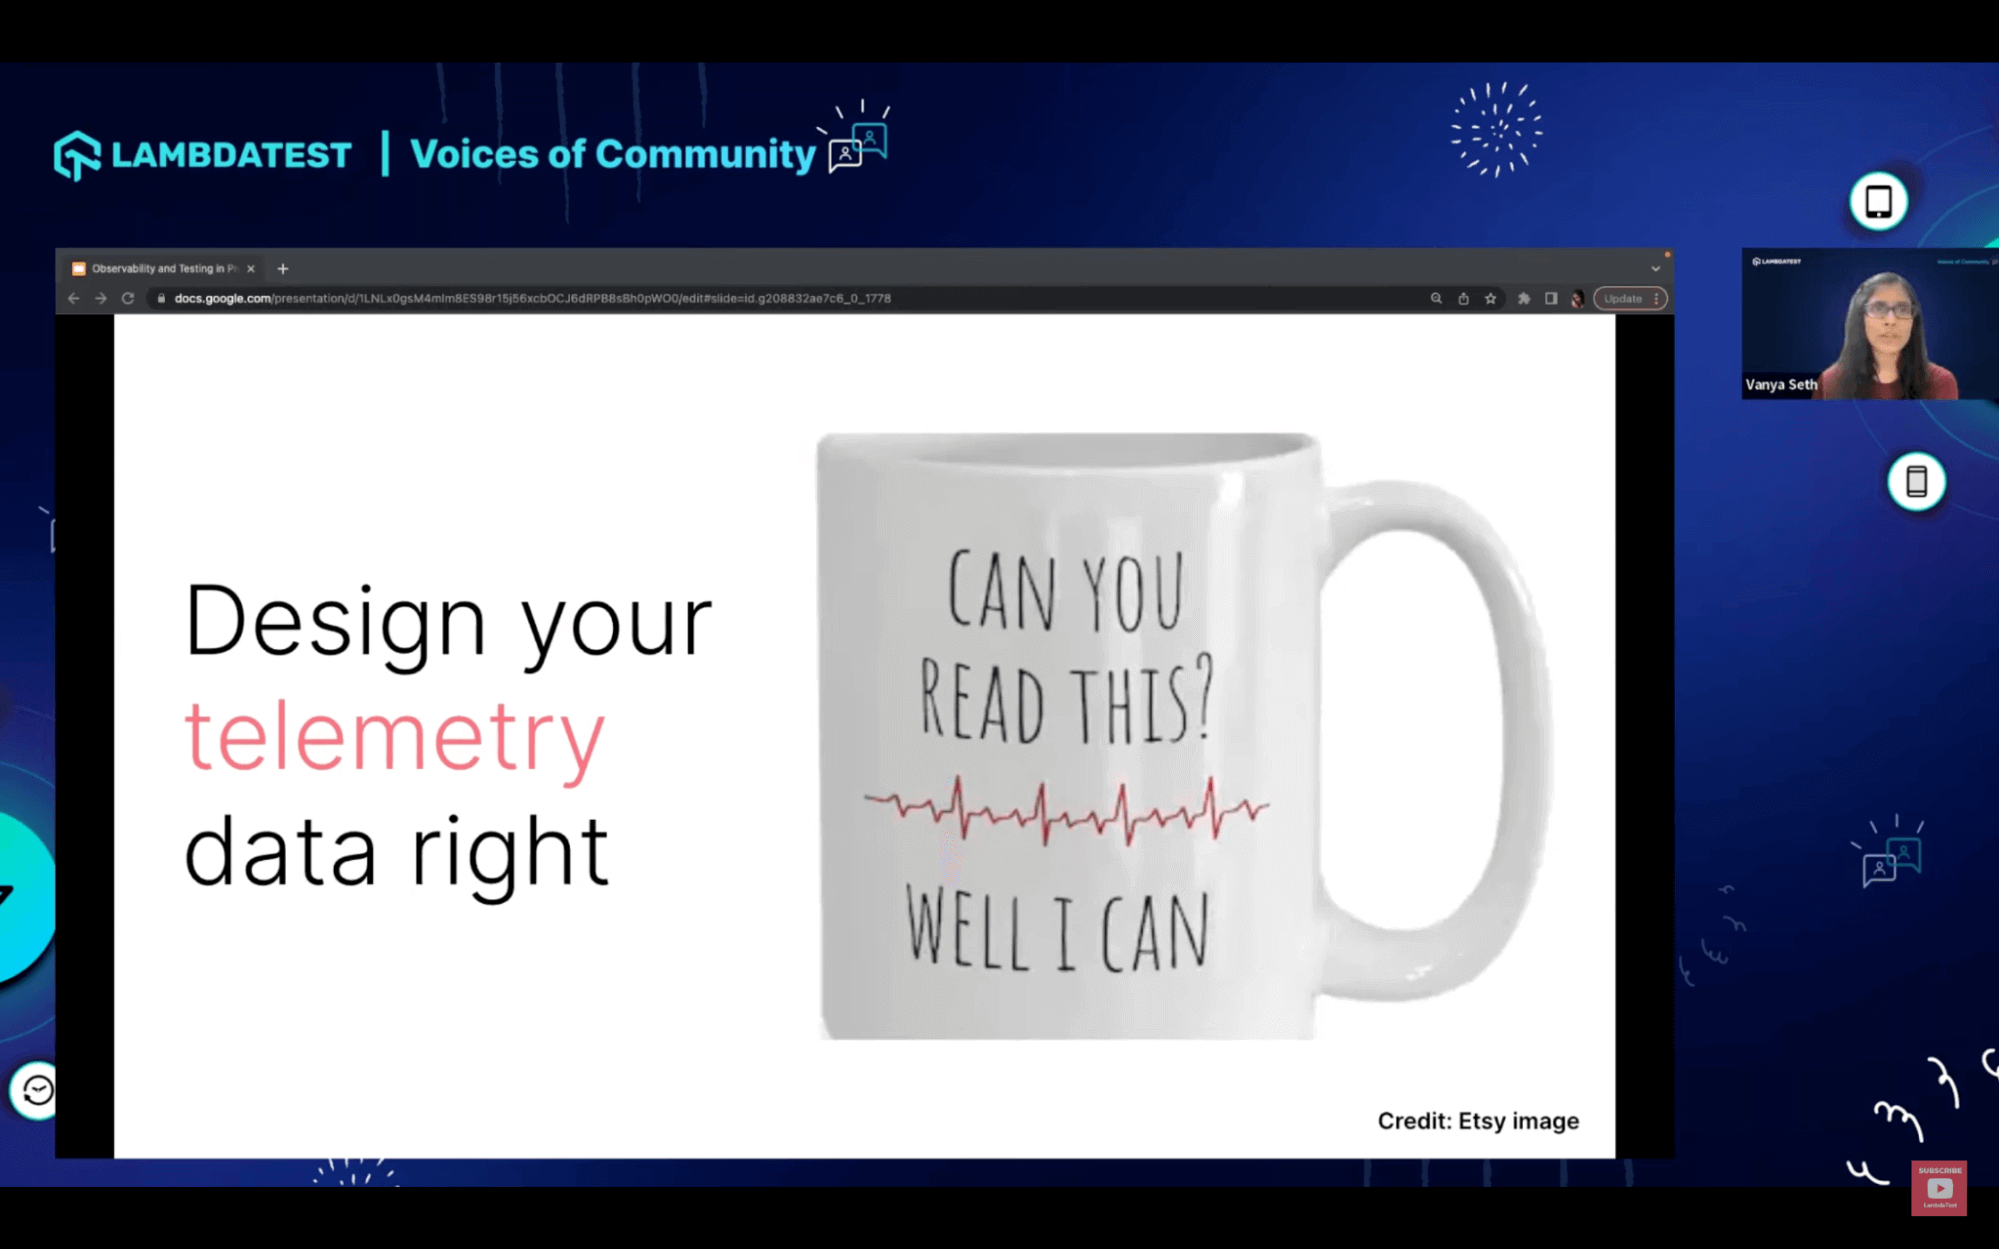
Vanya talks about designing your telemetry data. In the days of monolith architecture, she worked with single processes and human-readable logs.
With the evolution of serverless and managed services from a cloud perspective, the idea is to deliver machine-readable logs. The switch from human-readable logs to machine-readable logs needs to happen, and how we define the right structure of the telemetry data becomes extremely critical.
Further, Vanya discusses conventions for designing telemetry data that teams must follow.
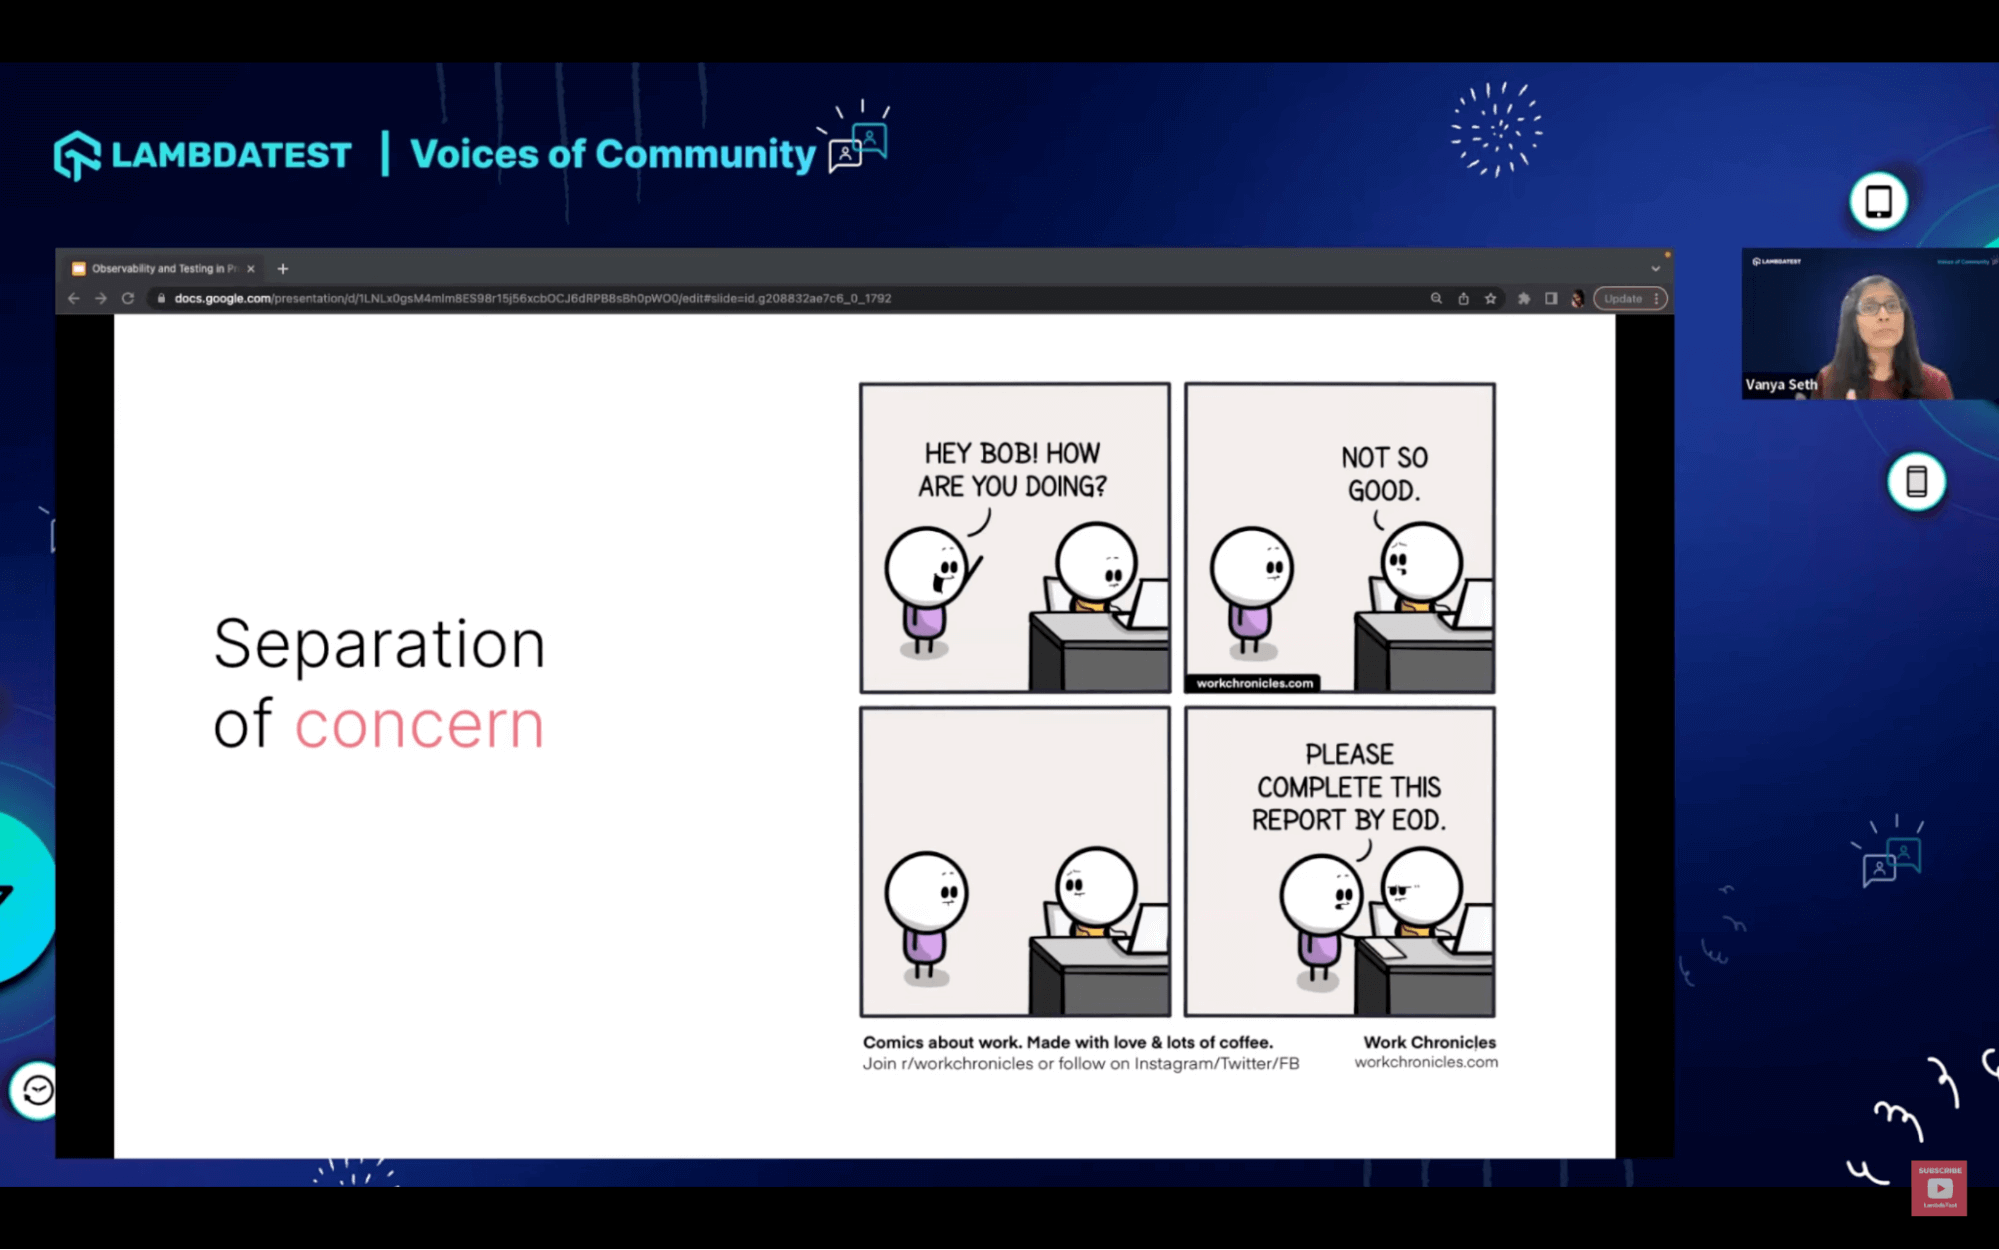
Separation of Concern
Separation of concern is a widely understood principle from designing classes or functions. We practice separation of concern to the nth level. Vanya explains to the viewers the need to practice separation of concern in observability. The aim of a developer or a quality engineer is always to observe their system reliably; even if the system were to go down, they should be able to observe what happened and why it happened, bringing reliability into the picture.
They need to decouple their data sources from their data syncs and take out the observability data blast radius of their current system and services deployment to an outside location right think about some system so that even if something happens to the operational system, the logs are always available to debug.
What to trace and log?
She then shares her insights on the other dimensions we should consider, such as how we manage our systems’ capacity and the cost implications of storing large logs.
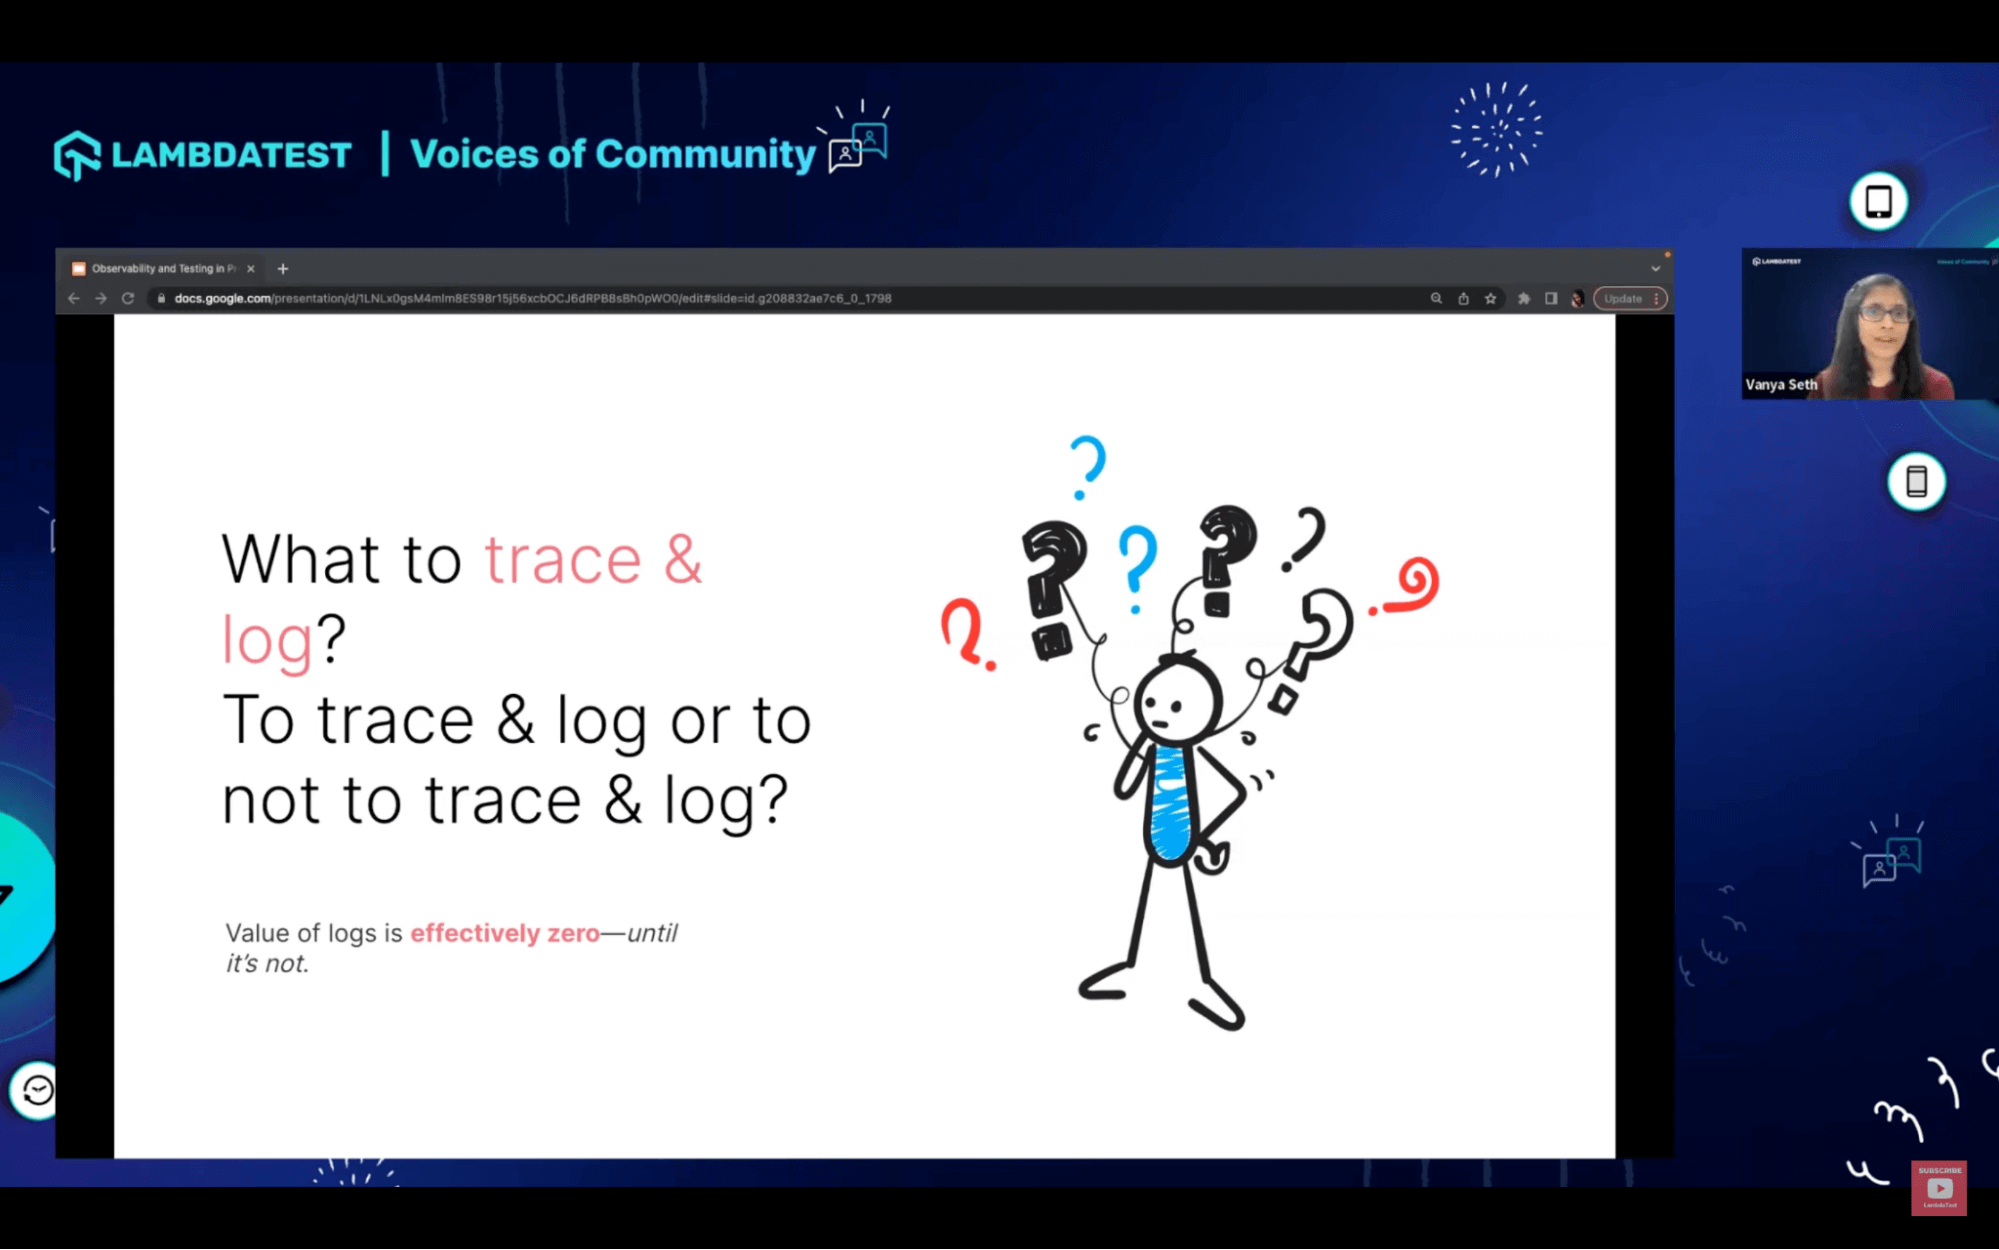
Observability is Evolutionary; as we talk about the knowns and unknowns, the possibilities are endless. The more we observe, the more we understand our system; how do we evolve our monitoring dashboards? How do we cut down the noise on the dashboard? How do we reduce the noise on the alarms we have set up on top of those monitoring dashboards? How do we improve our logging? How do we improve our traces? How do we log the most optimum information to do root cause analysis?
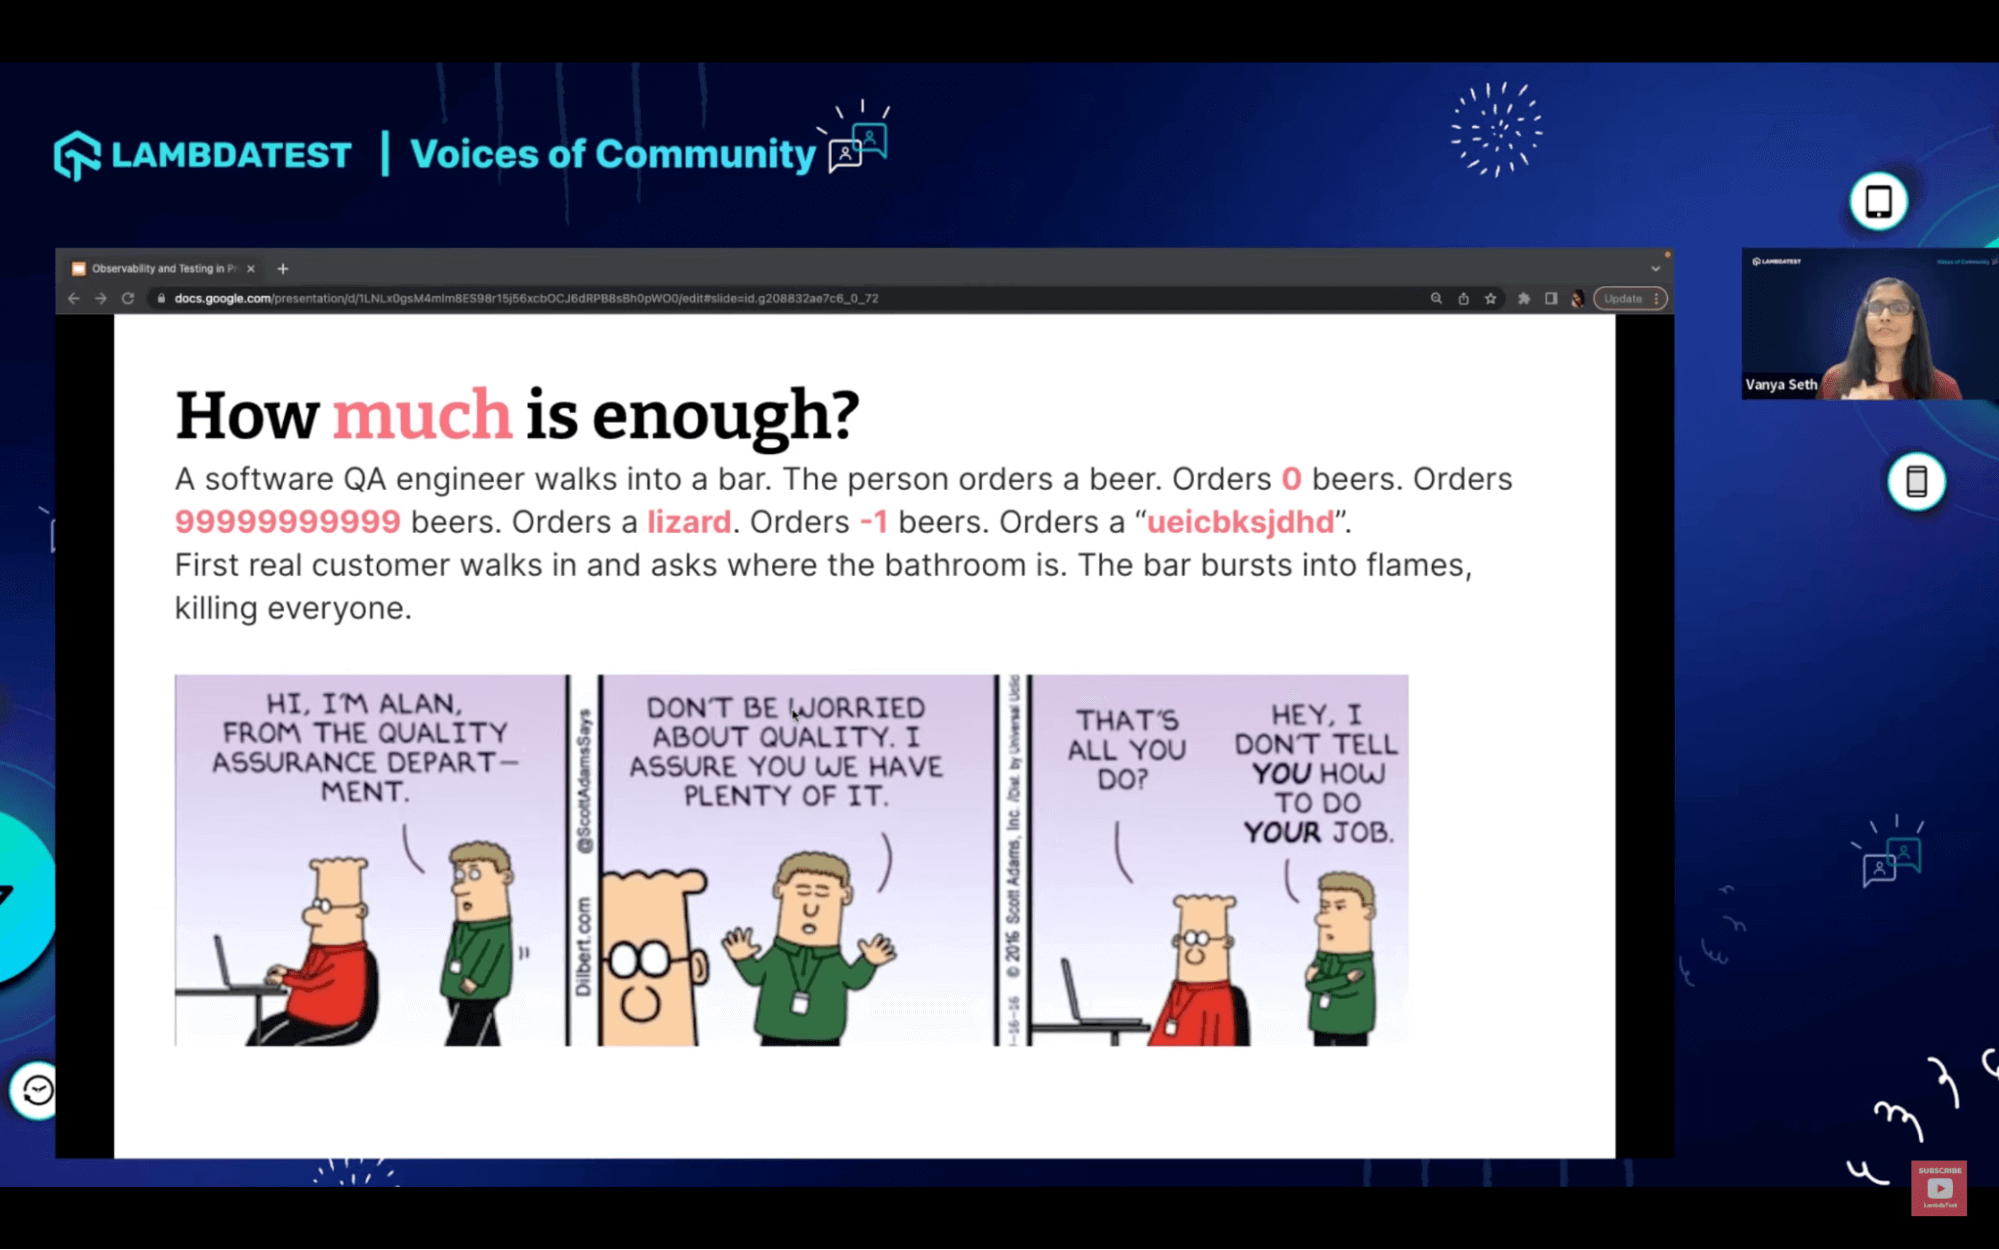
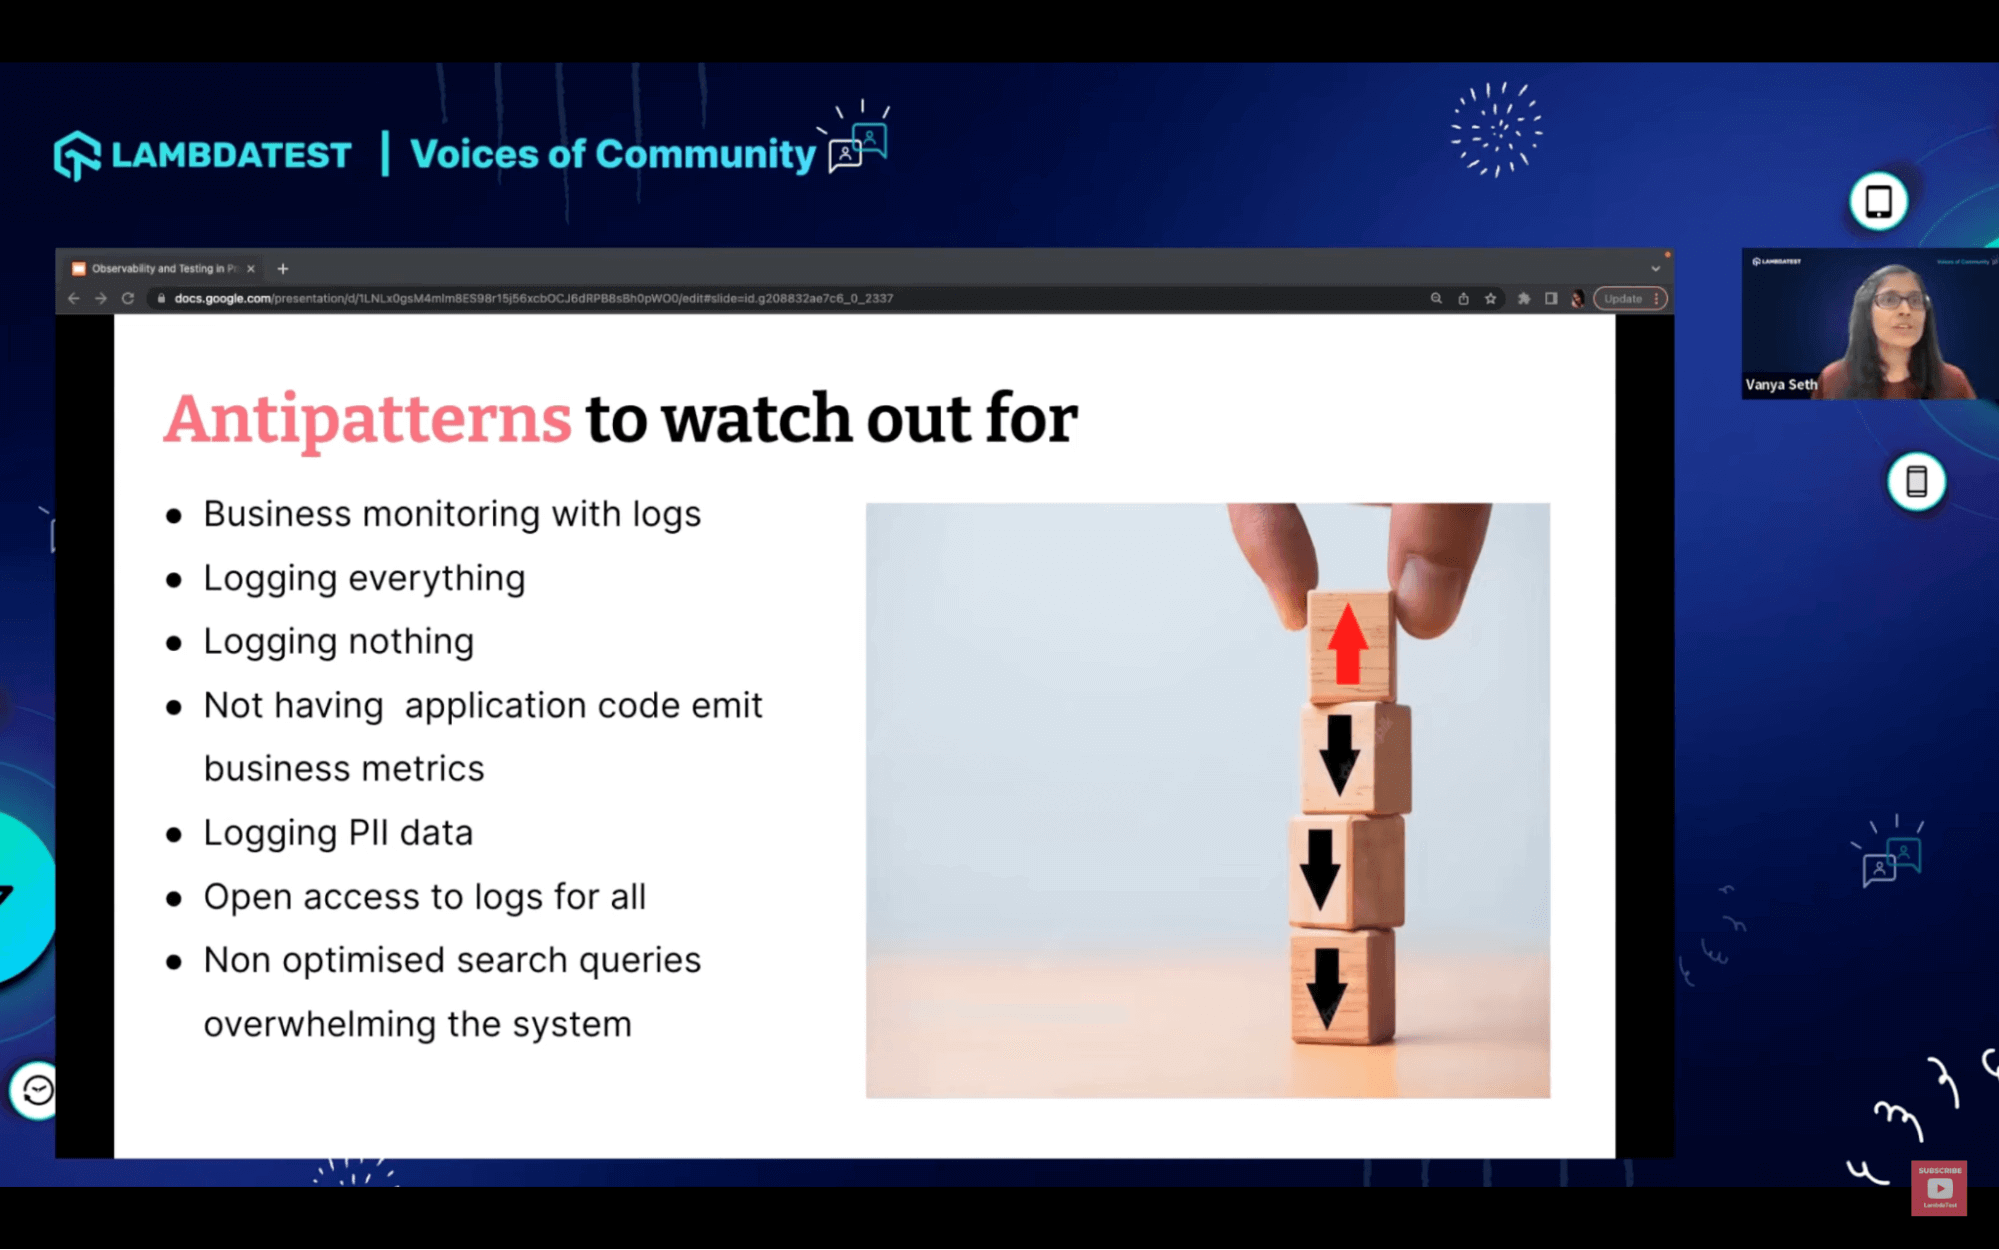
Antipatterns to watch for
Vanya then shares some of the important antipatterns we must watch out for a while planning our observability strategy.
Are you testing in production?
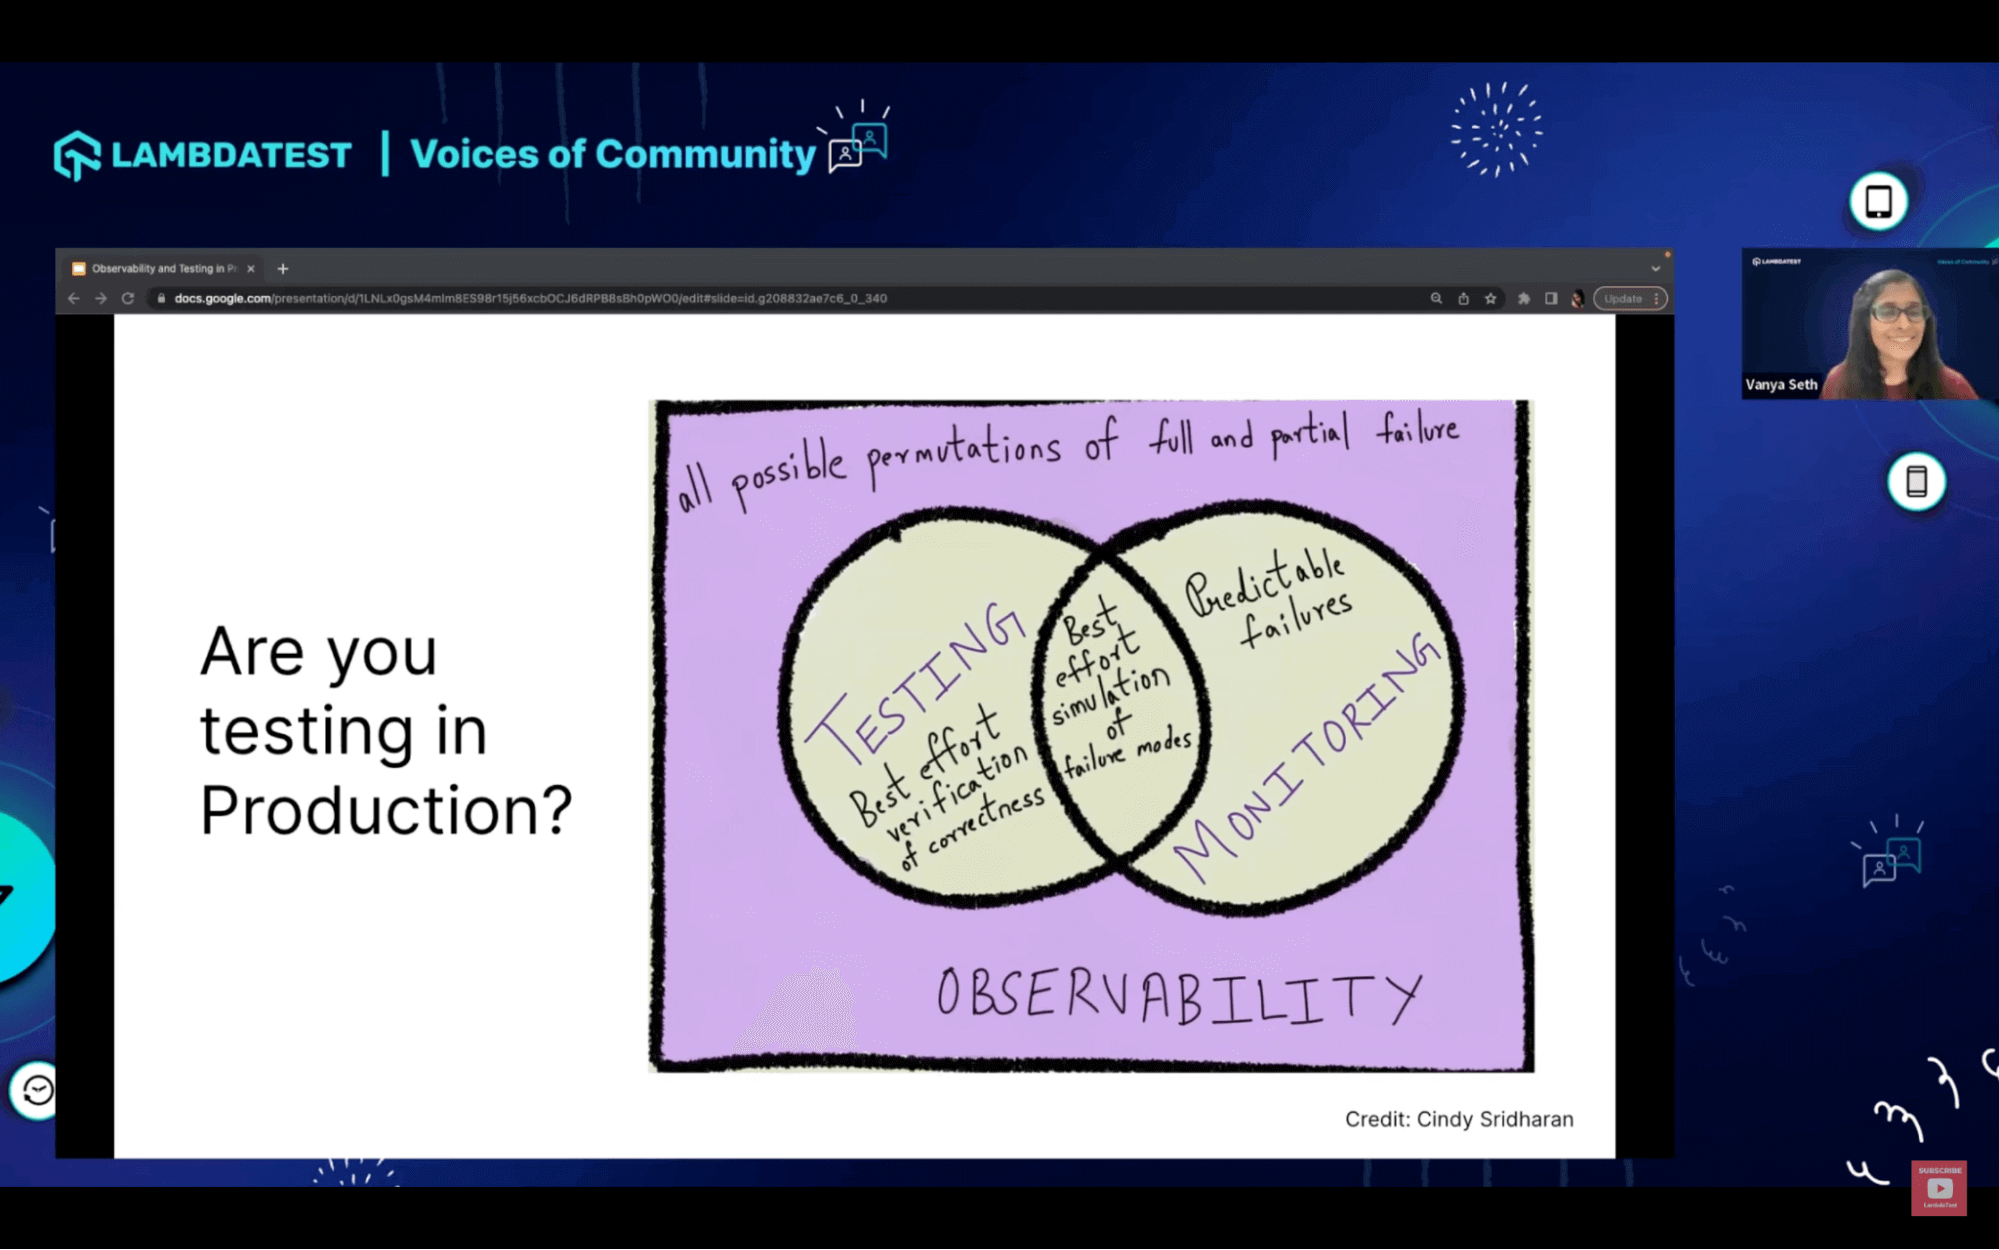
Vanya then further explains observability is all possible permutations of full and partial failure of your application ecosystem. Testing is your best effort to verify the correctness of the product you’re building, whereas monitoring is the predictable failure.
She further talks about embracing the need for testing in production by monitoring and observing the entire ecosystem and how everything is coming together in production.
Wrapping Up
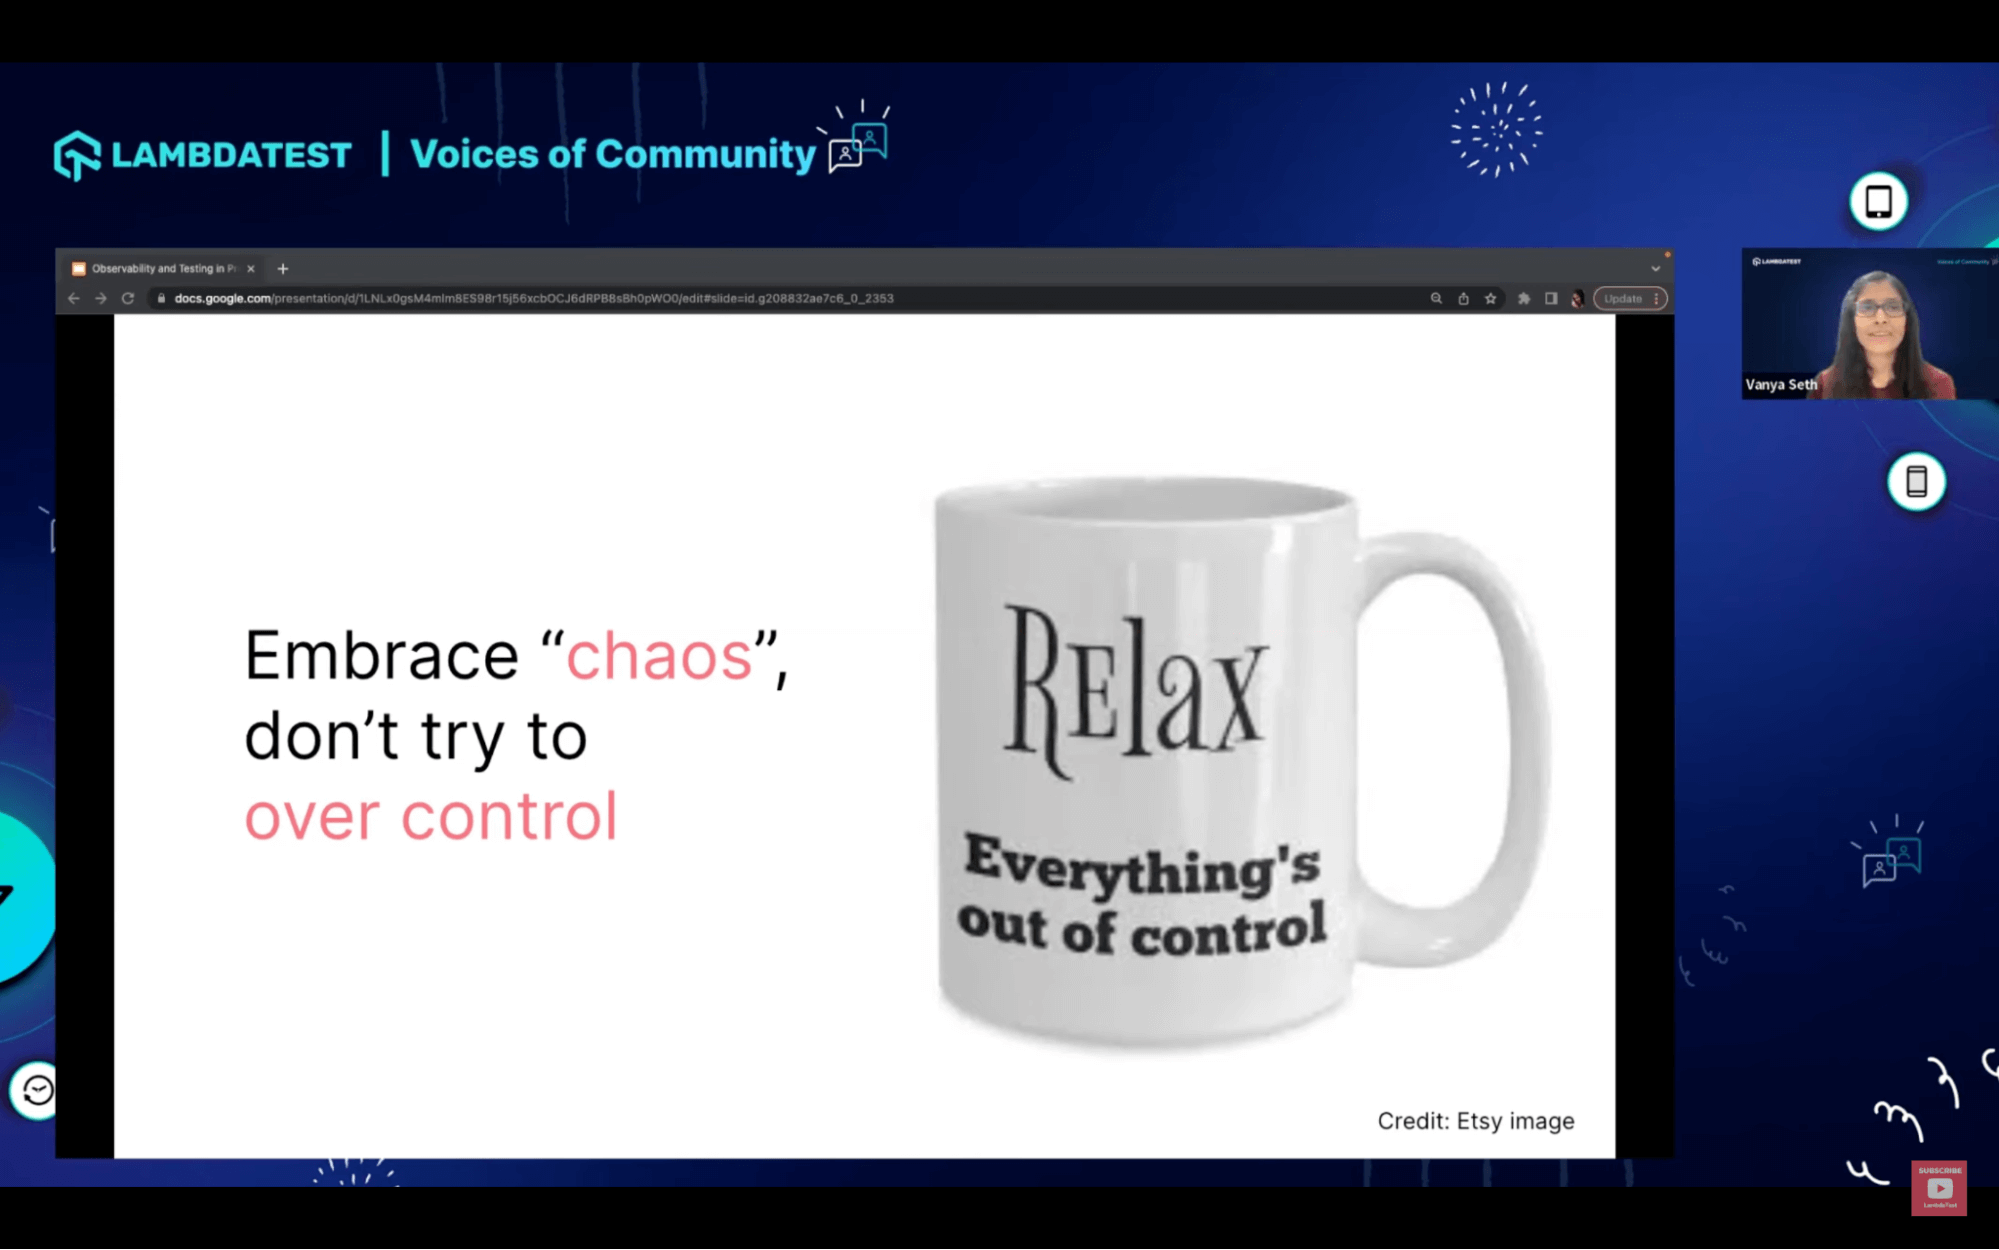
As wrapping up her talk, she gave an important tip to follow about how we should embrace the chaos and not try to overcontrol it because things will never be fully in control and the ability to cope with this dynamism and the ability to embrace this chaos is something that’s going to help us become better quality engineers.
Q&A Session:
Before wrapping up, Vanya answered several questions the viewers raised. Here are some insightful questions from the session:
Q. How do you verify that Observer data is being analyzed effectively and that insights and recommendations generated from this data are accurate and actionable?
A: To achieve effective observability, teams should start by thinking about what data they need to capture and emit from their application in the form of logs, traces, or metrics. Guidelines should be created for autonomous teams, ensuring the data quality is good and actionable. This requires effort, and it’s an iterative process. Teams must work together to create an observability strategy that promotes high-quality observability data, which can be used as a feedback loop to improve the system continuously.
Q. How can a QA with no microservices experience learn about observability? Any advice or recommended steps to take, such as using a playground to practice and gain insights from testing in production?
A: To learn about observability, set up an open-source tool like Eager in your Docker container and explore the example application. Analyze how information is collected, traces are created, and context is passed between services. Make changes to the application to learn more. This hands-on approach will help you understand observability’s first principles. Additionally, many great articles and talks are available to supplement your learning.
Hope You Enjoyed The Webinar!
We hope you liked the webinar. In case you missed it, please find the webinar recording above. Share this webinar with anyone who wants to learn more about moving forward with an effective test automation strategy. Stay tuned for more exciting LambdaTest Webinars. You can also subscribe to our newsletter Coding Jag to stay on top of everything testing and more!
That’s all for now, happy testing!


Author’s Profile
Sparsh Kesari
Sparsh Kesari is a software developer specializing in Full Stack Development. He is an Open Source enthusiast and has been part of various programs including GitHub Externship. He has also interned at organizations like GitHub India, RedHat, MeitY, Government of India. He is actively involved in the testing and QA community work as well. In his current position, he works as a Developer Relations Engineer at LambdaTest, exploring and contributing to the testing world.
Blogs: 9
Got Questions? Drop them on LambdaTest Community. Visit now


