
25 Best Debugging Tools for 2024
Mythili Raju
Posted On: February 26, 2024
![]() 167984 Views
167984 Views
![]() 33 Min Read
33 Min Read
Debugging involves identifying, tracing, and correcting bugs or defects in software code to ensure it operates correctly. It’s a critical step in software development, aimed at enhancing functionality and user experience.
Debugging can be complex—it’s no secret that bugs can destroy a lovely bit of code. Luckily, several tools can make debugging easier. Some debuggers allow you to set breakpoints so that your program stops at specific points, letting you peek and poke around and see what’s happening.
Others allow you to record actions and play them back later, which is helpful if you want to test the steps you took when the bug occurred. One tool even lets you create a virtual machine instance of your program to test it in a safe environment.
As per the Verified Market Research, the global market of debugging tools is drastically increasing and is set to reach $2022 by 2030.

In this article, you will understand the various debugging tools and how to leverage them to enhance your development workflow. Debugging may seem difficult sometimes, but with the right tools and techniques, you can turn it into a manageable and enjoyable aspect of software development. So stay tuned for our in-depth exploration of debugging tools and practices.
TABLE OF CONTENTS
What is Debugging?
Debugging is a critical process in software development, involving identifying, analyzing, and resolving bugs or errors in code. It ensures software functions correctly and efficiently, often using specialized tools for error detection and fixing.
What is Online Debugging?
Online debugging is a unique feature that enables developers and testers to assess and troubleshoot specific components using various web browsers in real-time. It allows testers to thoroughly examine and evaluate crucial components online, using different combinations of web browsers.
The web landscape is highly fragmented into various device-browser combinations where every browser contains its most recent and older versions, increasing complexity.
Creating web applications that offer a quality user experience on all devices will be a big task for developers or teams.
This problem can be solved by developers or teams using a real device cloud that is hosted by any cloud-based testing platform. Developers that use cloud-based platforms for testing also have access to DevTools to examine particular web page elements on real devices. Debugging HTML, CSS, and JavaScript on the target devices is now easy and practical.
 Note
NoteAchieve unparalleled speed in debugging. Try LambdaTest Today!
Why is Online Debugging Required?
Software developers and testers use debugging methods to find and correct program bugs before making them available to the users. It’s another step to testing, which entails discovering how a mistake affects a program. Here are some benefits of using online debugging for any application or website:
- Streamlines the software development process, meaning you produce high-quality products for your customers.
- It helps to identify potential issues and errors immediately so that these can be fixed before the changes are pushed to the production environment.
- It helps to understand and evaluate the overall quality of the built systems.
- It allows different teams to identify areas that need improvements. The modules or functionalities that had issues can be tested more thoroughly.
- It ensures that the quality of the application or website remains great from a delivery perspective.
Steps Involved in Debugging
Determining and addressing code bugs is a crucial step in creating debugging software. It involves finding the error, identifying the fault location, analyzing it, and fixing it. These procedures let programmers fix issues and raise the caliber of their software. When you undertake debugging, the following steps are necessary:
- Finding the error: It is essential because doing so will help you save time and effort.
- Identify the fault Location: After the fault has been detected, you must assess the precise location of the error.
- Analyze the Error: After pinpointing the error’s precise position, you should take some time to consider the error’s specifics. You can verify the currently running program or webpage to determine if the problem will not affect the system’s functionality.
- Fix and Validate: The last step is correcting mistakes and checking the system’s functionality.
Debugging Environments
Various debugging environments are available when using Visual Studio and the Windows Driver Kit (WDK) to identify and fix problems in software development. These settings consist of the following:
- WinDbg preview is a contemporary debugger with an easy-to-use interface.
- A potent debugger for Windows programs, drivers, and the operating system is the Windows Debugger (WinDbg).
- Made explicitly for debugging Windows kernel-mode components is the kernel debugger (KD).
- NTKD is a debugger for Windows NT operating systems that operates in kernel mode.
- A command-line debugger that offers a simple debugging interface is the console debugger (CDB).
- A command-line debugger used to troubleshoot Windows operating systems is called the NT Symbolic Debugger (NTSD).
These debugging environments are compatible with x86, x64, and Arm CPU architectures. They enable programmers to track down complex software problems, establish breakpoints, check variables, and analyze rapid execution.
Developers may efficiently troubleshoot and fix defects by utilizing these debugging environments, assuring their software applications work smoothly and error-free.
Best Debugging Tools for 2024
Let us understand the best debugging tools for the year 2024 that offer unique features. This will help you choose the right tool based on your budget and project requirements.
Here are some listed best debugging tools used by different brands all around the globe to make developers and testers work easy.
1. LT Debug from LambdaTest
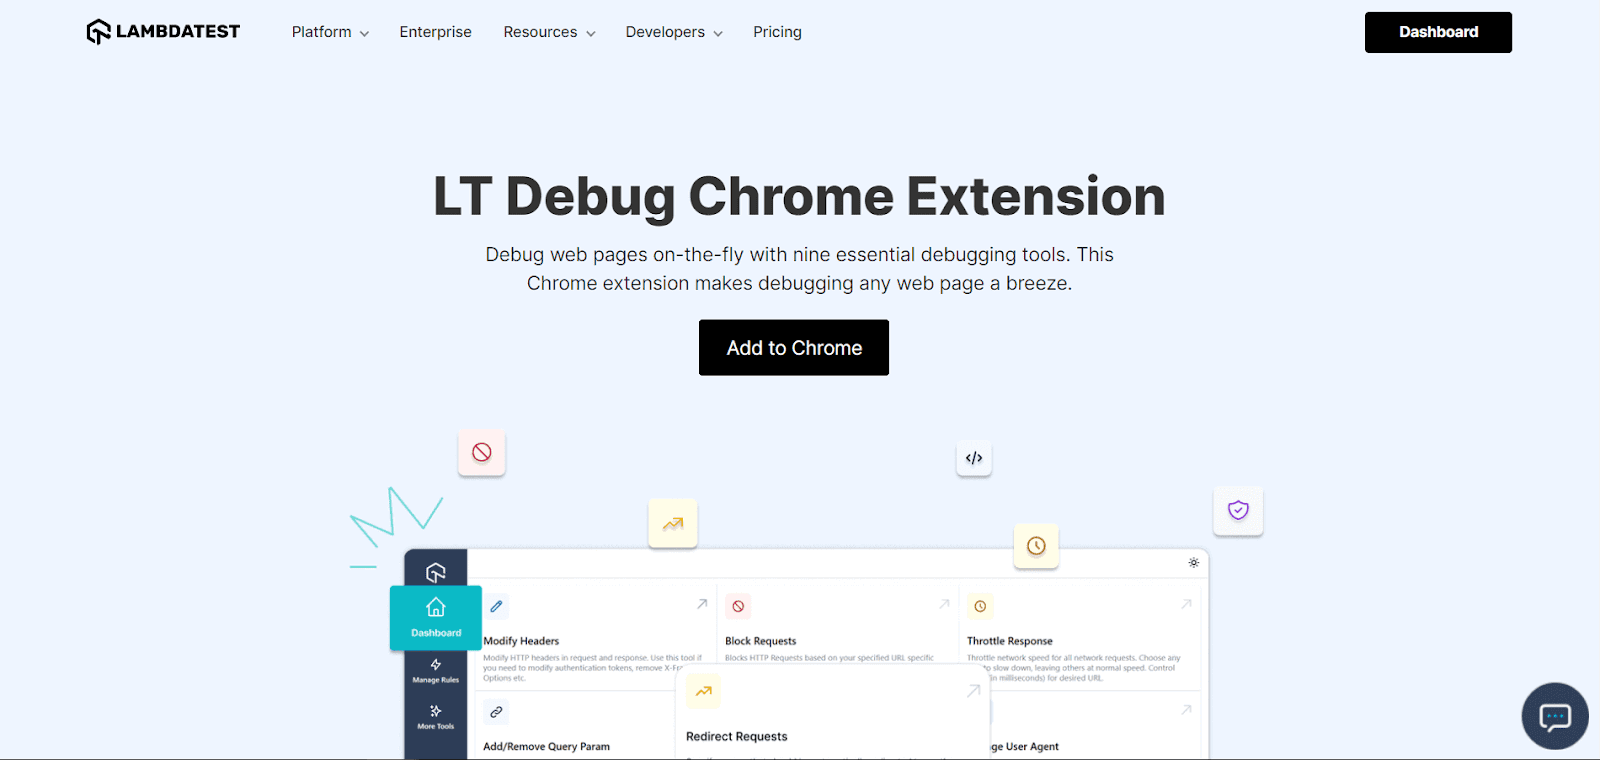
LambdaTest is an AI-powered test orchestration and execution platform that lets you run manual and automated tests on over 3000+ real browsers, devices, and OS combinations at scale.
LT Debug from LambdaTest is a simple and free developer tool that adds a new dimension to your debugging needs. The installation of LT Debug is easier than you can think. You need to navigate to the LT Debug Chrome Extension page and add the required Chrome extension, which means you are all set to use the required feature without too many hassles.
Here are some key reasons why LT Debug by LambdaTest stands out as one of the best debugging tools available:
- Add, remove, or modify the header as a request or a response header. It allows you to test the header details quickly.
- Block HTTP requests based on the specific URL filter conditions.
- You can perform network throttling, effectively managing the network speed for every request.
- Add or remove query parameters.
- Use the redirect request tool when you wish to configure a URL to redirect them to your preferred web URL.
- Switch between different user-agent strings in a faster manner.
- Simulate the web page experience as soon as you inject the CSS or JS script into the console.
- If you want to perform cross-domain Ajax requests in websites and web apps rapidly, just add the (Access-Control-Allow-Origin: *) rule to your response header.
- Content security policy to remove the content security policy header on any website/web page you choose.
As per the customers using this functionality, this LT Debug has no significant disadvantages.
The video below shows how you can use developer tools provided by LambdaTest to debug mobile browsers.
You can also Subscribe to the LambdaTest YouTube channel for details guidance on various automation testing process like Selenium, Cypress, Playwright,cross-browser compatibility, and more.
Note: You can easily Debug Android Apps On the Cloud with LambdaTest. Test and debug your web and mobile apps on real Android devices and Official Android Emulators.
2. Airbrake
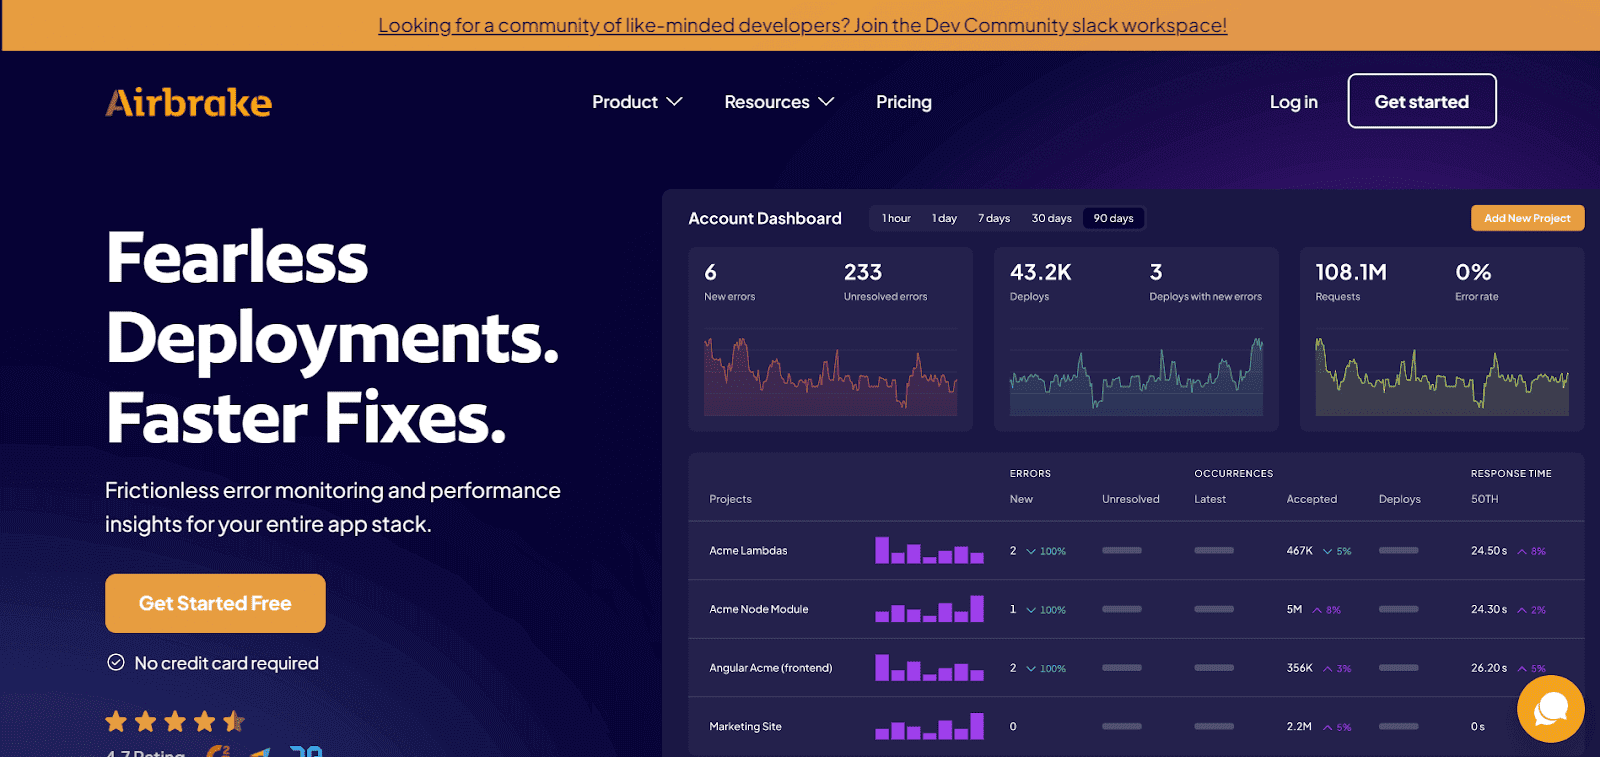
Airbrake emerges as one of the best debugging tools in the form of a cloud-based error and bug-reporting solution that suits small and midsize business requirements. It is a developer-centric tool that integrates with your favorite apps as well.
It stands out as a top choice for developers seeking the best debugging tools due to its ease of setup, robust error monitoring capabilities, and seamless integration with existing workflows and applications. It empowers businesses to maintain the reliability and performance of their software projects with efficiency and precision.
Here are some of the primary features typically associated with Airbrake, one of the best debugging tools available:
- Error Tracking: Monitors errors and exceptions with detailed information.
- Real-time Notifications: Sends instant alerts via email, Slack, and more.
- Error Grouping: Automatically categorizes similar errors for efficient problem-solving.
- Detailed Error Reports: Provides in-depth error data, including code line and user details.
- Integration with Development Tools: Seamlessly connects with GitHub, GitLab, JIRA, Slack, and others.
- Custom Error Filtering: Allows developers to tailor notifications by excluding specific error types.
- Performance Insights: Offers performance metrics like response times.
- Error Trend Analysis: Helps identify recurring issues over time.
- Custom Dashboards: Creates personalized visualizations and tracks performance metrics.
- User Feedback Integration: Gathers user input on errors and issues.
- Compliance and Security: Ensures data protection and privacy through compliance measures.
3. Chrome DevTools
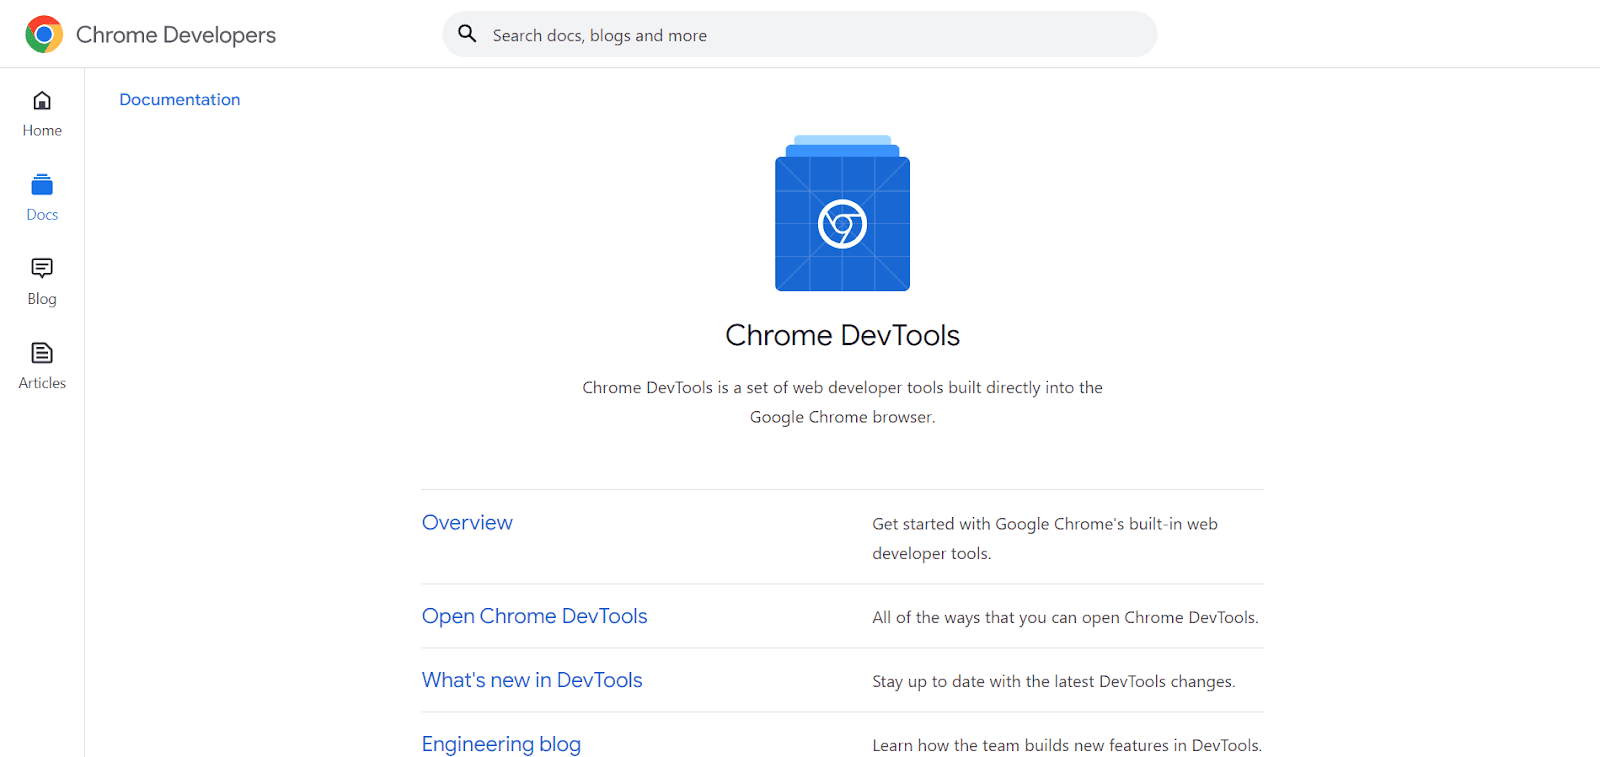
Google Chrome is a highly popular web browser that goes beyond browsing. It includes robust web authoring and debugging capabilities, allowing users to perform various tasks such as testing mobile viewport displays and assessing the performance of entire websites and specific components.
Listed core features collectively make Chrome DevTools one of the best debugging tools for web developers, aiding in debugging, optimization, and quality assurance for web applications.
- Element Inspection: Easily inspect and manipulate HTML and CSS in real-time, aiding in debugging and design adjustments.
- Console: View JavaScript logs, errors, and warnings, facilitating the debugging of JavaScript code.
- Network Monitoring: Detailed insights into network requests, headers, and timing, crucial for optimizing web performance.
- Sources Panel: Offers a robust JavaScript code editor with debugging capabilities, including breakpoints and variable examination.
- Performance Profiling: Profiling tools identify performance bottlenecks, enabling developers to optimize web applications for faster loading times.
- Application Panel: Manage client-side data like storage and cookies while debugging storage-related issues.
- Audits and Lighthouse: Automated audits and recommendations for improving web page quality across performance, accessibility, SEO, and best practices.
- Device Emulation: Test web page responsiveness by emulating various devices and screen sizes.
- Security Panel: Analyze web page security, identify vulnerabilities, and view security-related information about resources.
- Remote Debugging: Debug web pages on remote devices, including mobile, over USB or network connections.
4. Angular Augury
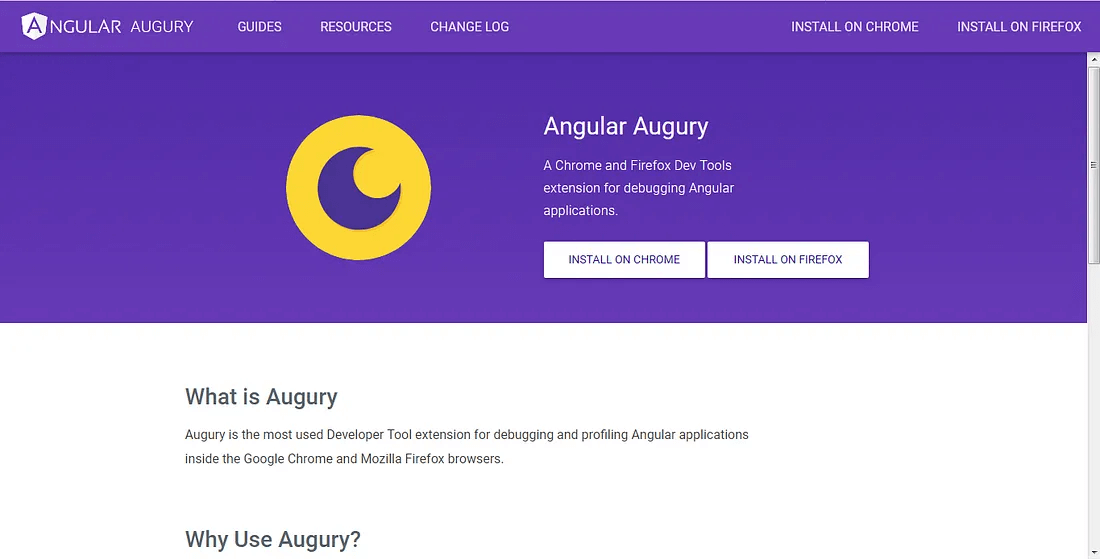
Augury is free as an open-source tool, making it accessible to many Angular developers. It offers powerful capabilities to enhance the debugging, profiling, and optimization of Angular projects. With its intuitive user interface, this tool empowers developers to gain valuable insights into their applications and efficiently manage their components.
It is one of the best debugging tools, offering indispensable features and functionalities that empower developers to streamline their debugging and optimization efforts.
- Component Hierarchy: Augury comprehensively depicts loaded components within the application, presenting their hierarchical relationships for enhanced clarity.
- Change Detection Analysis: Developers can quickly identify whether change detection functionality is utilized within specific components, aiding in optimizing performance.
- Properties and Dependencies: It conveniently lists the properties and dependencies of components, simplifying the debugging process.
- Routing Visualization: It visually represents the application’s routing information, making navigation and routing debugging more accessible.
- TypeScript Code View: It facilitates viewing TypeScript code, offering developers a more informative perspective than compiled JavaScript code.
5. ReSharper
ReSharper is a highly regarded productivity and best debugging tool, serving as an extension for Visual Studio. It is a trusted resource for both individual .NET developers and teams, aiming to simplify code development, promote coding best practices, and expedite the creation of high-quality applications. Pricing options cater to businesses, organizations, and individual customers, including discounts for startup initiatives.
Here are the key features of ReSharper that make it one of the best debugging tools available.
- Real-time Code Analysis and Suggestions: It conducts continuous code analysis, offering recommendations to assist developers in identifying and resolving issues, thus guaranteeing code quality.
- Automated Code Refactoring: It provides a suite of automation tools for code refactoring, improving the maintainability and readability of code.
- Performance Profiling Tools: It include tools for performance profiling, aiding in detecting performance bottlenecks and optimizing application speed.
- Multi-language Support: In addition to C#, ReSharper extends its support to various .NET languages, including VB.NET, ASP.NET, and others, accommodating a wide range of development needs.
- Code Navigation: Streamlines code navigation, allowing developers to quickly find and jump to specific code elements, methods, and files.
- Unit Testing Integration: Seamlessly integrates with unit testing frameworks, enabling efficient test creation, execution, and analysis.
6. Memfault
Memfault is a cloud-based platform that simplifies software development by offering device monitoring, debugging, and update capabilities. It enables development teams to identify and resolve bugs proactively, preventing end-user disruptions. Memfault caters to diverse industries like smart homes, industrial automation, and healthcare, providing modular compatibility with Android and real-time operating systems.
Here are the core features to consider why Memfault is one of the best debugging tools.
- Remote Device Monitoring: Memfault enables remote monitoring of devices, allowing teams to track device performance and identify issues in real time.
- Bugs and Issue Detection: The platform assists in detecting and diagnosing bugs before they impact end-users, enhancing product reliability.
- IoT Product Development: Memfault supports product development across various industries, offering versatile solutions for smart homes, industrial automation, healthcare, and more.
- Modular Compatibility: It seamlessly integrates with Android and various real-time operating systems, ensuring flexibility and compatibility with different development environments.
7. GDB
GDB, part of the GNU project, is an open-source debugger designed for UNIX systems and supports multiple programming languages like C and C++. It empowers developers with a command-line interface for executing various debugging tasks. With GDB, users can effortlessly monitor internal program variables, invoke functions independently, and even engage in remote debugging for debugging applications on remote systems.
Here are some core features why it’s considered one of the best debugging tools.
- Command-Line Interface: It offers a command-line interface (CLI) that allows developers to execute various debugging tasks efficiently.
- Variable Monitoring: GDB enables users to monitor and inspect internal program variables, facilitating real-time tracking of program data.
- Function Invocation: Developers can independently call functions within the debugging session, aiding in code analysis and troubleshooting.
- Remote Debugging: GDB features remote debugging capabilities, allowing developers to debug programs running on remote systems, enhancing flexibility in debugging scenarios.
8. Fiddler
Fiddler offers a straightforward and comprehensive debugging and troubleshooting solution, addressing user challenges effectively. It facilitates the debugging of web applications by capturing and analyzing network traffic between the internet and testing environments, allowing users to monitor requests and responses.
Here are some core features of Fiddler that make it one of the best debugging tools available:
- Traffic Analysis: Fiddler captures and logs network traffic, facilitating in-depth analysis of web application data flows.
- Data Security: The tool ensures the security and privacy of sensitive information during the debugging process.
- Free Trial Benefits: Fiddler’s free trial grants users full access to the software, easy upgrade options, and comprehensive documentation for a seamless experience.
9. SonarLint
SonarLint is an IDE extension that ensures your coding is clean and best-notch regarding quality. It helps you find and fix bugs and security-related issues when coding. It is similar to a spell checker where the issues are highlighted so they can be set before the code commits. Another tool is SonarQube, but SonarLint is preferred as it offers instant feedback.
Here are some core features why SonarLint is one of the best debugging tools available:
- Code Quality Analysis: SonarLint performs thorough code quality analysis, helping developers maintain clean and high-quality code.
- Bug Detection: It identifies and flags coding bugs and potential security issues in real-time, aiding in early issue resolution.
- Integration with IDEs: SonarLint seamlessly integrates with various integrated development environments (IDEs), making it convenient for developers to access its capabilities within their preferred coding environment.
- Cross-Platform Compatibility: It supports multiple IDEs and programming languages, ensuring versatility and adaptability for different development setups.
- Integration with SonarQube: While SonarLint is used for local development, it can be integrated with SonarQube for comprehensive code analysis and reporting in larger projects.
10. IBM Rational Software Analyzer

IBM Rational Software Analyzer is a software analysis tool that allows you to review code and find bugs. It helps to enforce code quality early during the software development process. Identifying and closing defects before the software is delivered is always advantageous. This tool is built on an extensible framework and seamlessly integrates with third-party tools.
Here are some core features of IBM Rational Software Analyzer that make it one of the best debugging tools available:
- Early Defect Detection: Helps uncover and address defects in code before software delivery, saving time and resources.
- Extensible Framework: Built on a flexible architecture, making it adaptable to various development environments and needs.
- Third-Party Integration: Easily integrates with external tools, enhancing its capabilities and compatibility.
11. Sourcery CodeBench
It delivers a complete toolset allowing software professionals to create and optimize the software for various targets and domains such as Automotive, Video Applications, Connectivity, and Graphics. It is way beyond a compiler where you can build and debug systems designed using different architecture requirements.
Here are some core features of why Sourcery CodeBench is one of the best debugging tools available:
- Multi-Domain Support: Sourcery CodeBench supports a wide range of domains, allowing software professionals to work on projects spanning automotive, video, connectivity, and graphics applications.
- Complete Development Toolkit: It offers a comprehensive set of tools, including debugging and optimization features, for the entire software development lifecycle.
- Architecture Flexibility: Sourcery CodeBench is adaptable to different architectural requirements, making it suitable for various software projects and targets.
- Advanced Compilation: The tool provides advanced compilation capabilities, efficiently creating software systems for specific domains.
12. Xpediter

BMC Compuware Xpediter is a debugging and interactive analysis tool tailored for COBOL, Assembler, PL/I, and C programs. It accelerates code comprehension, enables swift modifications, and ensures secure issue resolution. After executing code requirements, developers can meticulously review data and results, line by line.
Here are some core features of Xpediter, one of the best debugging tools available:
- Multi-Language Debugging: Xpediter supports debugging across multiple programming languages, enhancing its versatility for diverse software projects.
- Interactive Code Debugging: It offers an interactive debugging environment, allowing developers to step through code, set breakpoints, and inspect variables to identify and resolve issues effectively.
13. Raygun
This cloud-based solution excels in performance monitoring and debugging. Its versatile functionality extends beyond traditional debugging, allowing users to seamlessly collect crucial data on end-user issues, encompassing crash reporting and bug feedback.
This exceptional tool excels in front-end performance monitoring and offers robust service-side performance monitoring capabilities. It goes a step further by conducting in-depth end-user fault detection analysis. Its seamless integration with third-party tools like Jira sets it apart, enabling comprehensive bug tracking and in-depth analysis.
In the realm of debugging tools, this cloud-based solution stands out as the best debugging tool, not only due to its comprehensive performance monitoring capabilities but also its unparalleled ability to gather end-user insights, making it an indispensable asset for developers and teams seeking to optimize their applications and streamline their debugging processes.
- Performance Monitoring: The tool excels in real-time performance monitoring, helping users pinpoint bottlenecks and optimize application speed.
- End-User Issue Collection: It seamlessly collects crucial data on end-user issues, including crash reporting and bug feedback, for effective resolution.
- Front-End Performance Monitoring: Offers robust front-end performance monitoring capabilities to ensure a smooth user experience.
- Server-Side Performance Monitoring: Provides comprehensive server-side performance monitoring to identify and address backend issues.
- End-User Fault Detection Analysis: Conducts in-depth analysis to detect and diagnose end-user faults, enhancing application reliability.
- Third-Party Integration: Seamlessly integrates with third-party tools like Jira for comprehensive bug tracking and detailed analysis.
- Comprehensive Performance Insights: Offers actionable insights into application performance, allowing developers to make informed optimization decisions.
- Streamlined Debugging: The tool streamlines the debugging process by combining performance monitoring and issue collection, making it a valuable asset for developers and teams.
14. IDA Pro
It is a disassembler and debugger tool used for analyzing and reverse engineering binary executables. It excels in converting machine code into readable assembly language, aiding in understanding and analyzing complex software. With its extensive plugin support and a vast user community, IDA Pro has become a standard choice for security researchers, malware analysts, and software engineers.
Here are some core features of IDA Pro that make it one of the best debugging tools available:
- Interactive Debugger: It includes an interactive debugger that aids in dynamic analysis, allowing users to step through code execution and inspect memory.
- Disassembly: It disassembles binary code, converting it into assembly language, making it human-readable, and facilitating code analysis.
- Cross-Platform Support: IDA Pro supports multiple platforms and architectures, making it versatile for analyzing various software and systems.
- Scripting Support: It offers scripting support, allowing users to automate tasks and customize analysis workflows.
- Hex View: Users can switch between disassembly and hexadecimal views for a detailed examination of binary code.
- Collaboration: IDA Pro supports collaborative analysis, allowing multiple users to work on the same project simultaneously.
- Code and Data Cross-References: Users can easily navigate code and data cross-references to understand code relationships and data dependencies.
- Analysis Tools: IDA Pro provides various analysis tools, including function and string recognition, to assist in identifying code patterns and structures.
- Data Structure and Enumeration Support: Users can define data structures and enumerations to aid in code understanding.
15. Rookout
Rookout allows engineers to solve customer issues at a 5x pace. It makes debugging easy and accessible in any environment, from cloud-native to on-premises and from development to production. You can handle the complexities with utmost ease. You can also capture live debugging data across your tech stack.
Here are some core features of Rookout, one of the best debugging tools available:
- Cloud-Native Compatibility: Rookout seamlessly integrates with cloud-native environments, ensuring debugging capabilities across modern development infrastructures.
- Accessible Debugging: Debugging is made accessible and user-friendly for developers, reducing the learning curve and enhancing productivity.
- Tech Stack Coverage: Rookout can capture live debugging data across your entire technology stack, including multiple programming languages and frameworks.
- No Code Changes Required: It allows debugging without needing code changes or redeployment, streamlining the debugging process.
- Production-Ready Debugging: Rookout is suitable for debugging in production environments, minimizing downtime and disruption.
16. SmartBear AQTime Pro
AQTime Pro from SmartBear is a debugger that uses complex memory and performance information. It transforms into actionable insights so developers can easily find bugs and evaluate their root causes. AQTime Pro has allowed 1000s of developers across different domains to deliver top-notch software quality, which means that your code quality is not compromised at any cost.
Here are some core features of AQTime that make it one of the best debugging tools available:
- Performance Profiling: AQTime Pro lets you analyze your code’s performance, identifying slow or resource-intensive parts that need improvement.
- Code Coverage Analysis: It helps you determine which parts of your code have been tested and which haven’t, ensuring thorough testing.
- Memory and Resource Profiling: You can track memory usage and resource allocation, helping to prevent memory leaks and excessive resource consumption.
- Integration: AQTime Pro integrates seamlessly with popular development environments, making it easy to incorporate into your workflow.
- Reporting: It provides detailed reports and visualizations, making it easier to understand and address performance issues.
17. DevPartner

DevPartner is a software development and testing tool developed by NuMega, which Micro Focus acquired. There are two different versions – One is for .Net applications, and another is for Java applications. The DevPartner Studio is a suite of tools that allows developers to manage code requirements effectively.
Here are some core features of DevPartner, making it one of the best debugging tools available:
- Code Management: DevPartner helps developers organize and manage their code requirements efficiently, making it easier to work on software projects.
- Integration: DevPartner integrates with popular development environments, making it easy for developers to use it alongside their existing tools.
- Performance Profiling: It provides tools that help identify bottlenecks and areas where the software can be optimized for better speed and efficiency.
- Security Analysis: It can also analyze the software for security vulnerabilities, helping to ensure that sensitive data is protected.
18. PlatformIO

PlatformIO labs support the PlatformIO and is a collaborative platform for embedded development. This allows developers and teams to build projects in their preferred environments and compile the same code using different development platforms.
Here are some core features of PlatformIO, making it one of the best debugging tools available:
- Cross-Platform Compatibility: PlatformIO works on different operating systems, and developers can use it on their preferred platform.
- Built-in Debugging: It includes tools to help identify and fix issues in your code.
- Library Manager: It provides a library manager to easily include pre-written code libraries in your projects, saving time and effort.
- Project Management: PlatformIO streamlines project management, allowing you to organize and switch between multiple projects effortlessly.
19. Bugfender
Bugfender is a cloud-hosted remote logging tool designed to pinpoint bugs in your software before they become noticeable to your end users. With Bugfender, you can effortlessly access real-time logs from any user’s mobile or web application. The platform offers a free account for newcomers and provides flexibility through three distinct pricing tiers, catering to the diverse needs of end users.
Here are some core features of Bugfender, making it one of the best debugging tools available:
- Real-Time Bug Tracking: Bugfender allows developers to see and track bugs in their apps as they happen in real time.
- Remote Logging: It lets developers collect information about what’s happening in their apps, even when the app is being used by customers. It helps in understanding and fixing issues.
- Error Reporting: Bugfender automatically reports errors and crashes in the app, making it easier to identify and resolve problems.
- Cross-Platform Support: It works with mobile and web applications, so developers can use it for various projects.
20. Honeycomb.io
Honeycomb.io is an excellent option for enterprises and computer software industries trying to understand and debug production software. It works on fast analysis, where you can evaluate user expectations in complex and unpredictable environments. You can find patterns and insights very quickly so that you can solve problems without any hassles.
Here are some core features of Honeycomb.io, one of the best debugging tools available:
- Fast Analysis: Honeycomb.io is really good at quickly looking at a lot of data to figure out what’s going wrong in software.
- User Expectations: It helps you understand what users expect from your software, especially in complicated situations.
- Finding Patterns: Honeycomb.io can quickly find patterns and insights in the data, which makes solving problems much more effortless.
21. Microsoft Visual Studio Code
The top-tier debugger tool developers use across all platforms and programming languages is Microsoft Visual Studio Code. It speeds up finding and fixing bugs. Developers can quickly locate and fix problems in their codebase owing to its intuitive debugging experience, which improves the quality of the code and boosts program performance.
Here are some core features of Microsoft Visual Studio Code that make it one of the best debugging tools available:
- Intuitive Debugging: It offers an intuitive and user-friendly debugging experience, making it easy for developers to find and fix issues in their code.
- Extensions: It provides a rich ecosystem of extensions and plugins that enhance functionality and customization options.
- Performance Optimization: Visual Studio Code aids in optimizing program performance by highlighting performance bottlenecks.
- Customization: Developers can customize the tool to suit their workflow and coding preferences, enhancing productivity.
- Real-Time Debugging: Developers can debug code in real-time, enabling them to identify and resolve issues as they occur.
22. Rollbar

Rollbar stands out as the best debugging tool renowned for its robust capabilities in JavaScript debugging, encompassing deployment monitoring, exception reporting, and real-time error notifications. Notably favored by QA professionals, it is a pivotal resource for meticulous error logging and comprehensive bug analysis.
Rollbar’s functionality is its utilization of workflow triggers strategically designed to notify users of known issues associated with a module before deployment. This proactive approach empowers developers to resolve these issues, ensuring a smoother release process.
Rollbar undeniably earns its reputation as one of the best debugging tools due to its extensive feature set, real-time error handling, and proactive bug management. It is an invaluable resource for developers and QA professionals seeking to enhance the quality and performance of their applications.
Here are some core features of Rollbar, one of the best debugging tools available:
- Bug Detection and Management: Rollbar covers the entire bug life cycle, from identification to resolution, making it an essential tool for debugging.
- Real-Time Alerts: Users can set up real-time alerts and notifications, ensuring that they are promptly informed about emerging issues, which expedites the debugging process.
- Integration with Workflows and Version Control: Rollbar seamlessly integrates with workflows and Version Control Systems (VCS), ensuring a smooth debugging workflow that fits into existing development processes.
- AI-Assisted Automated Error Responses: Rollbar can automatically respond to errors through AI-assisted workflows, streamlining the resolution of issues. It can also run stack traces for in-depth analysis.
- Built-In Triggers: The tool includes built-in triggers that can halt software deployments when suspected issues are detected, enhancing the reliability of software releases.
23. WebStorm
WebStorm is the best debugging tool tailored for JavaScript developers, offering a highly intelligent coding assistance platform. Its design is finely tuned to cater to the intricate demands of large-scale coding projects. Notably, WebStorm extends its support to web platforms, encompassing prominent frameworks like Angular, React, and Vue.js.
It is the typical choice for JavaScript developers needing one of the best debugging tools. Its feature-rich environment, seamless integration, and support for leading web frameworks make it an indispensable asset for tackling complex coding projects efficiently and precisely.
Here are some core features of WebStorm, one of the best debugging tools available:
- JavaScript-Centric: WebStorm is optimized for JavaScript development, providing developers with an environment that caters to the unique demands of JavaScript coding.
- Built-In Tools: It includes built-in tools for critical tasks such as debugging, testing, and application tracing, ensuring a comprehensive debugging solution.
- Spy-js: WebStorm features Spy-js, a built-in tool that simplifies tracing JavaScript code, providing developers with valuable insights into how their code behaves.
- Customization: It is highly customizable, allowing developers to tailor their coding and debugging experiences to suit their specific requirements.
- Versatility: It covers server-side (Node.js) and client-side applications, offering a one-stop solution for various JavaScript development needs.
- Integration with Command-Line Tools: WebStorm seamlessly integrates with popular command-line tools, speeding up the web development process and enhancing productivity.
24. Fusion Reactor
Reactor stands out as one of the best debugging tools, offering a comprehensive suite of features that make it an invaluable asset for developers seeking efficient bug hunting, performance optimization, and real-time issue resolution.
Fusion Reactor’s unique strengths lie in its ability to offer live debugging without disruptions and its specialized error pointing for Java and ColdFusion.
These features mentioned below make it one of the best debugging tools for developers working on complex applications and distributed systems, enabling efficient bug tracking, real-time issue resolution, and optimized performance.
- Performance Monitoring: Fusion Reactor provides real-time monitoring, allowing you to keep a constant watch on how your applications are performing. This is crucial for promptly addressing any performance-related issues.
- Profiling Tools: Developers can use profiling tools to gain in-depth insights into how their applications behave and identify performance bottlenecks. This helps optimize the use of resources efficiently.
- Live Debugging: Fusion Reactor offers live debugging, which means you can see how your code executes in real-time. This is especially useful for tracking and tracing logs without disrupting ongoing processes.
- Alert Integration: The tool integrates with multiple communication channels to send timely alerts about critical issues. This proactive approach ensures that developers can respond quickly when problems arise.
- Non-Blocking Breakpoints: Developers can set non-blocking breakpoints in the code, allowing for comprehensive stack trace reporting without interrupting server processes. This feature is particularly valuable in distributed systems and microservice architectures.
25. Lightrun
Real-time debugging is made possible by Lightrun’s minimal and non-intrusive method without the need for code recompilation. Developers may analyze variables, follow execution pathways, and instantly collect data while running apps. This seamless connection and prompt feedback enable developers to quickly find and repair errors, cutting down on debugging time and raising the caliber of the software.
Here are some core features of Lightrun, making it one of the best debugging tools available:
- Code-Fast Debugging: Lightrun enables developers to debug their code in real-time, eliminating the need to recompile, which can slow down the debugging process.
- Seamless Integration: It seamlessly integrates into existing workflows without causing any performance issues in the application, ensuring a smooth debugging experience.
- Immediate Feedback: Developers receive immediate feedback on their code, allowing them to identify and address issues quickly, ultimately improving the overall quality of their software.
- Versatile Compatibility: Lightrun supports various environments, making it versatile and suitable for debugging in different setups and scenarios.
Bonus Tool
LT Browser by LambdaTest is yet another tool to test and debug mobile websites. The latest LT Browser lets you enhance debugging with multiple dev tool options. This next-gen browser for developers allows you to test your website responsiveness on over 50+ device viewports and helps you take your responsive testing to the next level.
Choosing the Right Debugging Tool
Choosing the right debugging tool depends on several factors, including the programming language, the type of application or system you’re working on, and your specific debugging needs. Here are some considerations to help you choose the appropriate debugging tool:
- Integrated Development Environments (IDEs): Popular IDEs like Visual Studio, IntelliJ IDEA, Xcode, and PyCharm provide built-in debugging capabilities for convenient debugging.
- Command-line Debuggers: gdb, pdb, and lldb offer lightweight debugging options for C/C++, Python, and macOS/iOS development.
- Language-Specific Debuggers: Chrome DevTools, Pry, and other language-specific debuggers enhance debugging for JavaScript and Ruby applications.
- Remote Debugging Tools: Visual Studio Code’s Remote Development, PyCharm’s Remote Debugging, and Eclipse’s Remote Debugging enable remote debugging in distributed environments.
- Logging and Tracing Tools: ELK Stack, Splunk, and Jaeger assist in collecting and analyzing logs and traces for effective debugging.
- Error Monitoring and Crash Reporting Tools: Sentry, Bugsnag, and Crashlytics capture error reports and diagnostic information for debugging in production systems.
Conclusion
Access to reliable and efficient debugging tools is vital for developers and software teams to identify, diagnose, and resolve application issues effectively. From IDEs, command-line debuggers, and language-specific debuggers to remote debugging, logging, tracing tools, and error monitoring platforms, diverse options cater to specific needs and preferences.
LambdaTest is a good option for developers, offering a comprehensive cloud platform with robust debugging capabilities. Developers can seamlessly debug web applications across various browsers and operating systems, ensuring consistent functionality and user experience. The platform provides real-time interactive testing, detailed debugging logs, and seamless integration with popular developer tools, enabling efficient issue resolution.
Using the right debugging tools, developers can accelerate their debugging process, optimize software development, and deliver high-quality applications to end users. It is crucial to select debugging tools that align with specific requirements and workflows to maximize productivity and ensure smooth software operation. Consider the strengths and features of the different tools suggested above for 2024.
Frequently Asked Questions (FAQs)
What is the best browser debugger?
Google Chrome is the first pick for any user because it is the most popular web browser. The browser comes with the best debugging tools called Chrome DevTools. With the support of these tools, you can quickly and efficiently edit pages and troubleshoot issues, facilitating the development and deployment of better websites.
Why use debugging tools?
Using debugging tools and techniques speeds up solving problems and increases developer output. As a result, the software’s quality and the end-user experience are enhanced.
What is a debugging security tool?
A debugger is a tool that enables you to inspect the running code of an application. The execution of the program can be stopped, variable values can be examined, the program can be run line by line, breakpoints can be set on particular lines to stop the execution, and more.
What are the two benefits of debugging?
Early bug detection allows developers to work faster. Long-term savings are achieved through the detection and rectification of flaws. Debugging aids in enhancing the software’s code quality. These are a few advantages of debugging.


Author’s Profile
Mythili Raju
Mythili R works as a content writer and digital marketing executive at LambdaTest. Having been previously trained in Content and Social Media Marketing, she loves delving into the latest tech trends and sharing her insights.
Blogs: 20
Got Questions? Drop them on LambdaTest Community. Visit now


