
How to Inspect Elements on Mac?
Saniya Gazala
Posted On: October 26, 2023
![]() 68124 Views
68124 Views
![]() 17 Min Read
17 Min Read
Inspecting elements on Mac plays a crucial role for developers and testers, as they identify errors and help debug the issue. It’s all about learning the correct method to use the feature to make the most out of it. A developer must know how to inspect the tool usage.
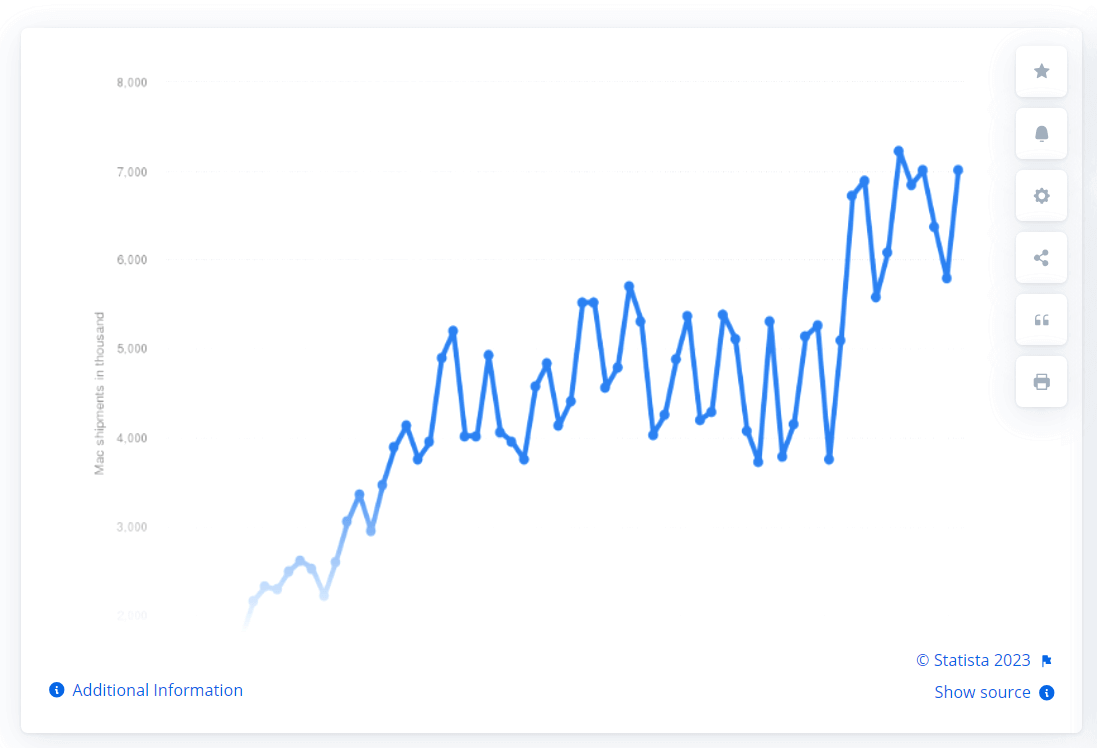
As per Statista, Apple’s Mac operating system has gained a significant market share over the years, occupying a fifth of the market. Another survey shows an increased shipment of Mac computers in the fourth quarter of 2022, reaching seven million units worldwide (around 1.5 thousand more than in the previous quarter).
That is why it becomes imperative to test or debug your websites on Mac.
In this tutorial, I will guide you through how to inspect elements on Mac, not only by using Safari but also using Chrome and Firefox browsers. We will also learn shortcut keys to make the traditional navigation process easy. Further, we will discover some third-party tools for Mac, which can help developers and software testers debug websites and web pages more effectively.
By the end of this tutorial, you will be able to learn and understand why inspecting elements play a significant role in every software tester and developer’s life.
So, let’s get started!
TABLE OF CONTENTS
What is element inspection?
Inspecting elements is a process vital for every developer and software tester. This enables testers and developers to view and edit a webpage or a website. Giving a complete insight into the website’s source code, including HTML, CSS, and sometimes JavaScript, helps marketers and testers understand how the website is built and structured.
It can help testers mainly when automating their test script by getting an ID, CSS Selector, and navigating via XPath to identify the exact element so that it can be automated.
Using element inspection on popular browsers like Chrome and Firefox can be pretty simple, but inspecting elements on Mac can be quite tricky. However, with the inspect element on the Mac feature, developers gain a powerful tool that simplifies the process of debugging by adding or editing a new HTML and CSS element.
How to enable element inspector on Mac Safari?
Inspecting elements on browsers like Chrome and Firefox, which are supported on the Windows platform, can be pretty straightforward. But to inspect elements on Mac, the navigation to perform an inspect element differs as it requires enabling the developer mode.
To enable the Developer mode on Mac, follow the steps below.
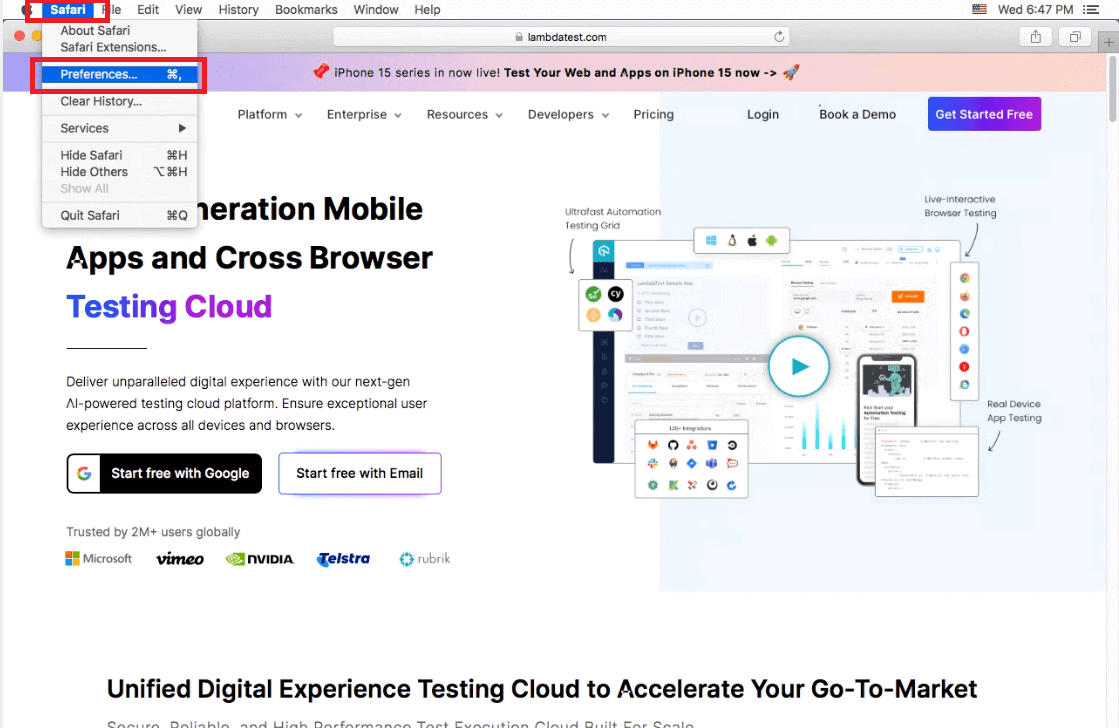
- Launch the browser that Mac supports, which is Safari.
- You need developer access to enable the inspect feature on Mac. To do so, Open the Safari browser, click on Safari from the menu, and then select Preferences (Safari> Preferences…)
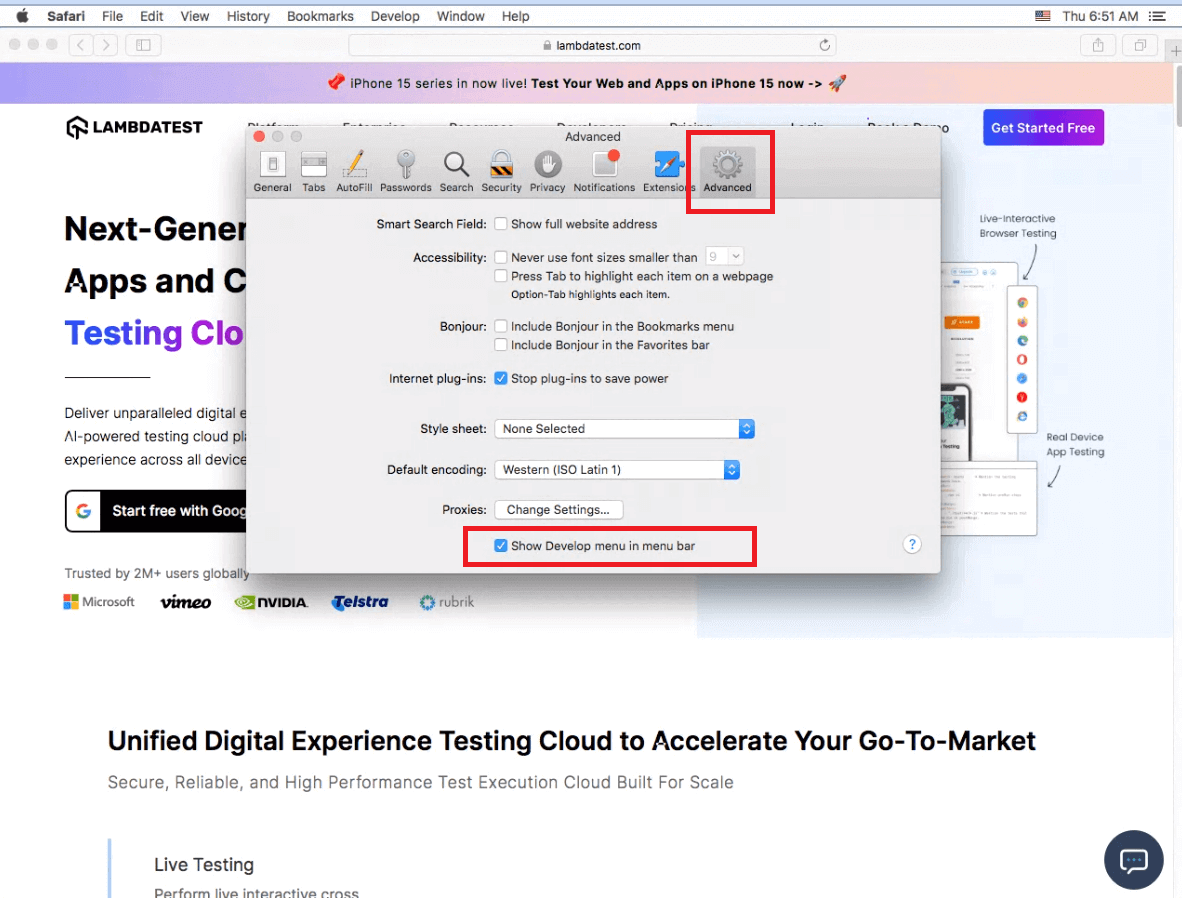
- Once you click on Preferences, a window will appear. Click on the Advanced tab from the header option, then check the “Show Develop menu in menu bar” option. This will enable the Developer mode.
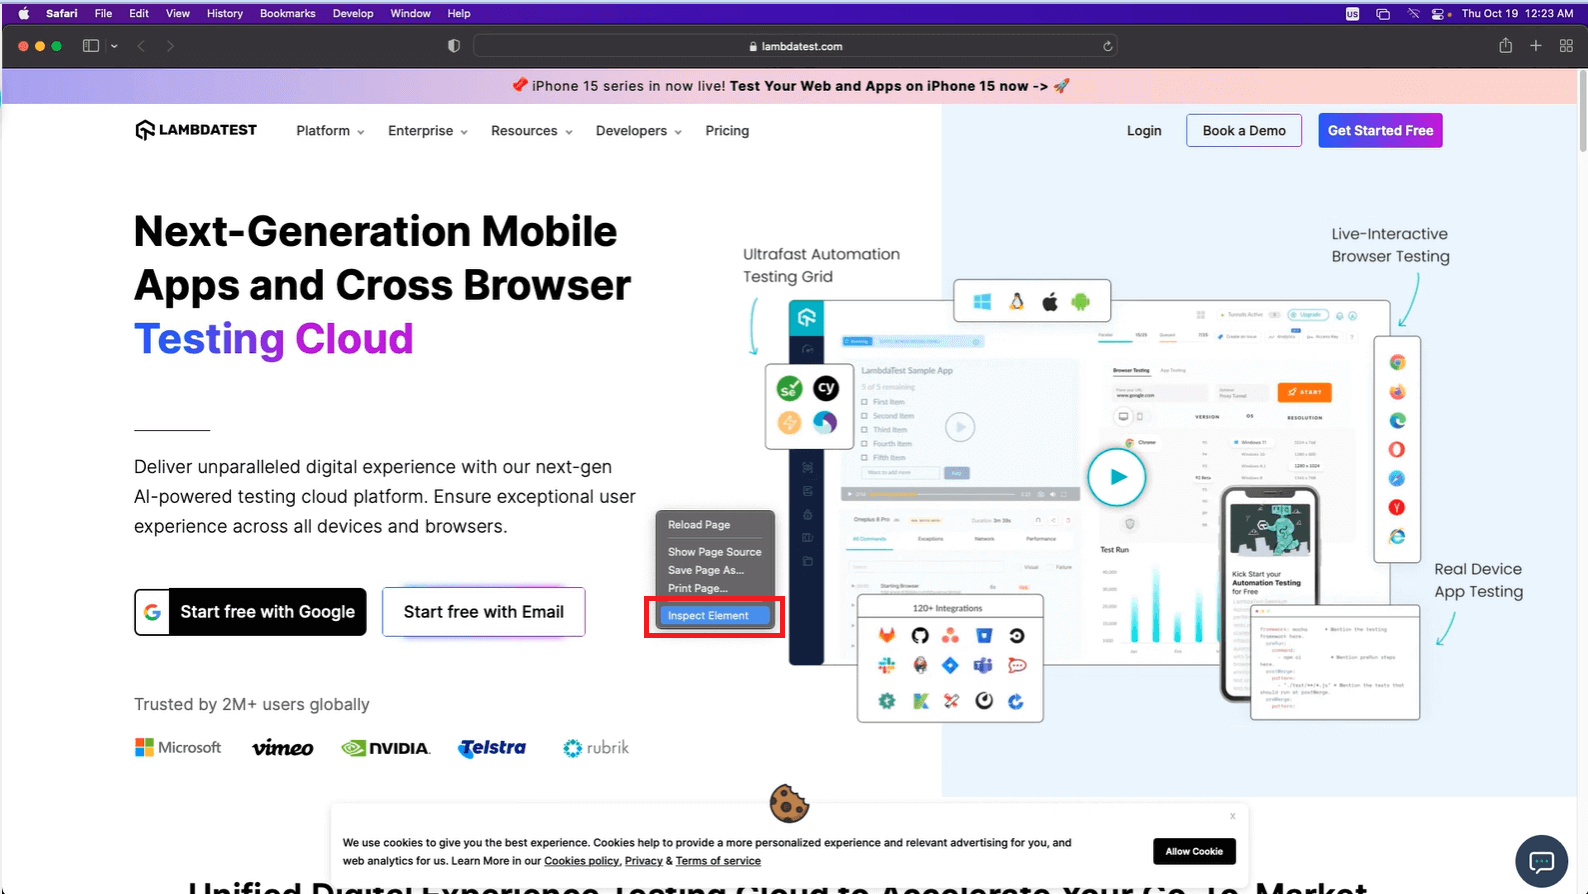
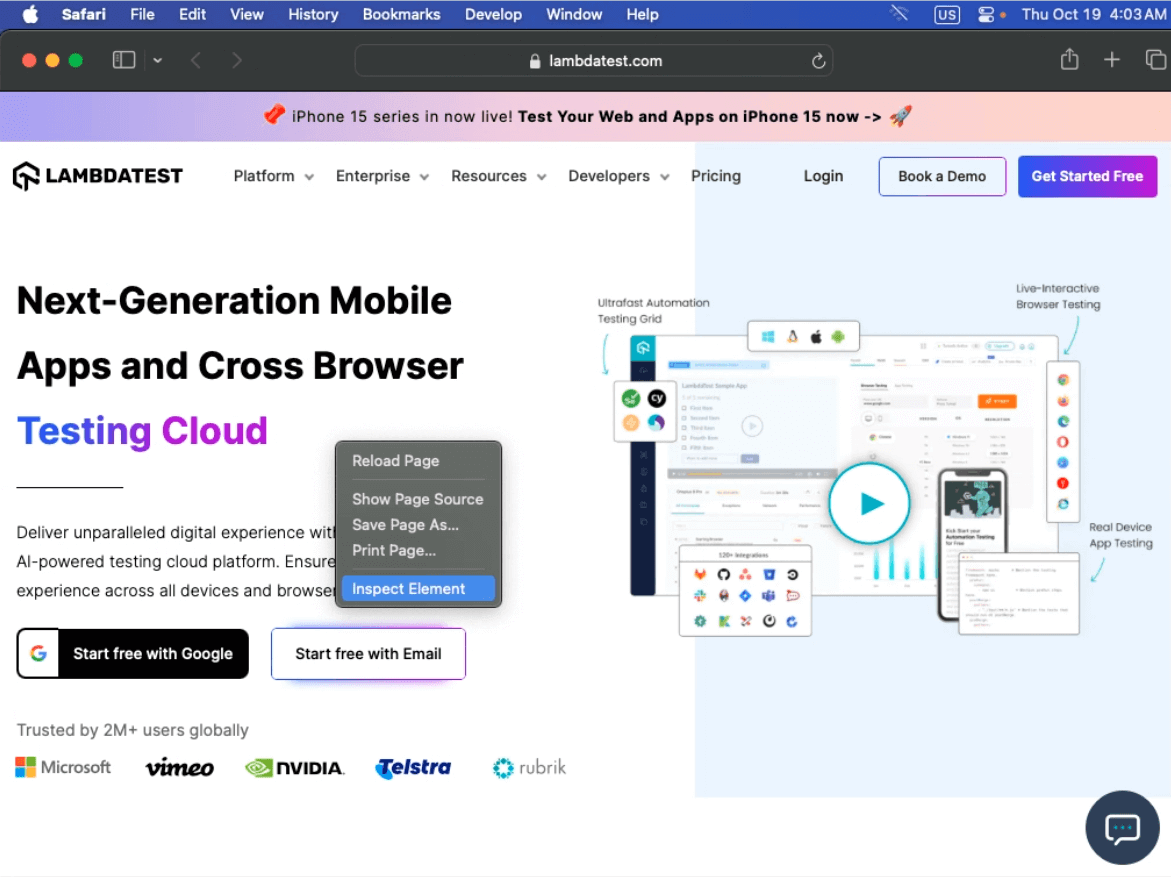
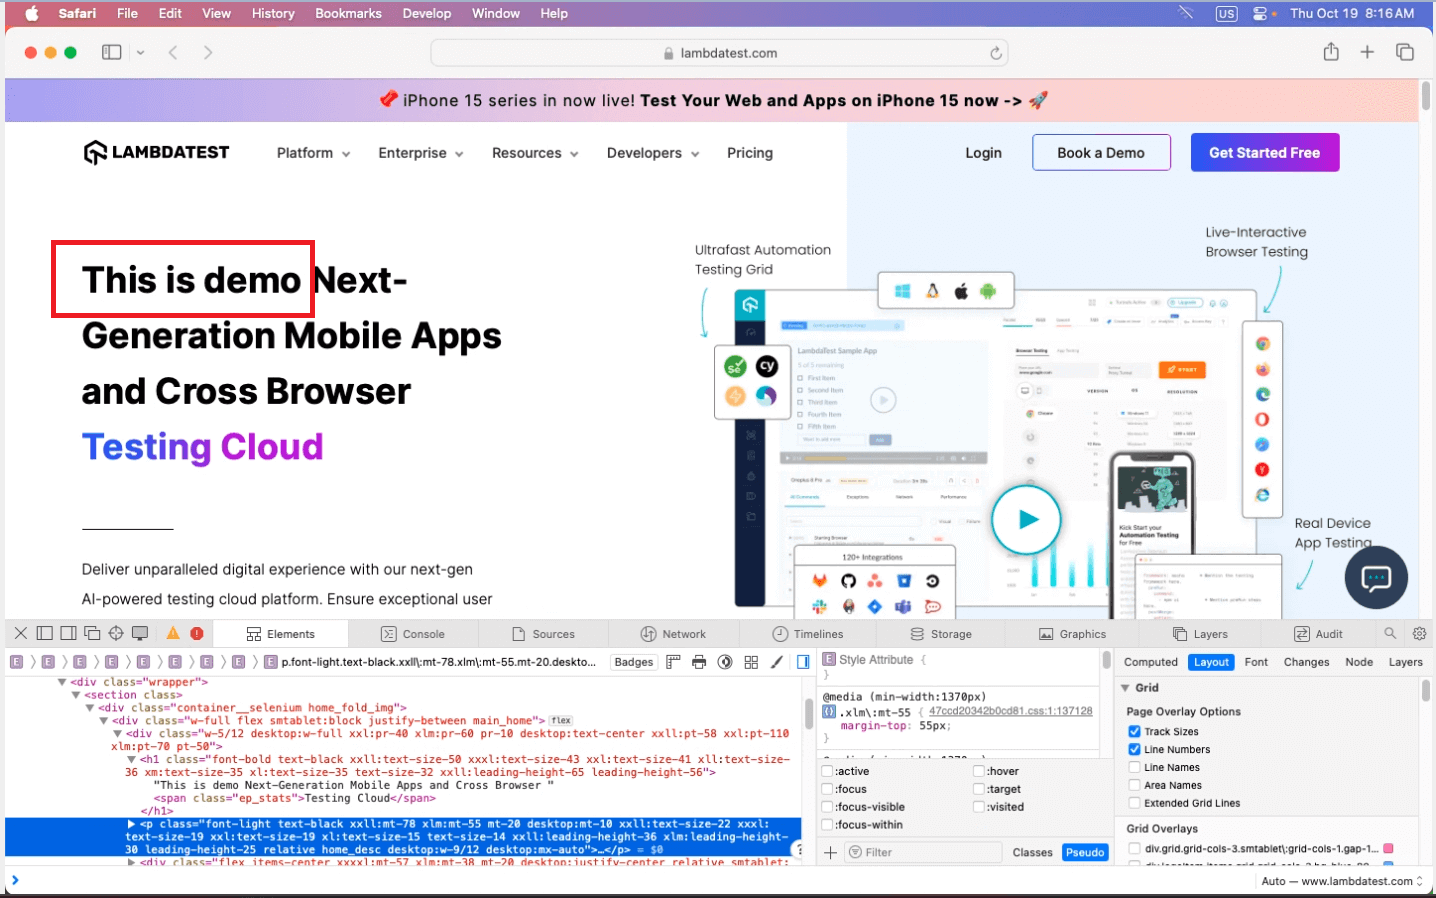
- Visit any website that you want to inspect. (In this case, I have launched the LambdaTest website. You can launch any site of your choice).
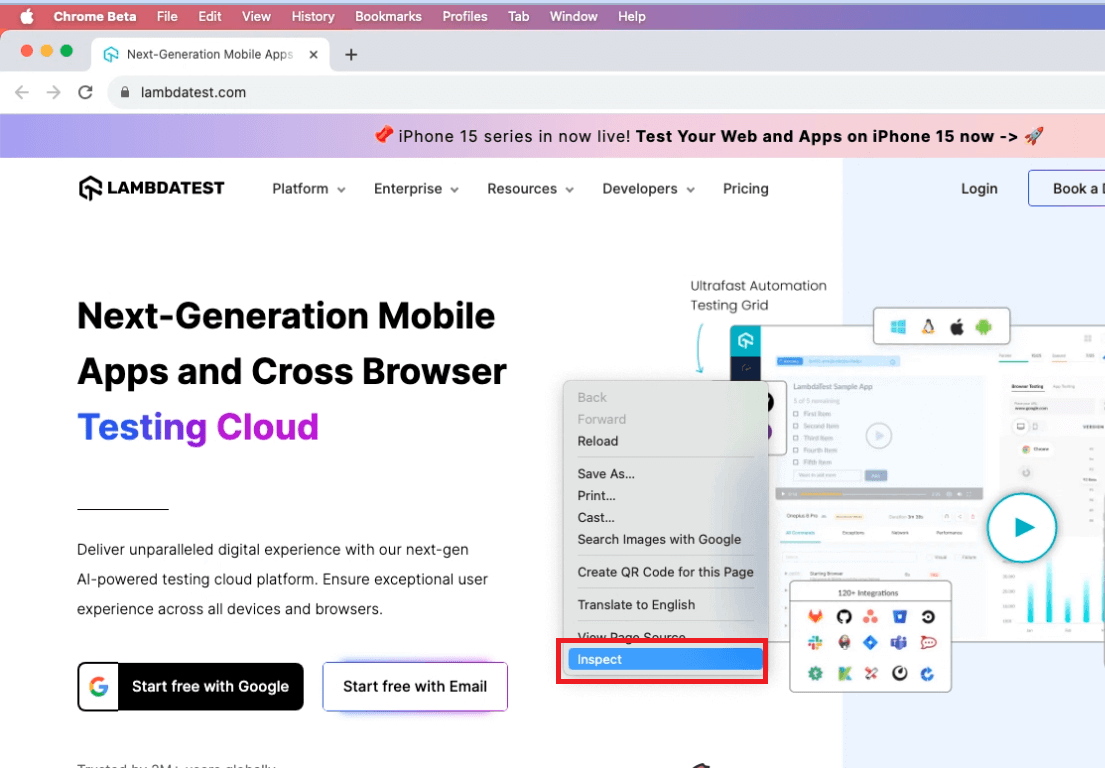
- On the website screen, right-click and select Inspect Element.
Note: Once you have enabled the developer mode, you no longer need to inspect a website by following the traditional approach. You can use the shortcut keys to inspect any desired website on Mac. All you need to do is follow this command: Option+Command+C.
 Note
NoteOptimize your website testing on Mac by accessing over 3000 real devices and browsers. Try LambdaTest Today!
How to inspect elements on Mac in popular browsers?
In the following section, we’ll explore the various methods you can use on a Mac to inspect elements in popular browsers like Chrome and Firefox.
Inspect elements on Mac using Chrome
Inspecting elements on Mac via Chrome can be pretty straightforward. As mentioned earlier, navigating through the inspection would be the same. Let’s discuss the three different ways to inspect elements on Mac using Chrome.
Using the Inspect option
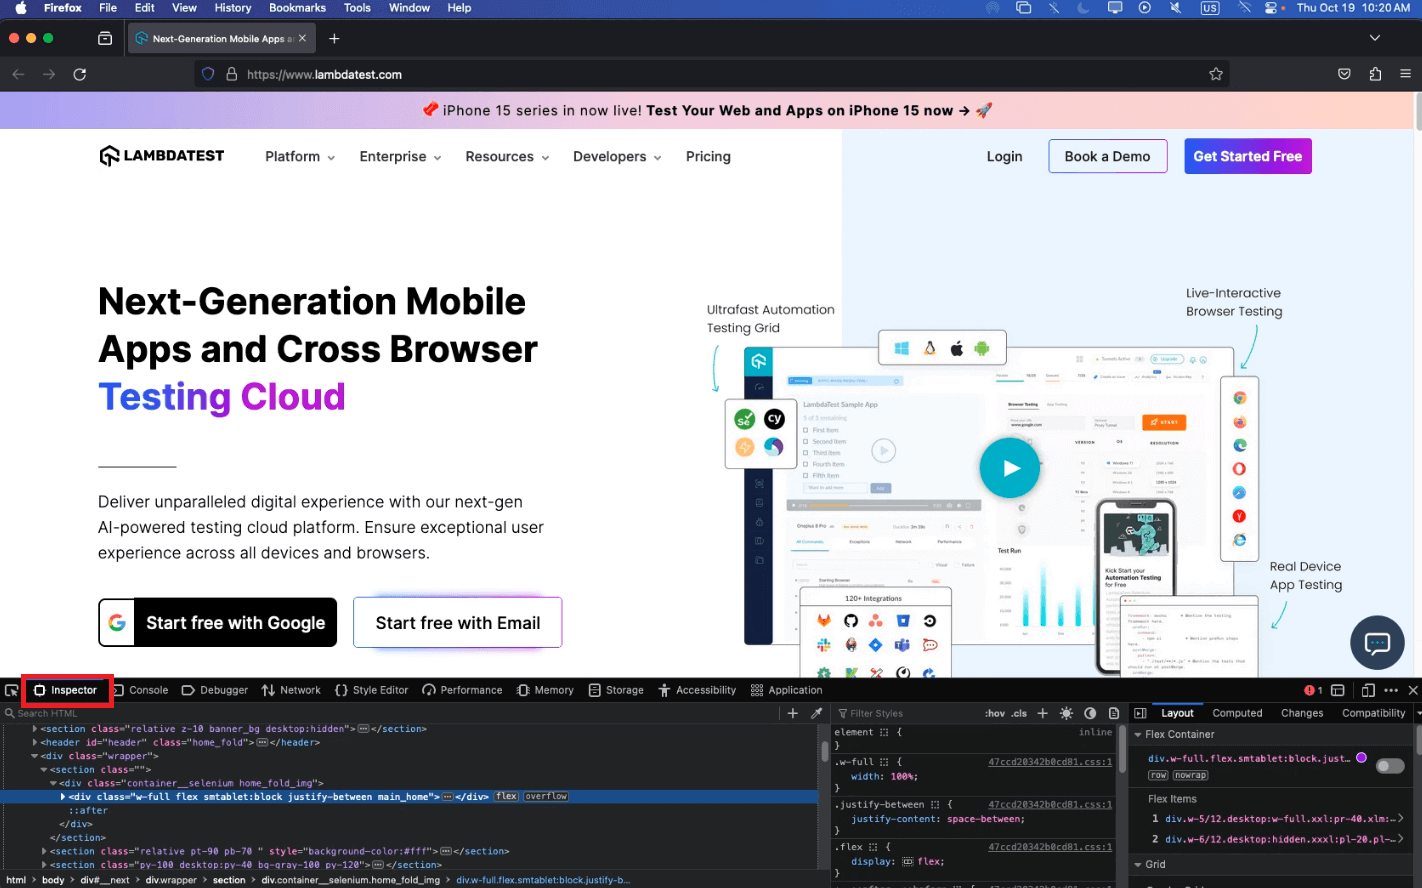
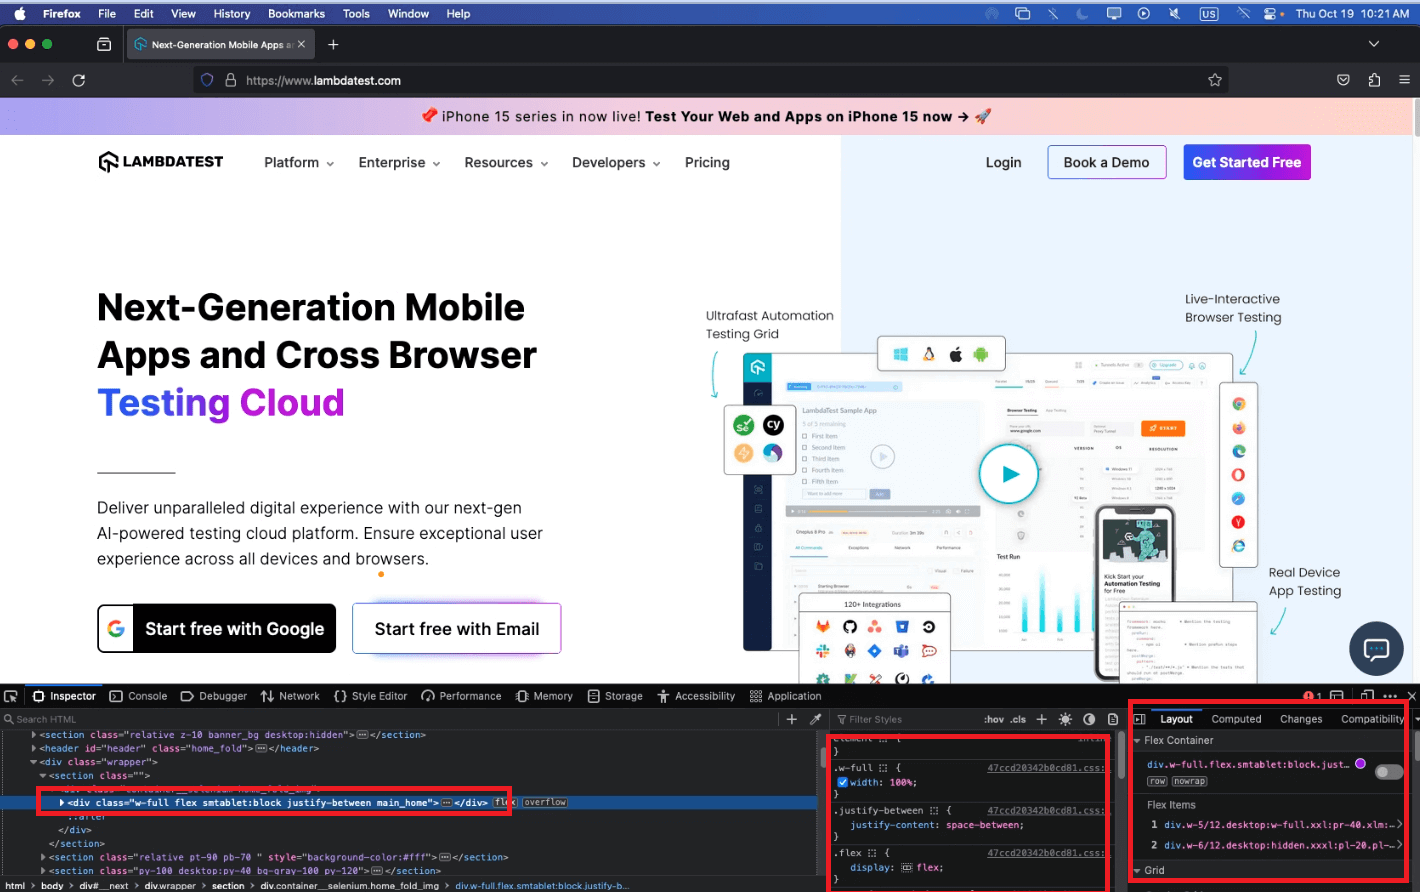
- On Mac, open Chrome browser and visit a website where you want to inspect.
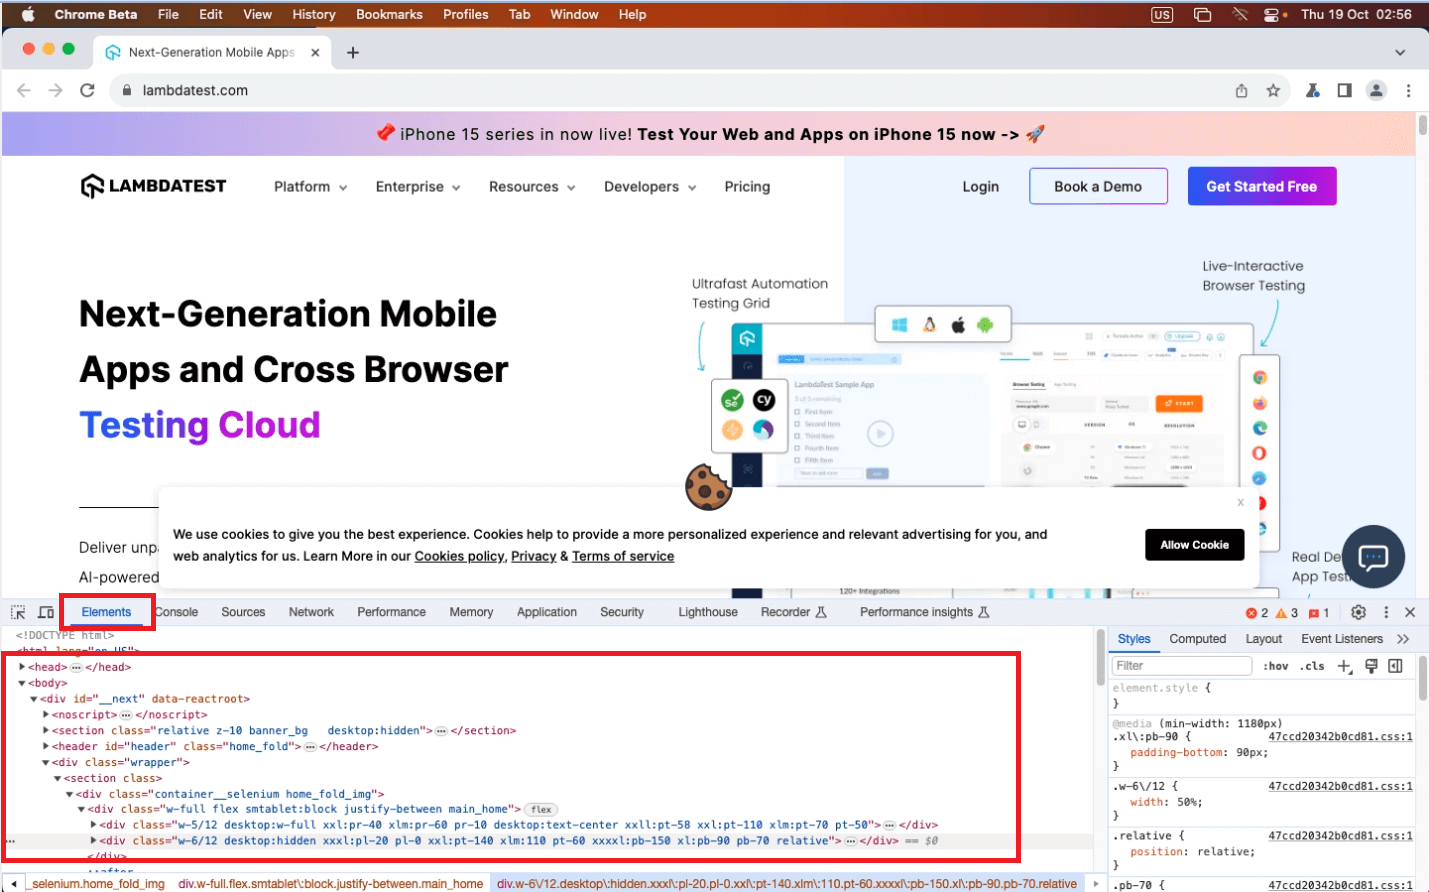
- Right-click on the website page and select Inspect from the option.
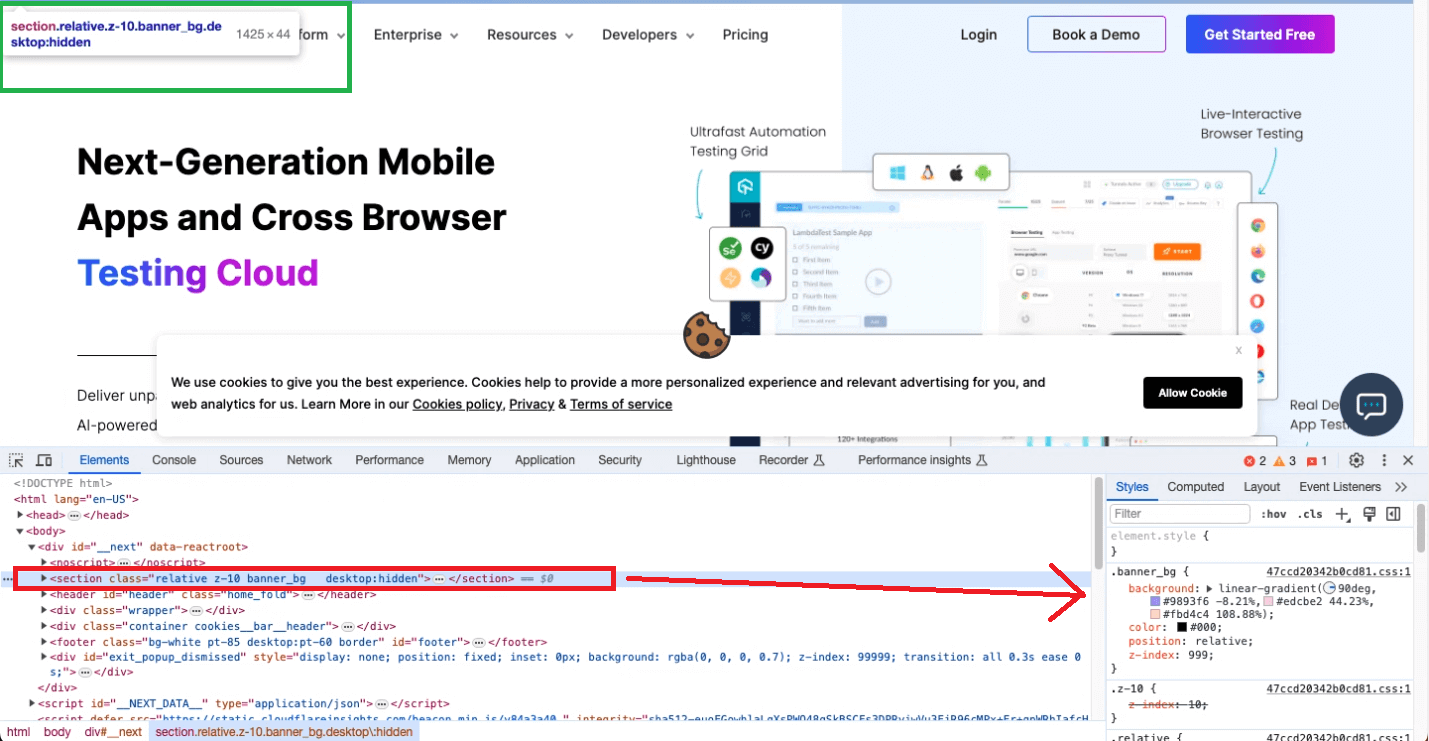
- A developer panel will appear that displays the entire HTML Structure of the site. You can find the website’s HTML structure by clicking the Elements tab.
- On the right side of the developer panel, you can see the CSS for each HTML element you click on.
Using Developer Tools
The other way to open the Developer panel is by using the Developer Tools on the Chrome browser. To do so, follow the specific steps.
- Visit your desired website.
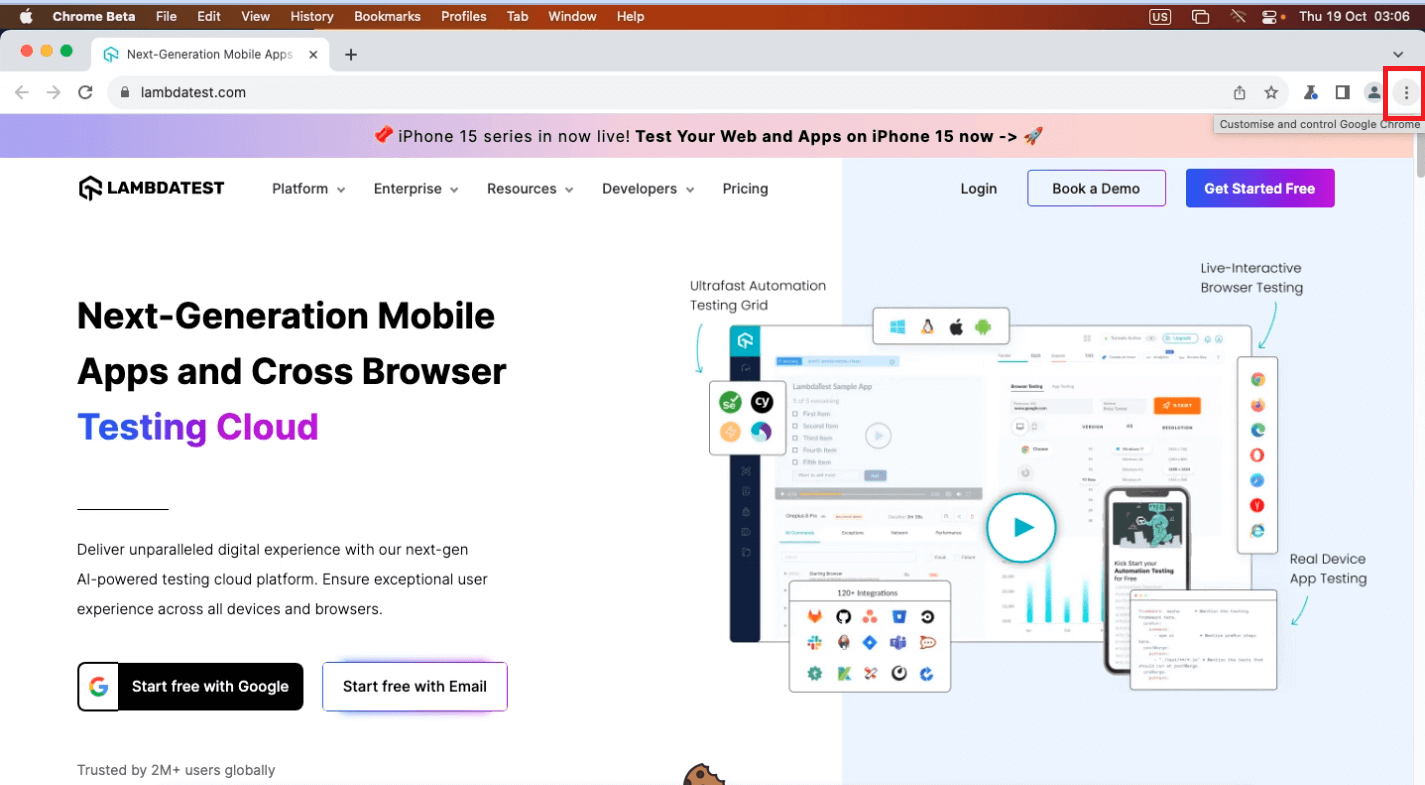
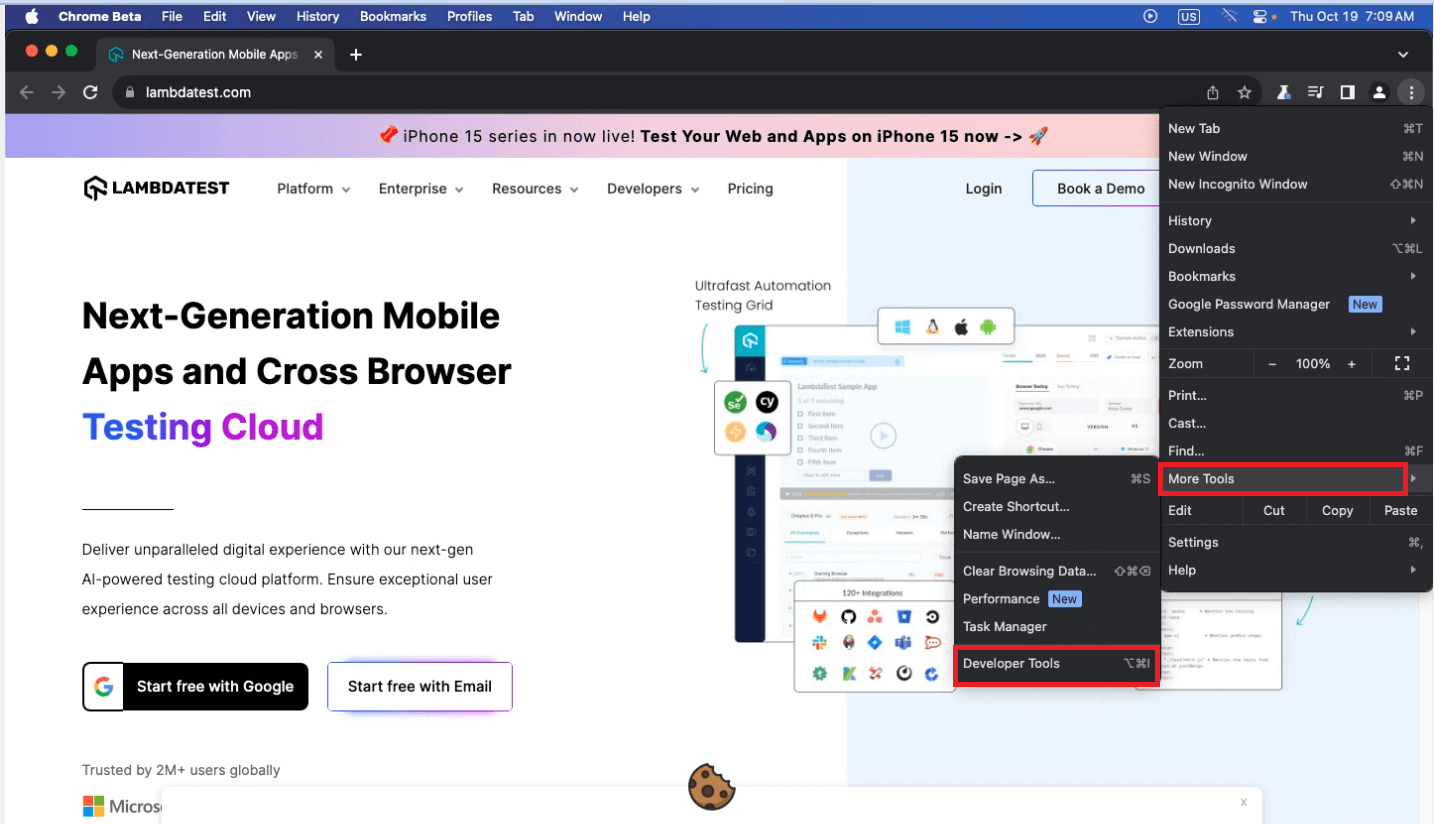
- Click on the Three dots from the top menu.
- Then, choose More Tools > Developer Tools.
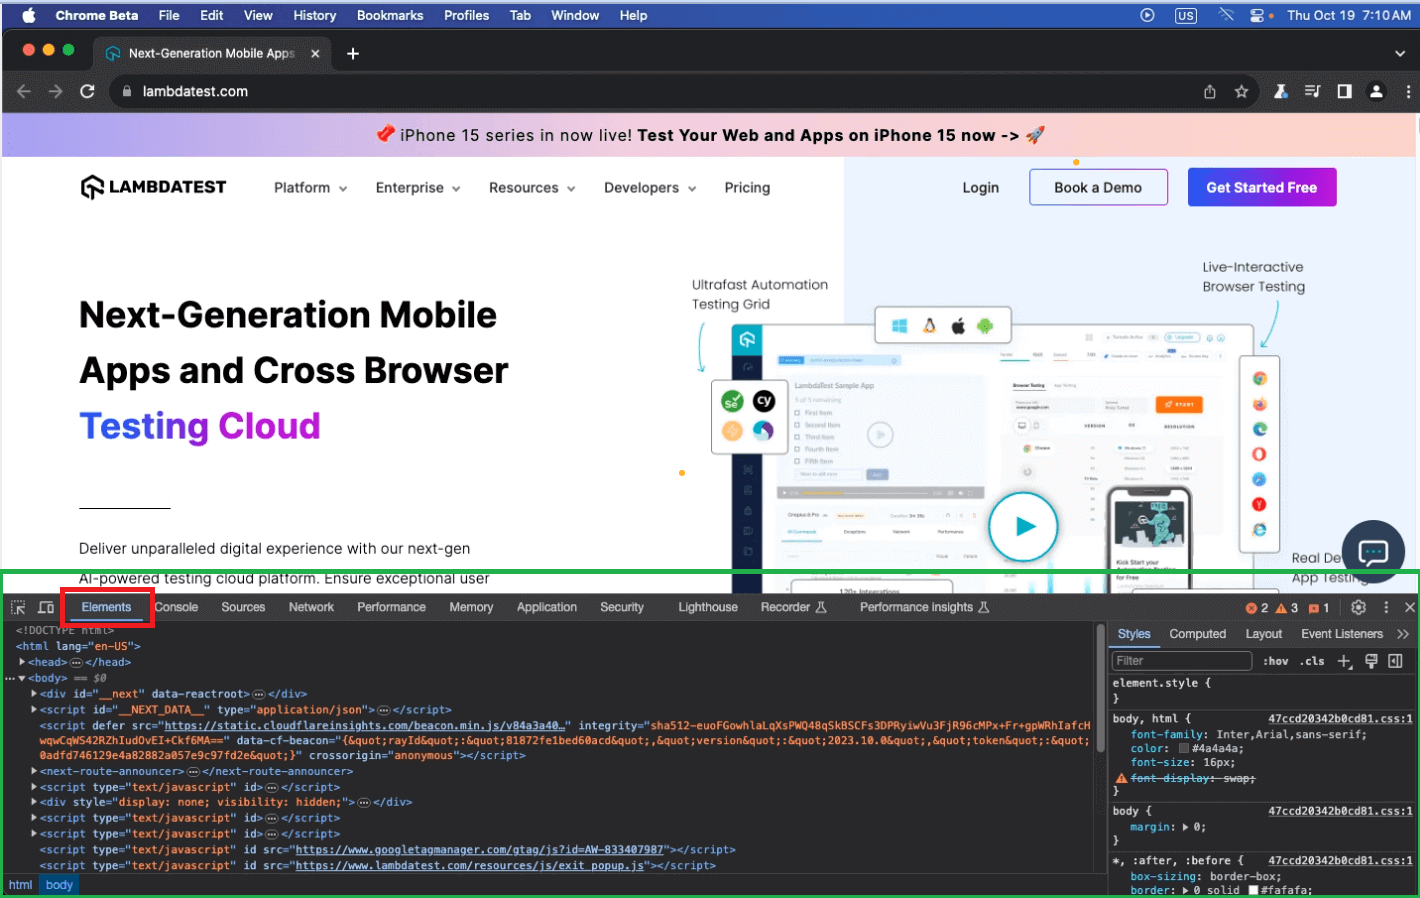
- A developer panel will appear that displays the entire HTML Structure of the site.
You can also find other tabs like Elements, Console, Source, Network, and more. Each of these tabs plays a particular role for developers, but the Elements tab is all you need to understand.
Using keyboard shortcuts
You can navigate to the inspect element without visiting the desired site by right-clicking on the website screen and clicking the Inspect option. You can use the shortcut key on Mac, Option+Command+I, to save time.
Inspect elements on Mac using Firefox
Inspecting elements on Mac via Firefox is quite similar to inspecting elements on Chrome. Let’s discuss the three different ways to inspect elements on a Mac using Firefox.
Using the Inspect option
- On Mac, open the Firefox browser and visit a website you want to inspect.
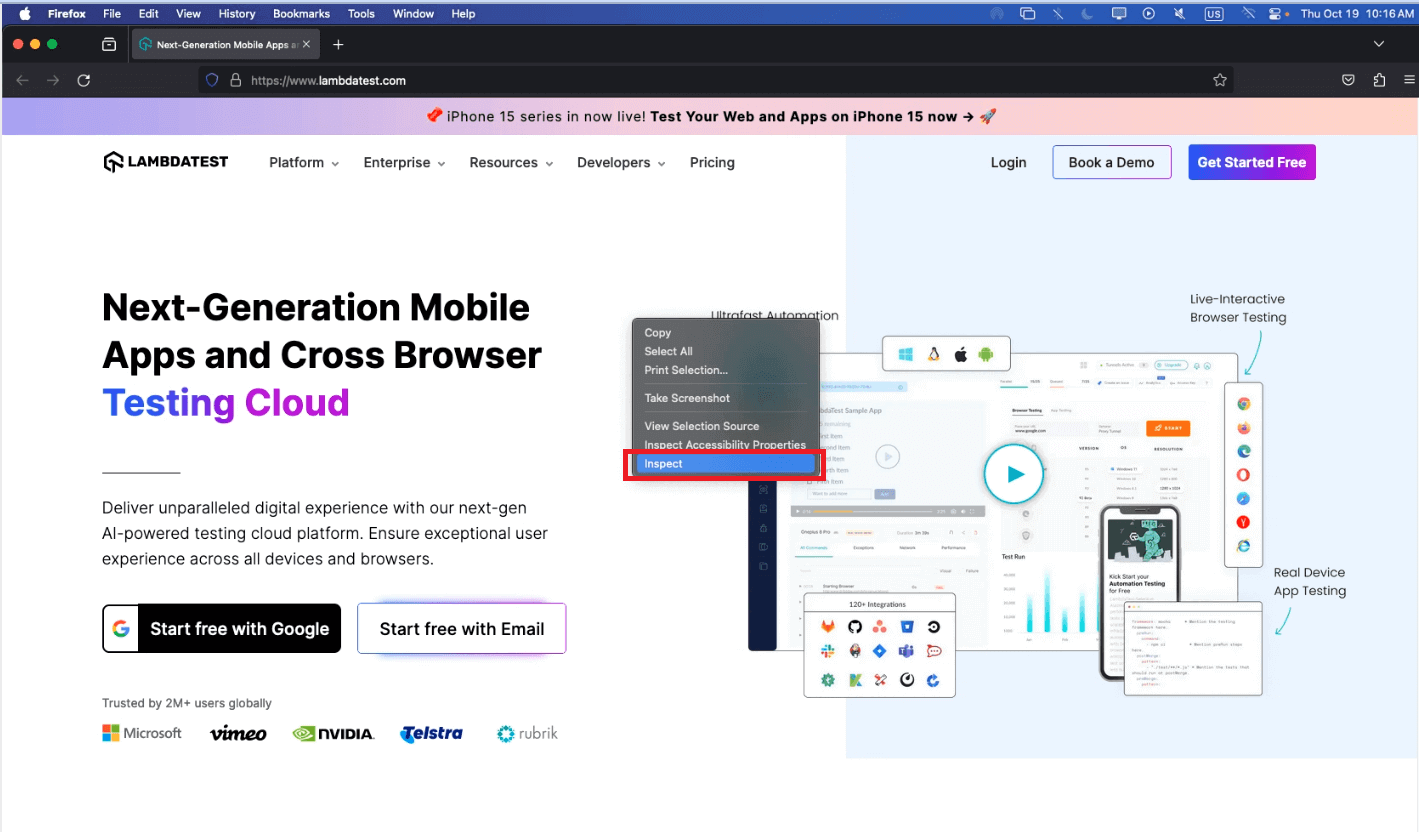
- Right-click on the website page and select Inspect from the options.
- A developer panel will appear that displays the entire HTML Structure of the site. You can find the Website’s HTML structure by clicking the Inspector tab.
- On the right side of the Developer panel, you can see the CSS for each HTML element you click on.
Using Web Developer Tools
The other way to open the Developer panel is by using the Developer mode on the Firefox browser. To do so, follow the specific steps.
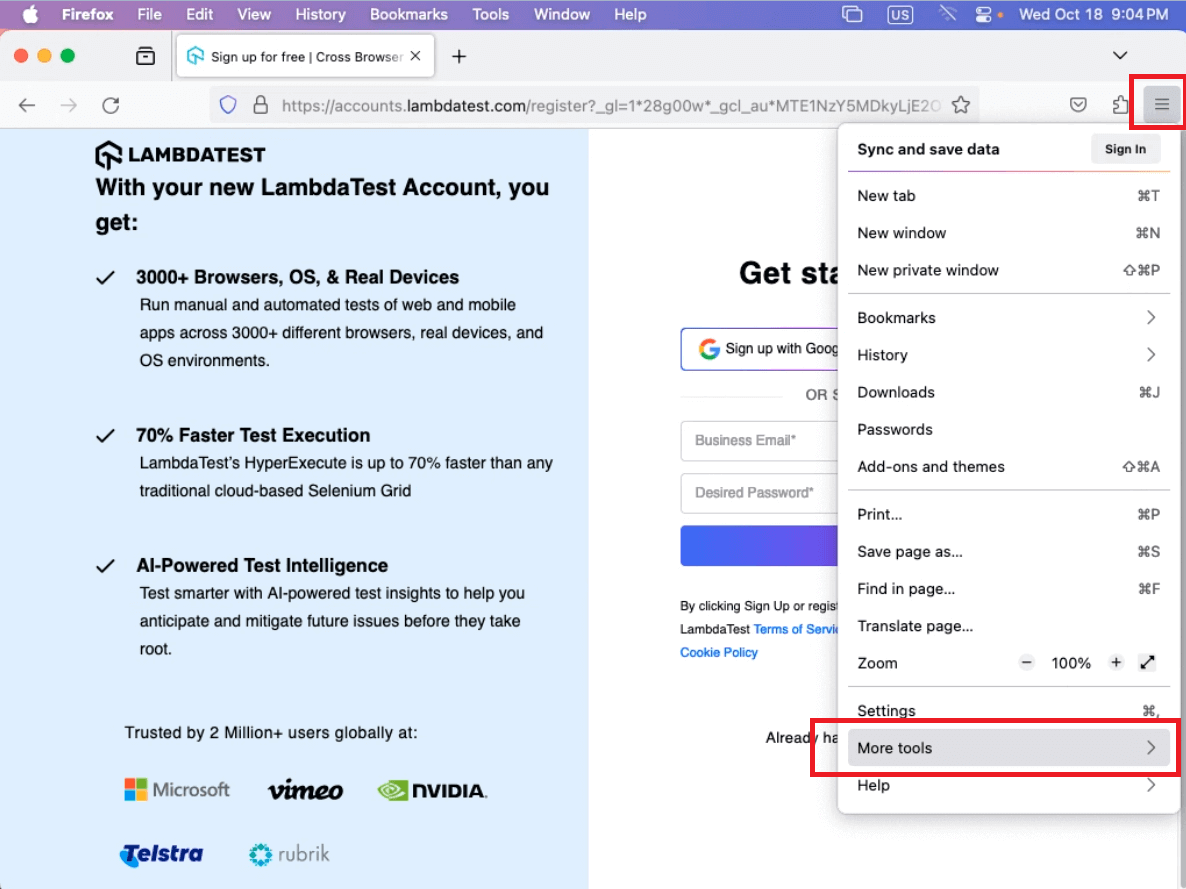
- Visit your desired website.
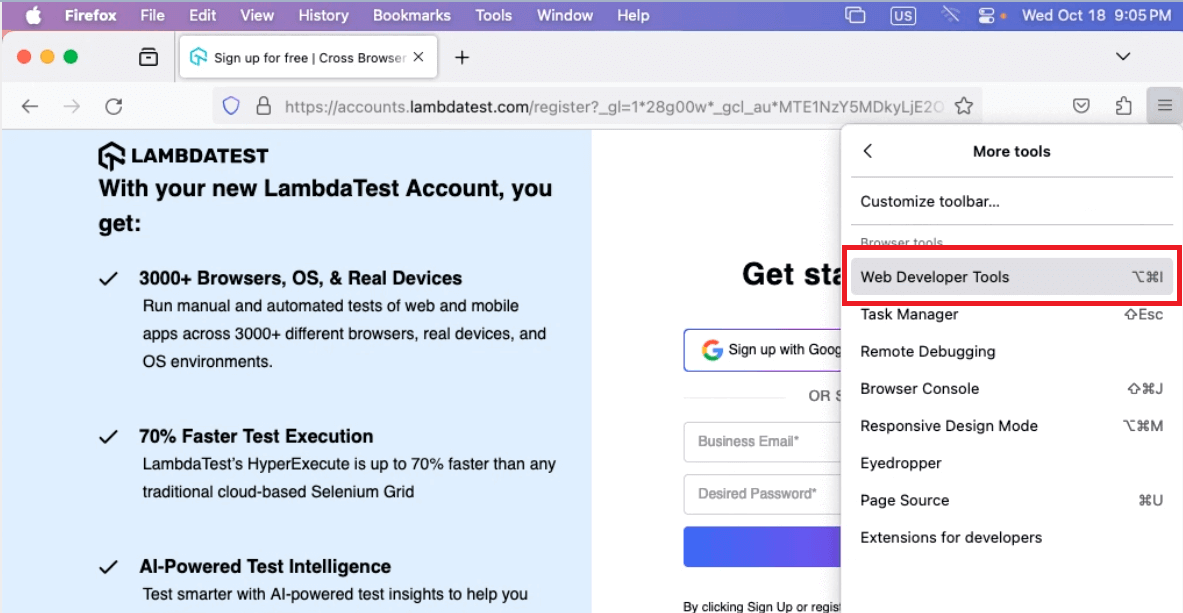
- Click on the hamburger menu (the three horizontal lines at the top-right corner of the window), and select More tools.
- Then another panel appears, and select Web Developer Tools.
This will open the Developer panel, where you can find HTML presenting the website structure and CSS that provides styling for the website.
Using keyboard shortcuts
You can navigate to the inspect element on any website without the traditional approach. To save time, you can use the shortcut key on Mac, Option+Command+C.
How to inspect and modify an HTML element on a Mac?
Now that we have learned how to navigate and enable the Inspect option over the mentioned browsers, let’s see what operations we can perform after the Developer panel appears.
The operations performed on the Developer panel area will remain the same for all the browsers: Chrome, Safari, and Firefox.
In this section, we will learn basic operations like selecting a specific tag, editing an HTML element, and copying the HTML element using Safari.
Modifying an HTML element using Safari
- The first thing is to open the desired website on Safari.
- Enable the option to inspect elements in any given way.
- In this case, I will use the traditional way: right-click on the webpage and click the Inspect Element option.
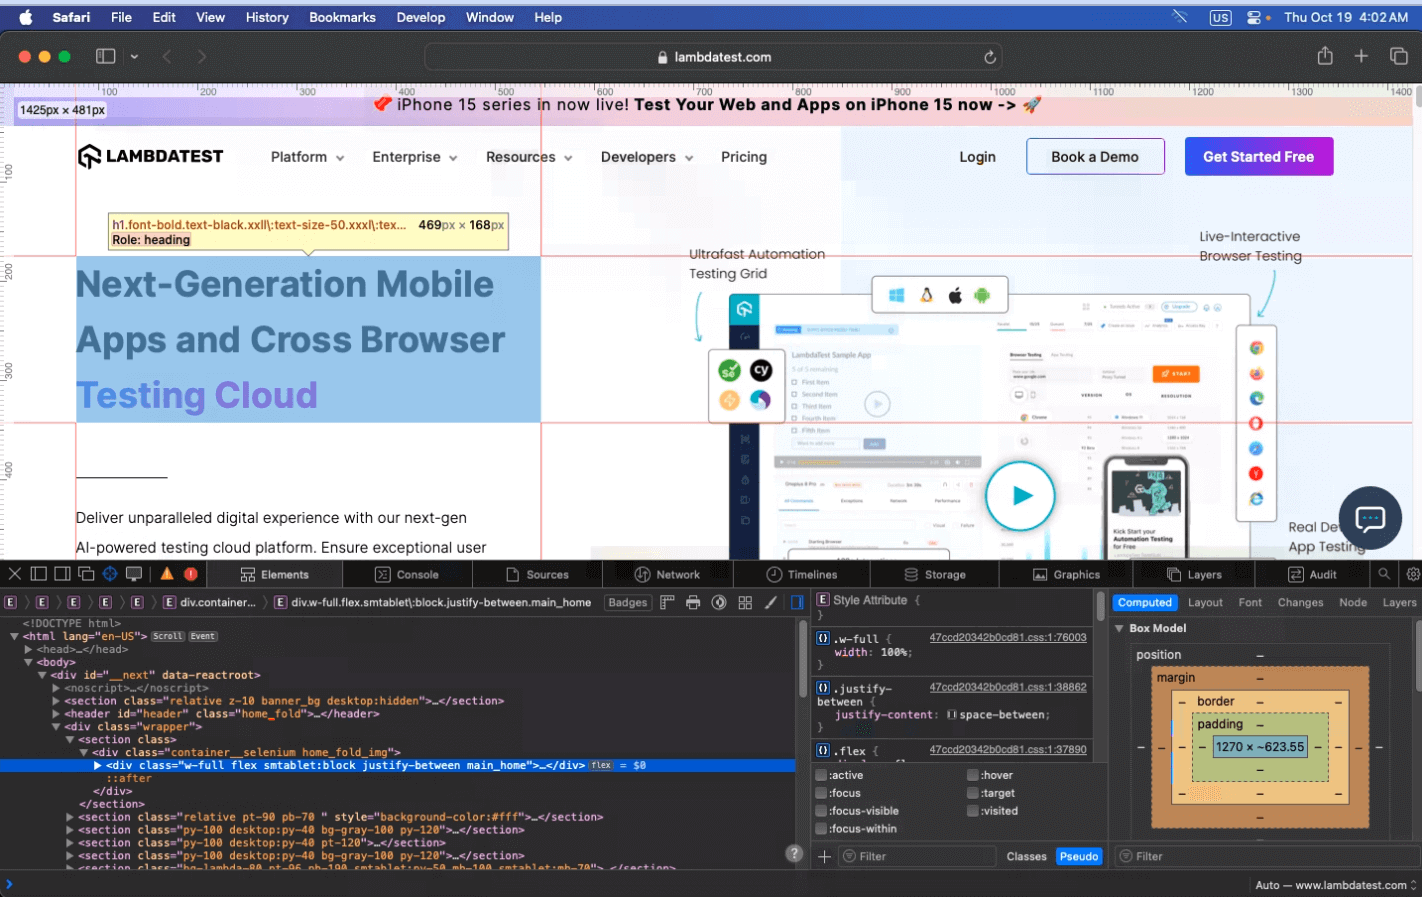
- Select the element you would want to inspect.
- You can click on any UI element on your website that you want to inspect and see the HTML tag highlighted in the developer panel.
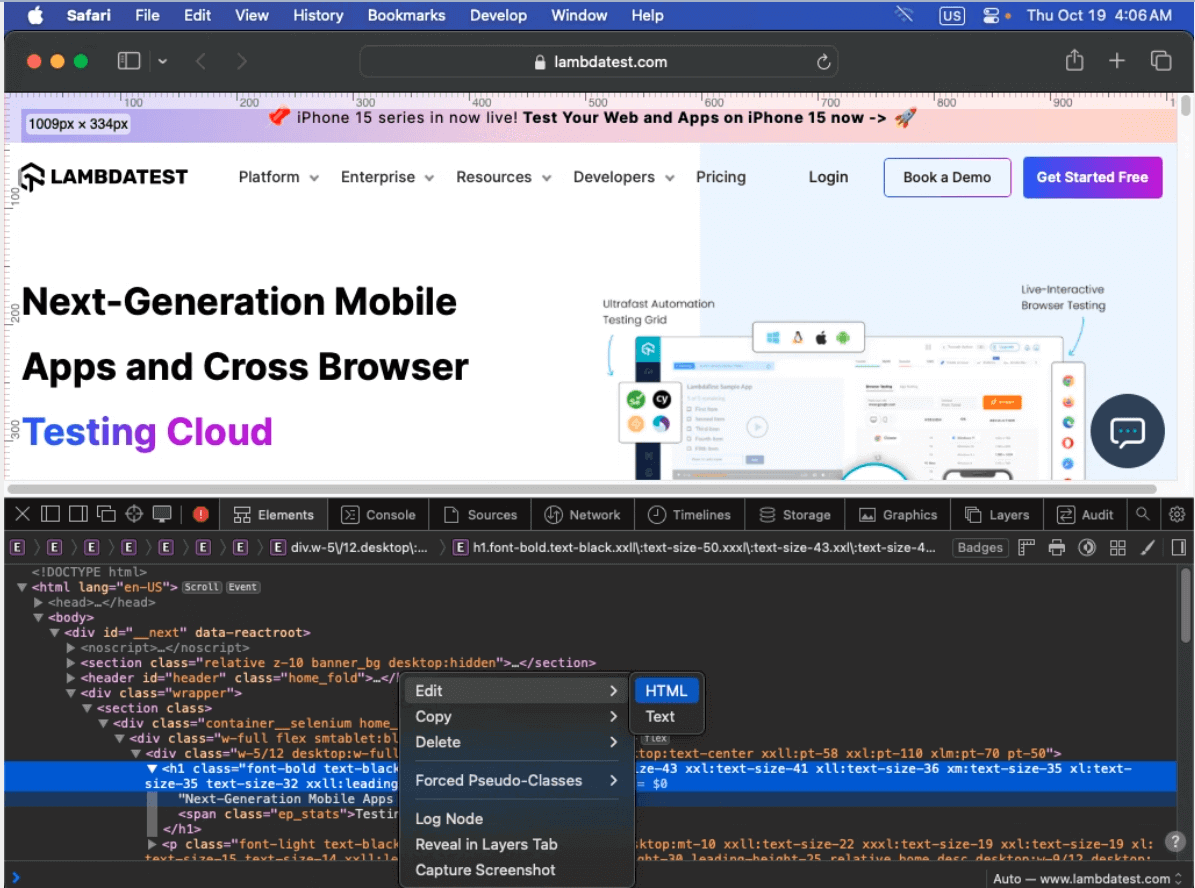
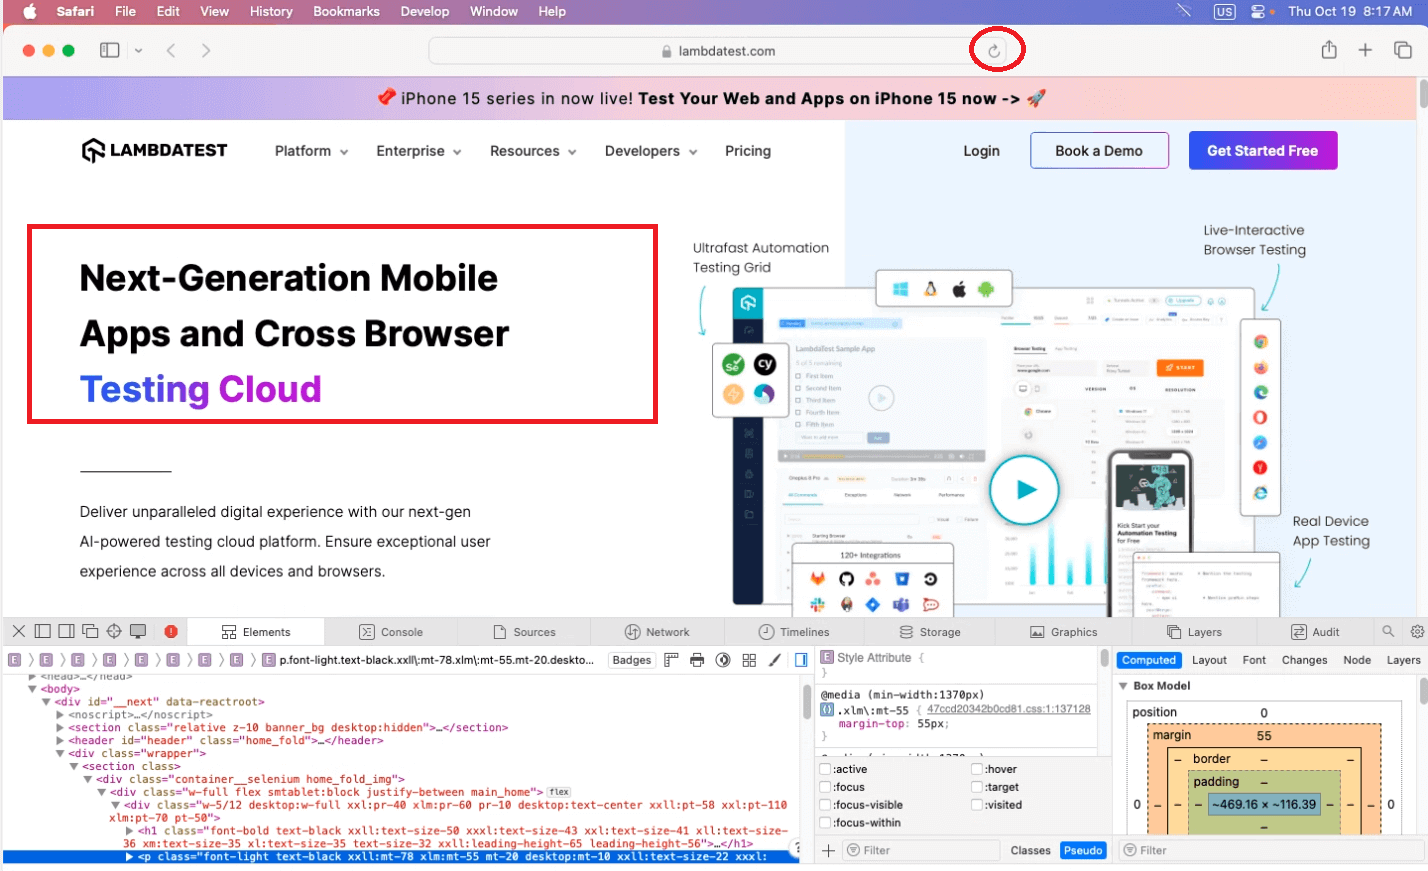
- To edit the same, right-click the HTML element highlighted in the Developer panel and select Edit >HTML.
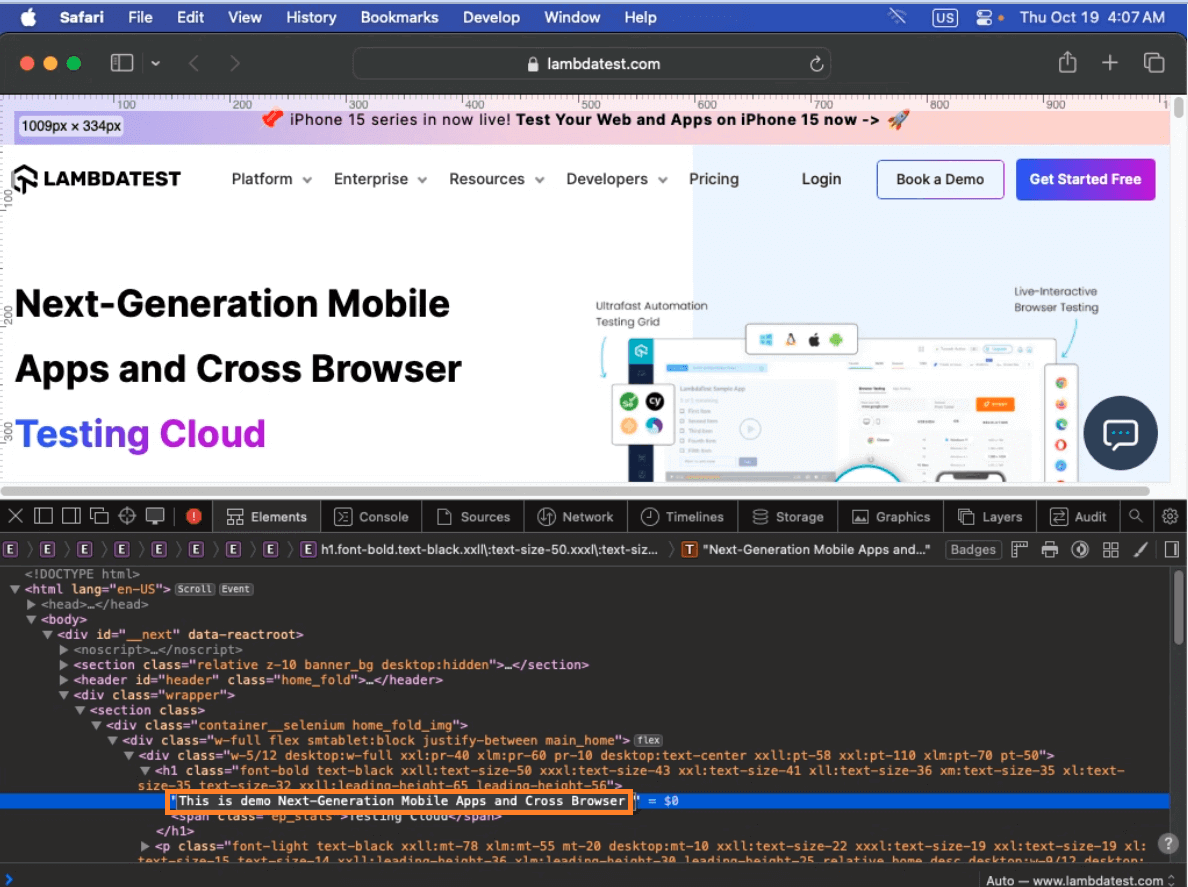
- You can edit the text in the highlighted HTML tag.
- To apply your changes, all you have to do is hit Enter. Now you can see the added changes to the H2 tag appear on the screen.
- As these operations are temporary, they will be back to normal if you refresh your site.
You can add any tags or text to see what fits right for your site and then implement the same by writing in your code.
Copying HTML elements using Safari
Copying HTML can be helpful as we can visually see the changes in the UI of the website. This can make developers work to identify and replicate the same while designing and structuring the website.
In this section, we will see how you can use an inspection to help you select and copy an HTML tag and get a visual representation of the site.
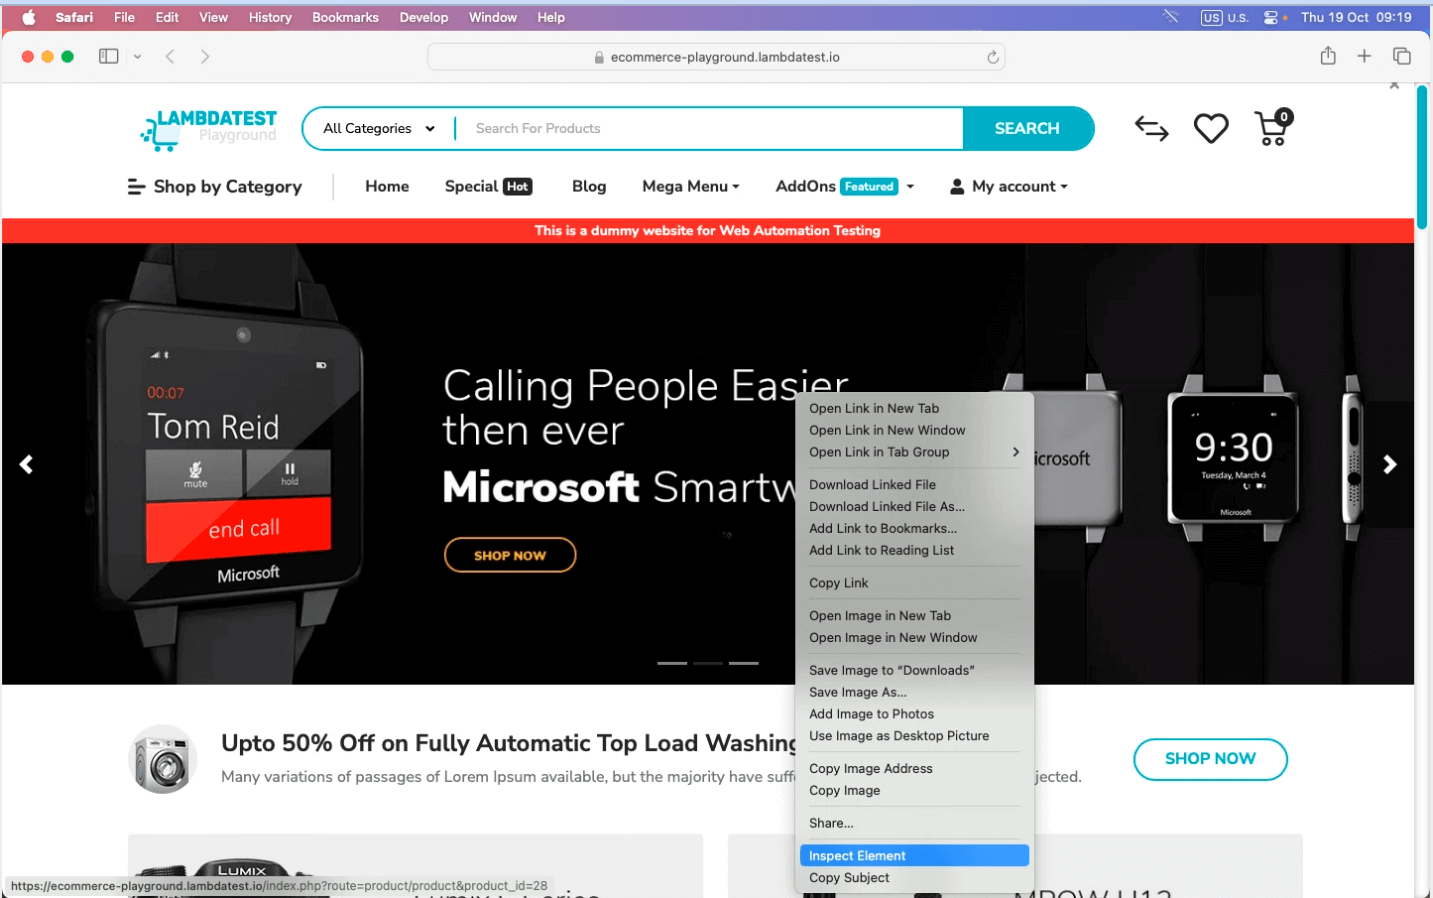
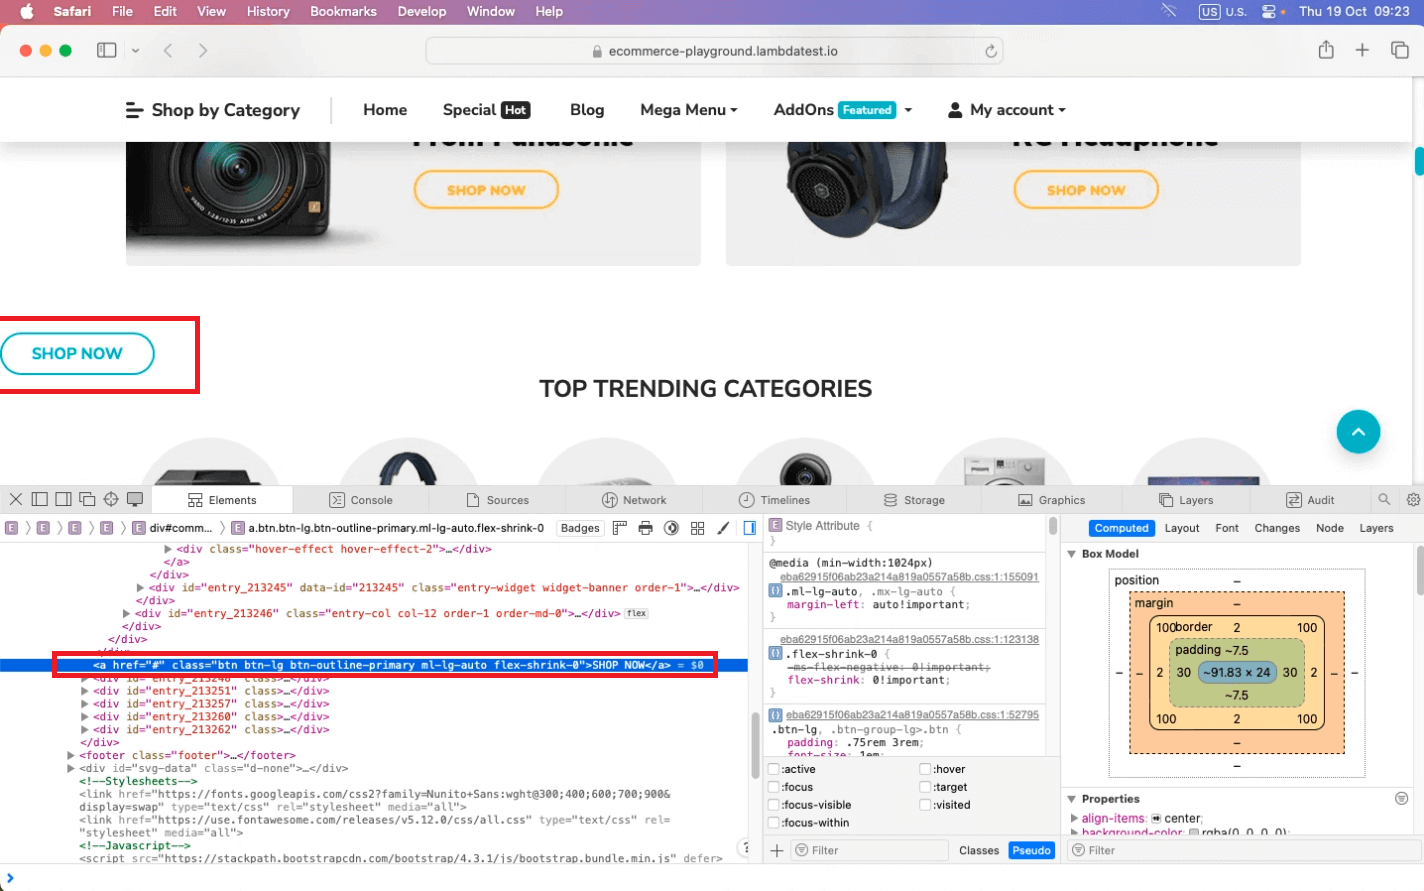
- Visit your desired website. In this example, I will refer to the site LambdaTest Playground.
- Now that you know how to navigate to inspect elements, use any methods to inspect. Right-click on the webpage and select Inspect Element.
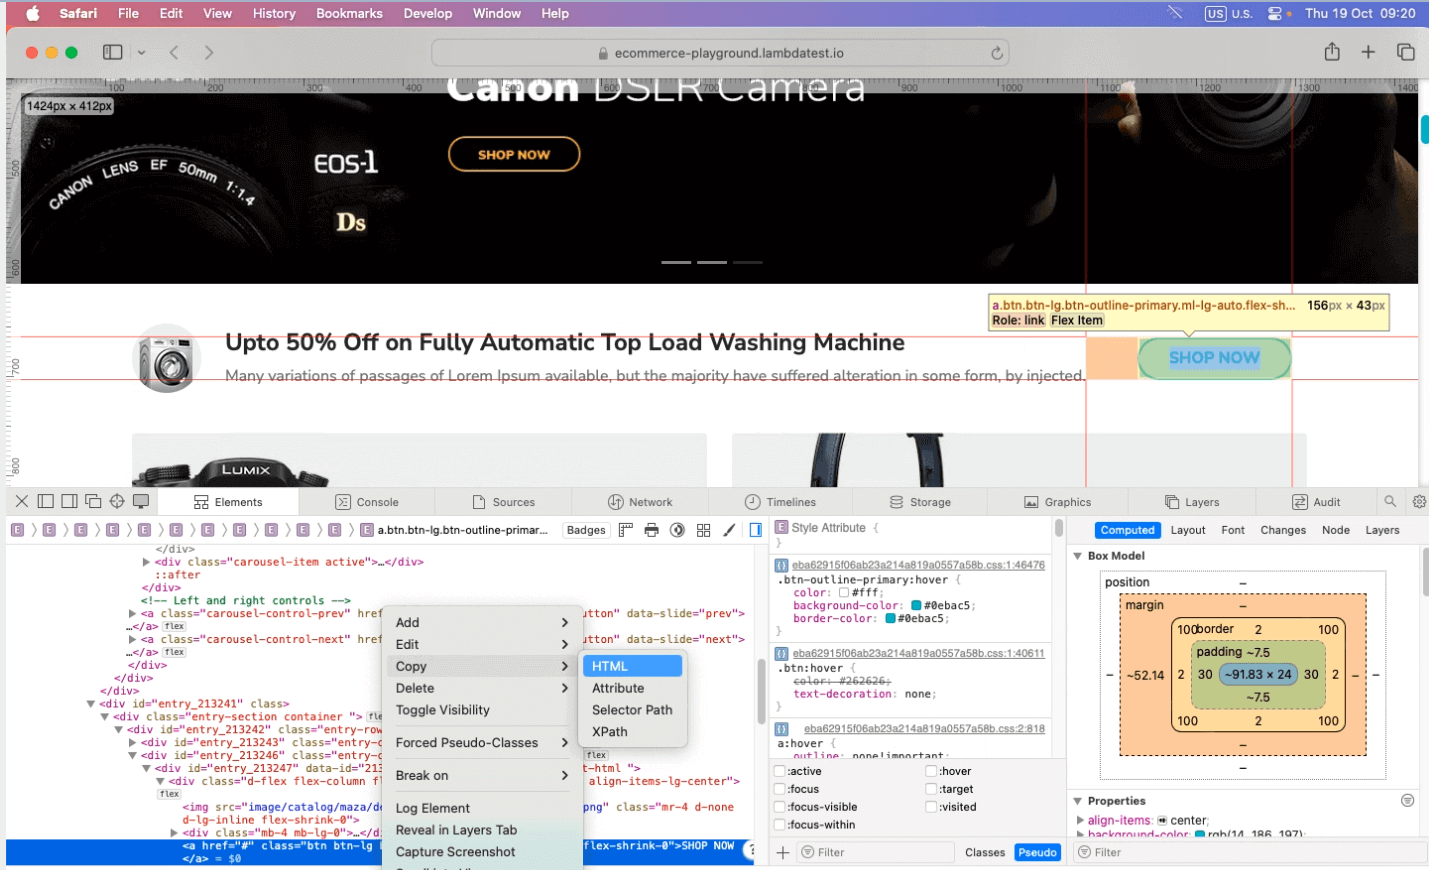
- A Developer panel appears; hover over a button and select the HTML element of the button called SHOW NOW. Right-click on the selected element > choose Copy > select HTML. This will copy the entire button tag element.
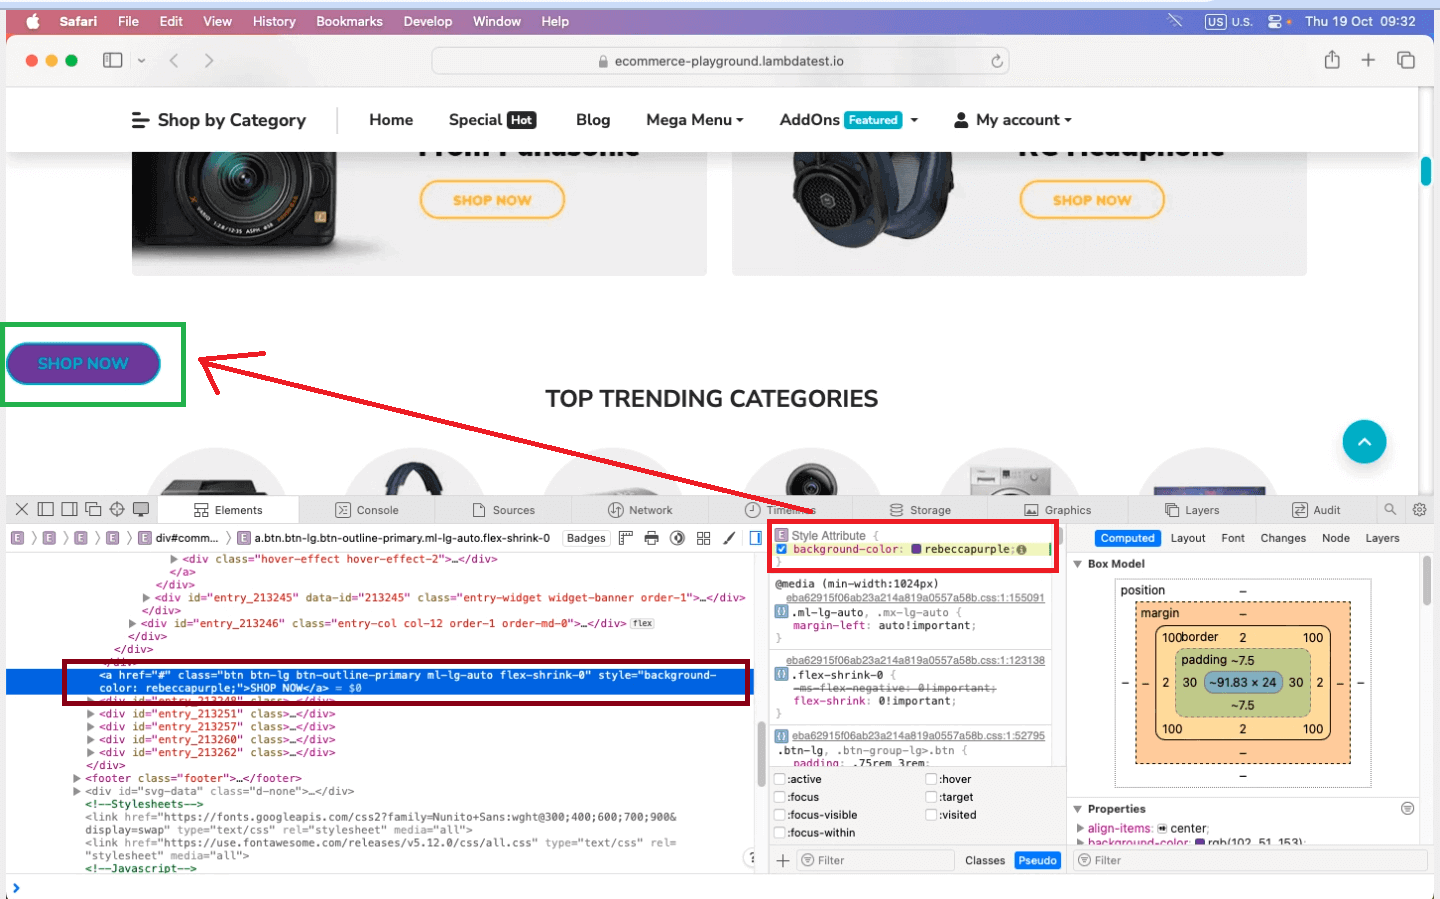
- Now that you have copied the element, you can paste it anywhere within the site. To do so, all you need to do is click Ctrl+V.
- The pasted element consists of the same styles. You can change the button styling or keep it the same as per the requirement. To change the style or appearance of the button, you need to use the right side panel for CSS to make it look different.

In the below example, we changed the button’s color to purple using the CSS section on the right-side panel. You need basic HTML, CSS, and sometimes JavaScript knowledge to make specific changes to your HTML element.
Hope you understood the copying of HTML elements by following the steps and performing the same.
Different ways to inspect elements on Mac
Utilizing web browsers’ built-in tools to inspect elements is a fundamental skill. These tools are invaluable for exploring web page structures, making element identifications and modifications, and troubleshooting issues.
Inspecting elements using built-in tools
This section will explore some built-in tools available in well-known browsers for inspecting and interacting with web page elements.
- Use Accessibility Inspector
- Use Developer Tools (Limited Use)
This Accessibility Inspector helps users analyze the structure and properties of elements within applications. It is designed for testing and debugging accessibility By providing some detailed insights into the aspects of third-party applications.
This might use web technologies like HTML, CSS, JavaScript, and more for their user interface. Giving limited access to developer’s tools similar to what you would get by inspecting websites or web pages in a browser.
Various third-party external tools are specifically designed to help in element inspection for debugging purposes. Some tools are mentioned below.
- Firebug
This browser extension for Firefox offers a complete suite of web development tools, including element inspection and debugging.
- Selenium
While often used for web testing, Selenium can also inspect and interact with elements on web pages.
- Fiddler
This web debugging proxy tool enables you to capture and analyze network traffic, inspect HTTP/HTTPS requests, and troubleshoot web applications.
- Charles Proxy
Another web debugging proxy tool, Charles Proxy, provides detailed insights into network traffic and allows for the inspection of both requests and responses.
- Browser DevTools Extensions
Many browsers offer extensions in their web stores that enhance their built-in DevTools, providing more advanced element inspection and debugging capabilities.
These external tools can be handy for developers and testers when the existing browser tools may not fully meet their needs or in specialized scenarios. They provide additional features and capabilities for inspecting and debugging elements on web pages.
Efficiently inspecting and debugging elements on different browsers is a crucial challenge. While browsers have built-in tools, they may not always suffice for specialized or complex tasks. Developers and testers often seek more advanced solutions to streamline their testing processes.
When it comes to speeding up your application testing on various browsers and addressing intricate debugging challenges, you need the right tools. Explore this blog on fast-tracking cross-browser testing and debugging with LambdaTest.
Inspecting elements on the cloud
When it comes to inspecting elements to get more detailed information about your sites without the help of developers or when you need insight to see which script is failing, you can leverage cloud testing platforms like LambdaTest.
Cloud testing platforms offer a number of advantages for inspecting elements on Mac. They provide access to a wider range of devices and browsers, are scalable and flexible, can be more cost-effective than traditional on-premises testing solutions, are easy to use, and support collaboration with third-party tools.
LambdaTest can be more straightforward and accessible for developers and software testers. LambdaTest is an AI-powered test orchestration and execution platform that lets you run manual and automated tests over 3000+ real browsers, devices, and OS combinations. All you need to do is follow these steps.
- Create an account on LambdaTest.
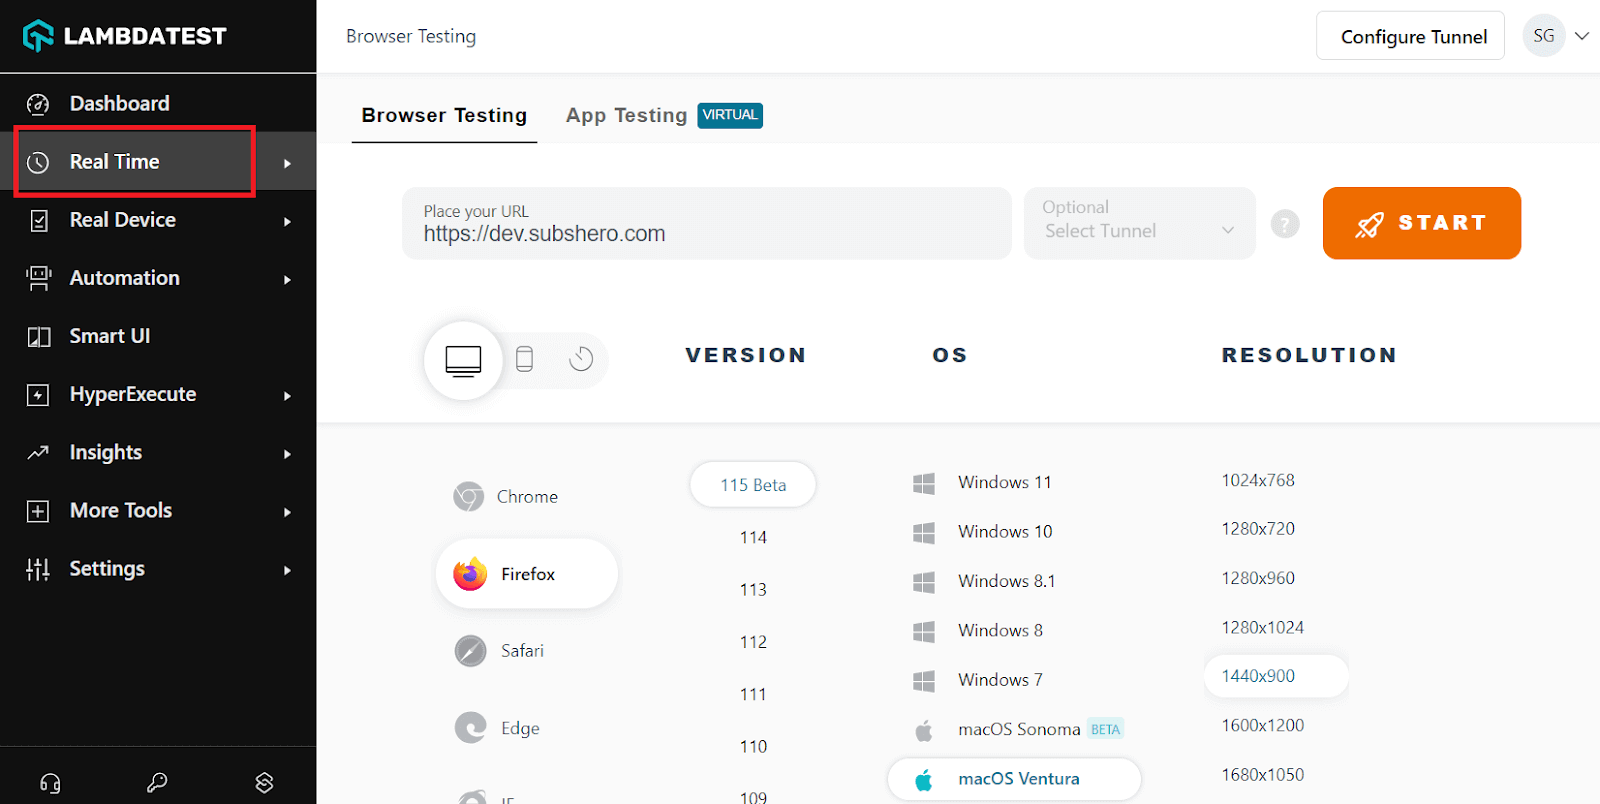
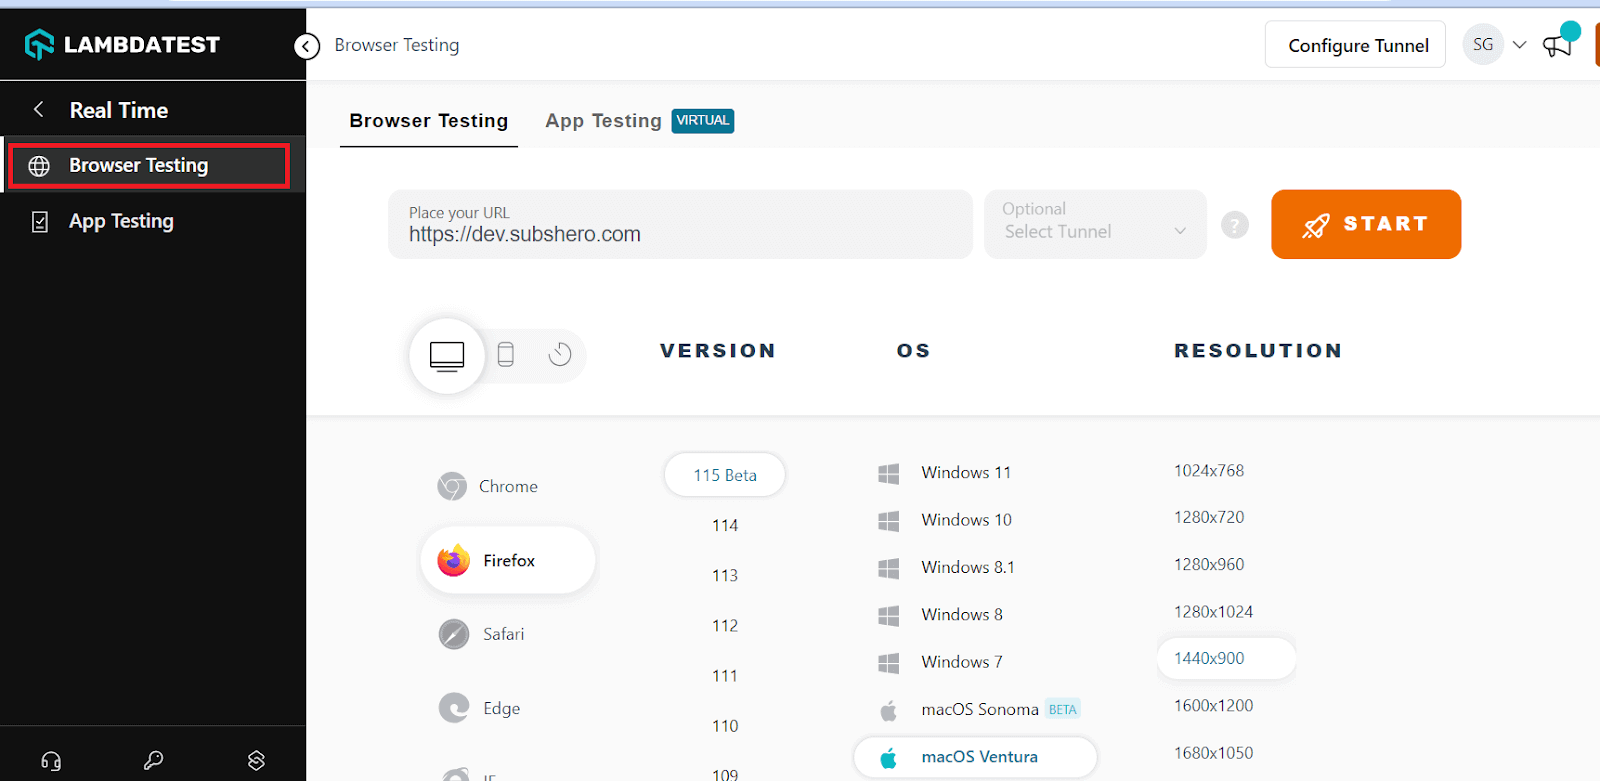
- Visit Real Time from the left menu bar.
- Select Browser Testing
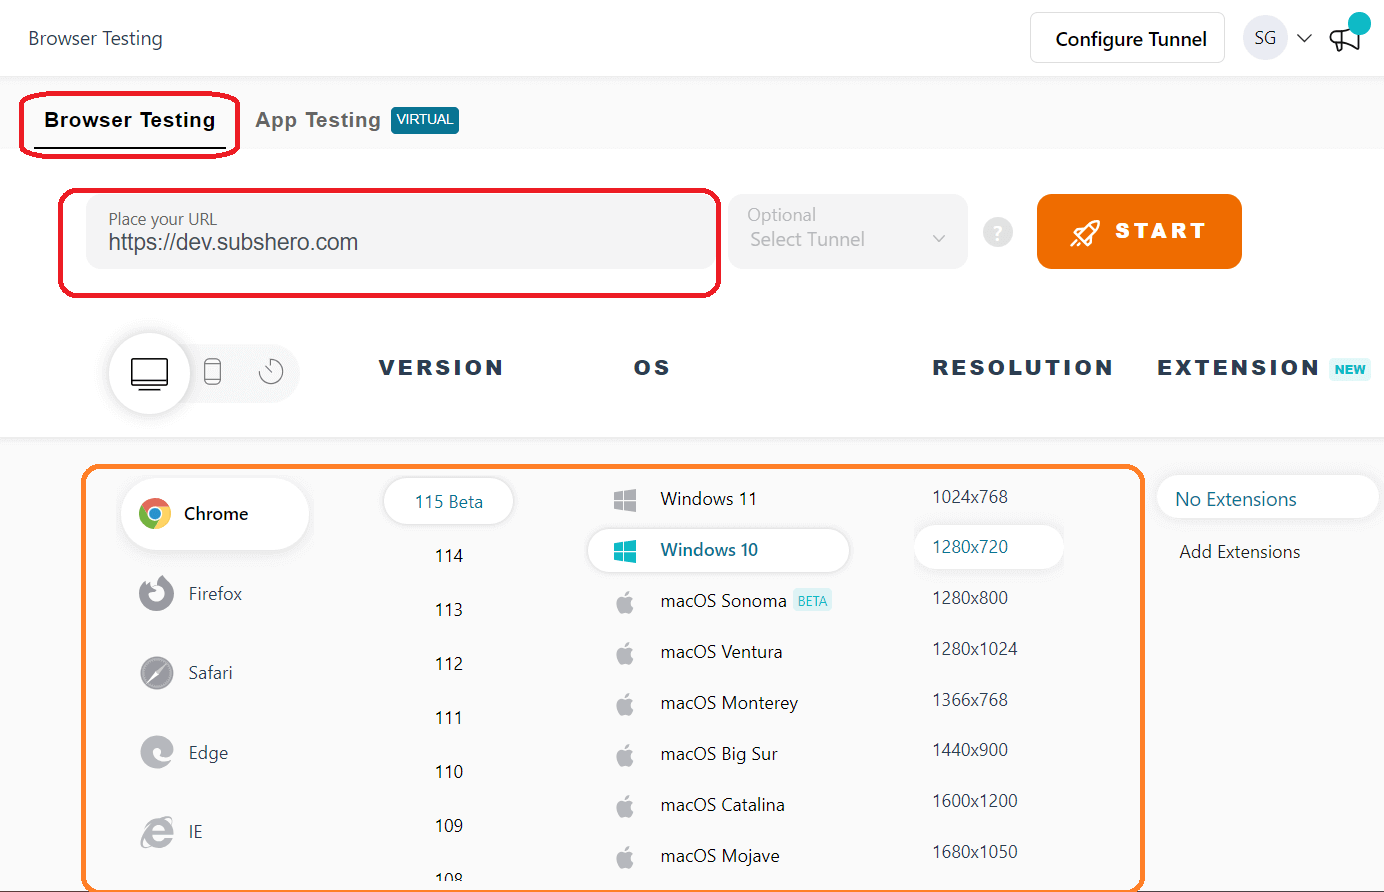
- In the URL section, enter the URL you want to perform Inspect. Select which operating system you want to test on, select the browser, select the version, and click the START button.
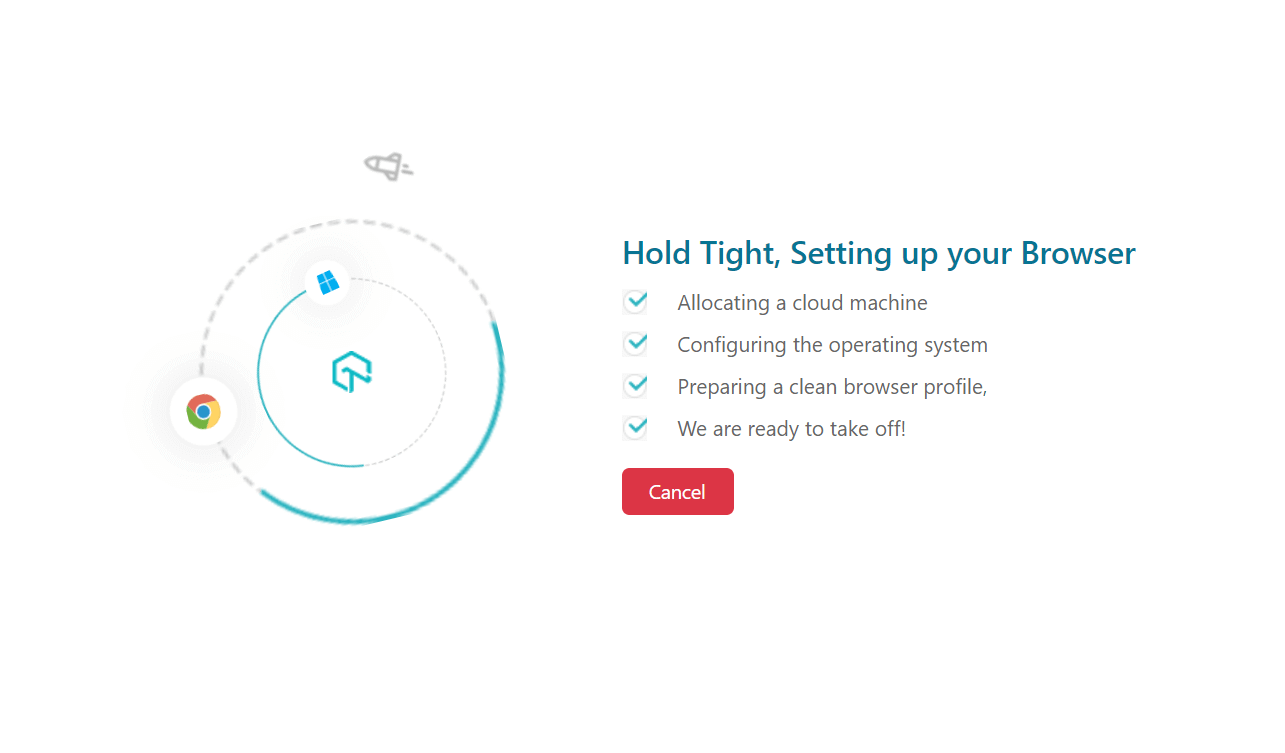
- Give a few minutes for the site to launch.
- You can see the website is launched, and you can just right-click on the website, click on Inspect, and the developer panel will appear. On the left side, you can have multiple options to help you with some actions.
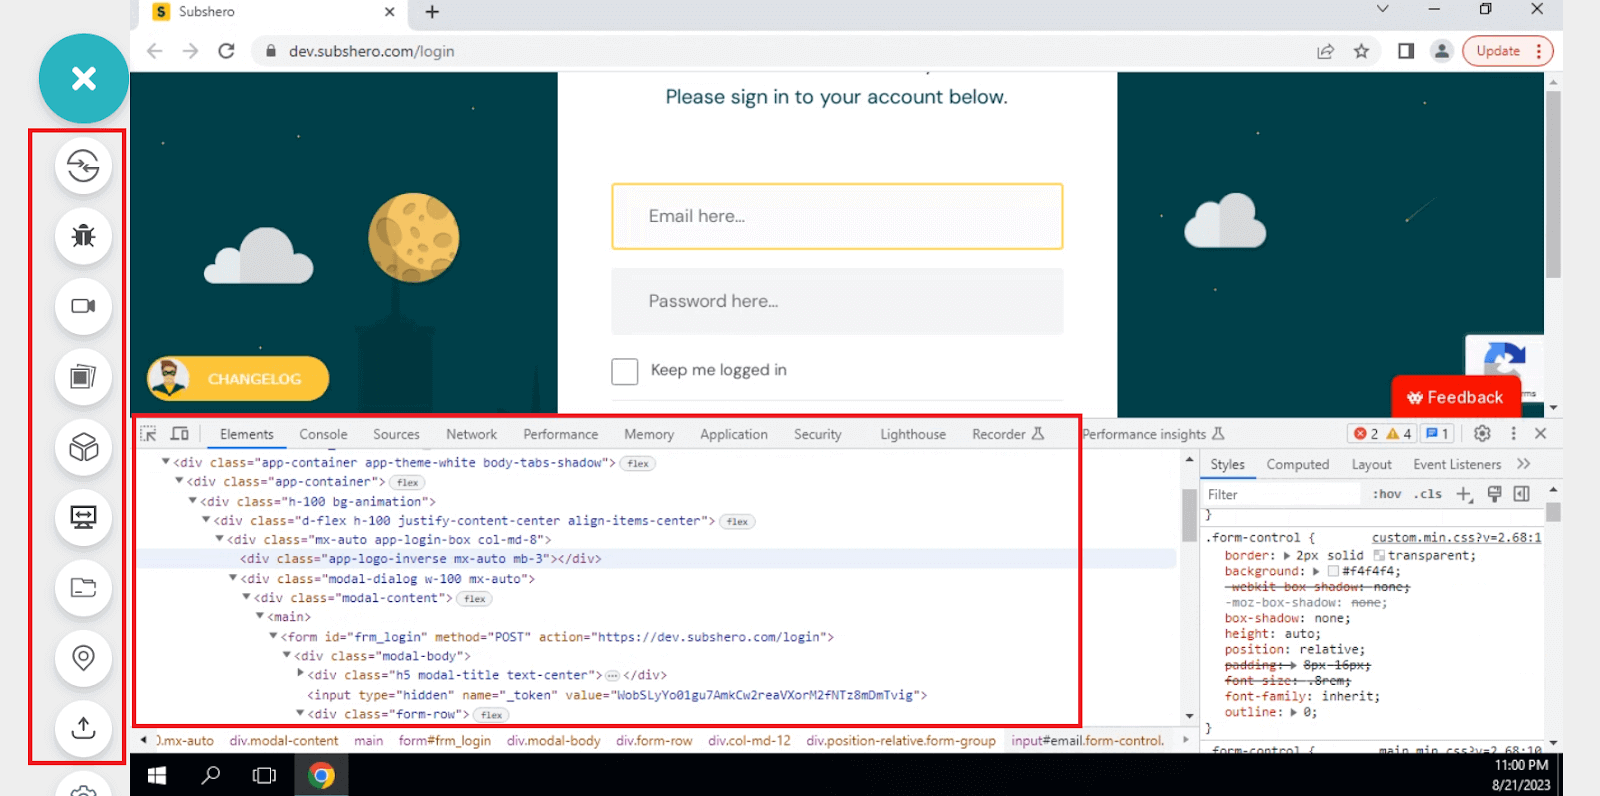
The action buttons on the left side of the screen can help report bugs while testing or inspecting the element. You can capture the bugs and share them with the group. The video button can help you record your entire inspection and keep it for the record.
Get a complete walkthrough on using LambdaTest by watching the full tutorial on all products and features.
Subscribe to the LambdaTest YouTube channel for more videos on responsive testing online and real-time testing to enhance your testing experience!
Inspecting elements using responsive testing tools
So far, we have learned how to inspect elements with LambdaTest. However, another quick method to test mobile responsiveness is to use a responsive testing tool like LT Browser.
LT Browser by LambdaTest provides a complete mobile testing environment with over 50 built-in device viewports for mobiles, tablets, laptops, and more.
Developers can smoothly inspect elements across multiple devices and viewports. LT Browser makes it easy to catch responsiveness bugs and mobile-specific issues that basic inspect elements tools would miss.

You can also watch this video to get started with LT Browser, which will help you understand its functionalities better.
Let us try LT Browser by following the steps.
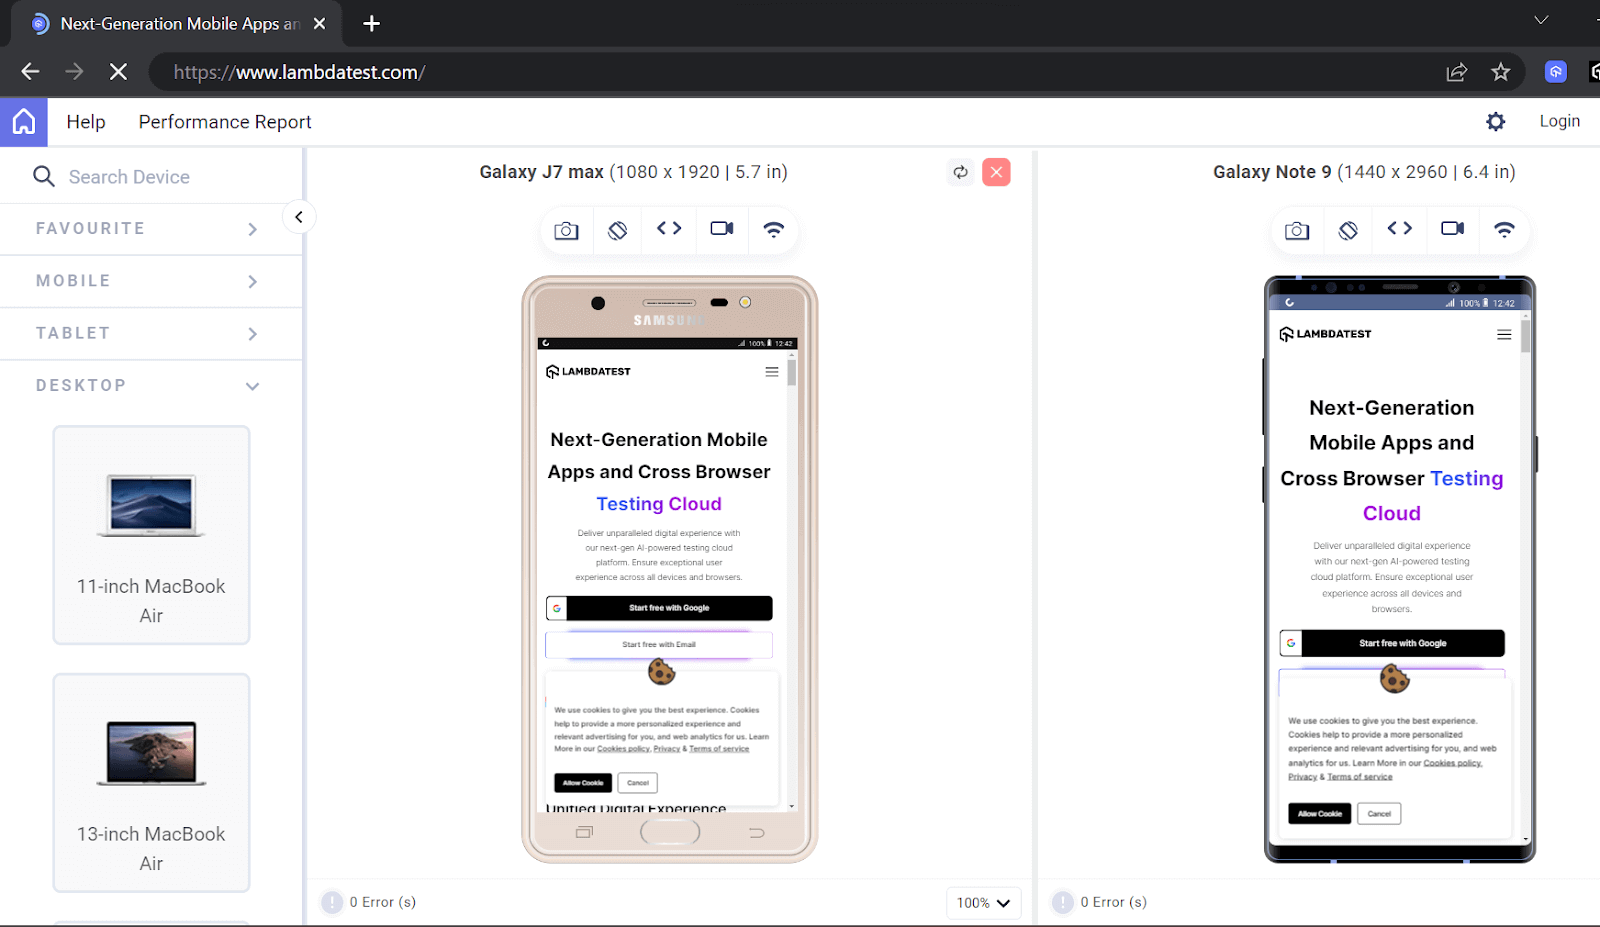
- Download and install LT Browser. Once you open the .exe file, you will see the below screen.
- From the left menu, select DESKTOP and choose 11-inch MacBook Air from the dropdown options.
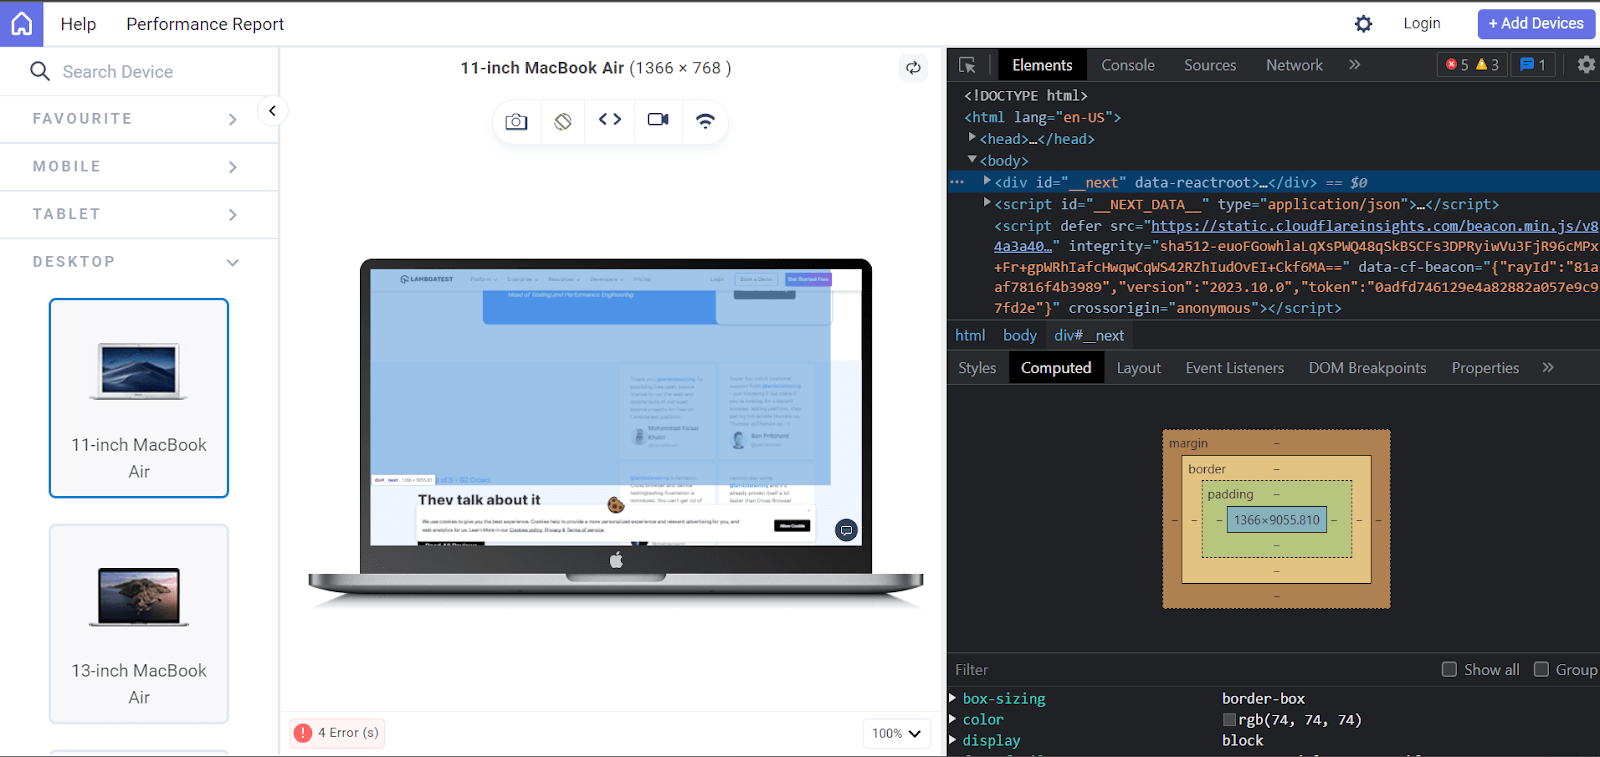
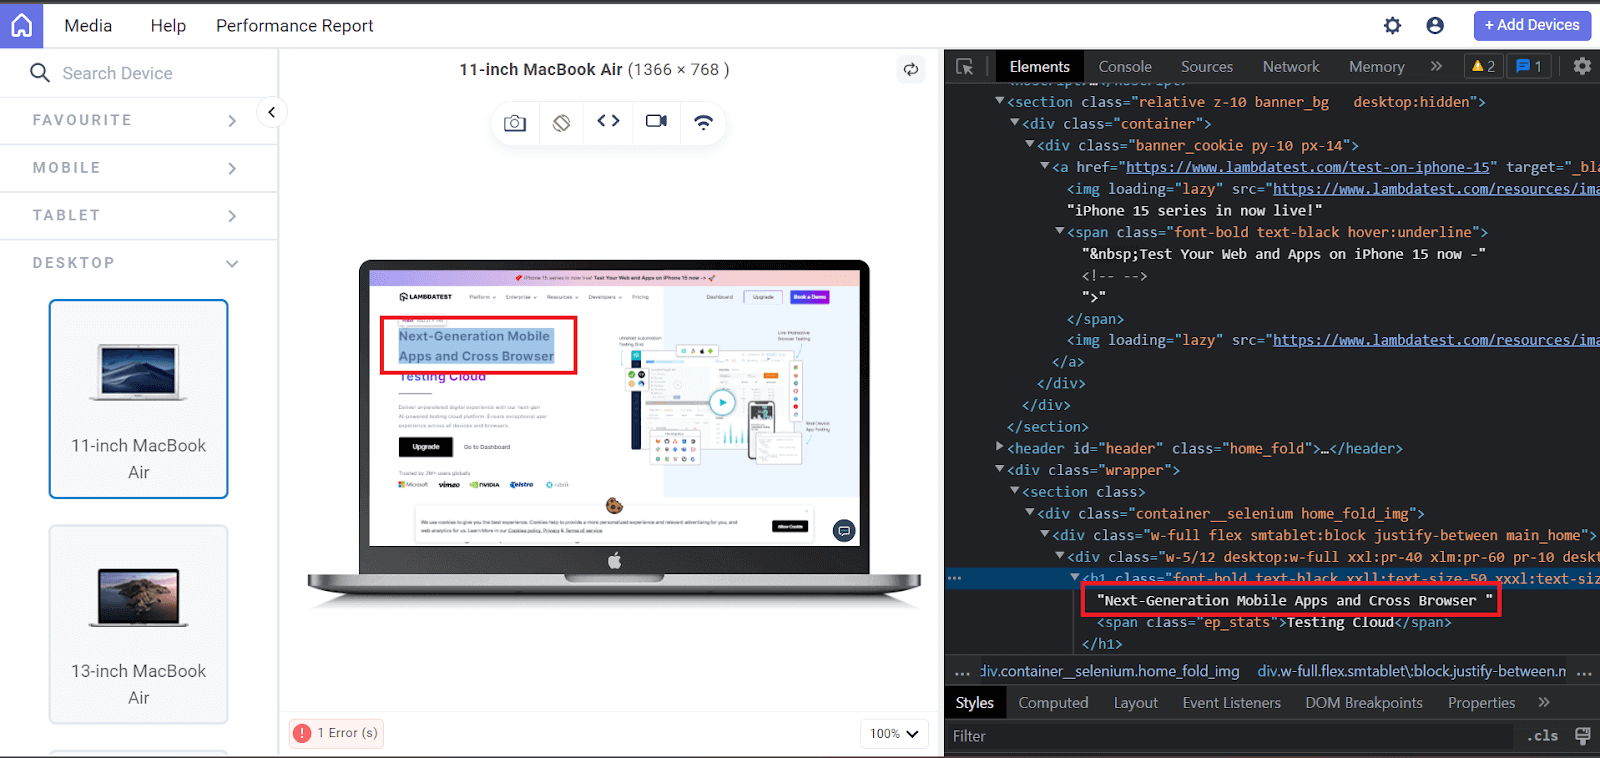
- Tap the debugger icon (<>) to open the developer panel.
- Now, you can perform all the HTML operations like changing the text, copying HTML elements, and more.
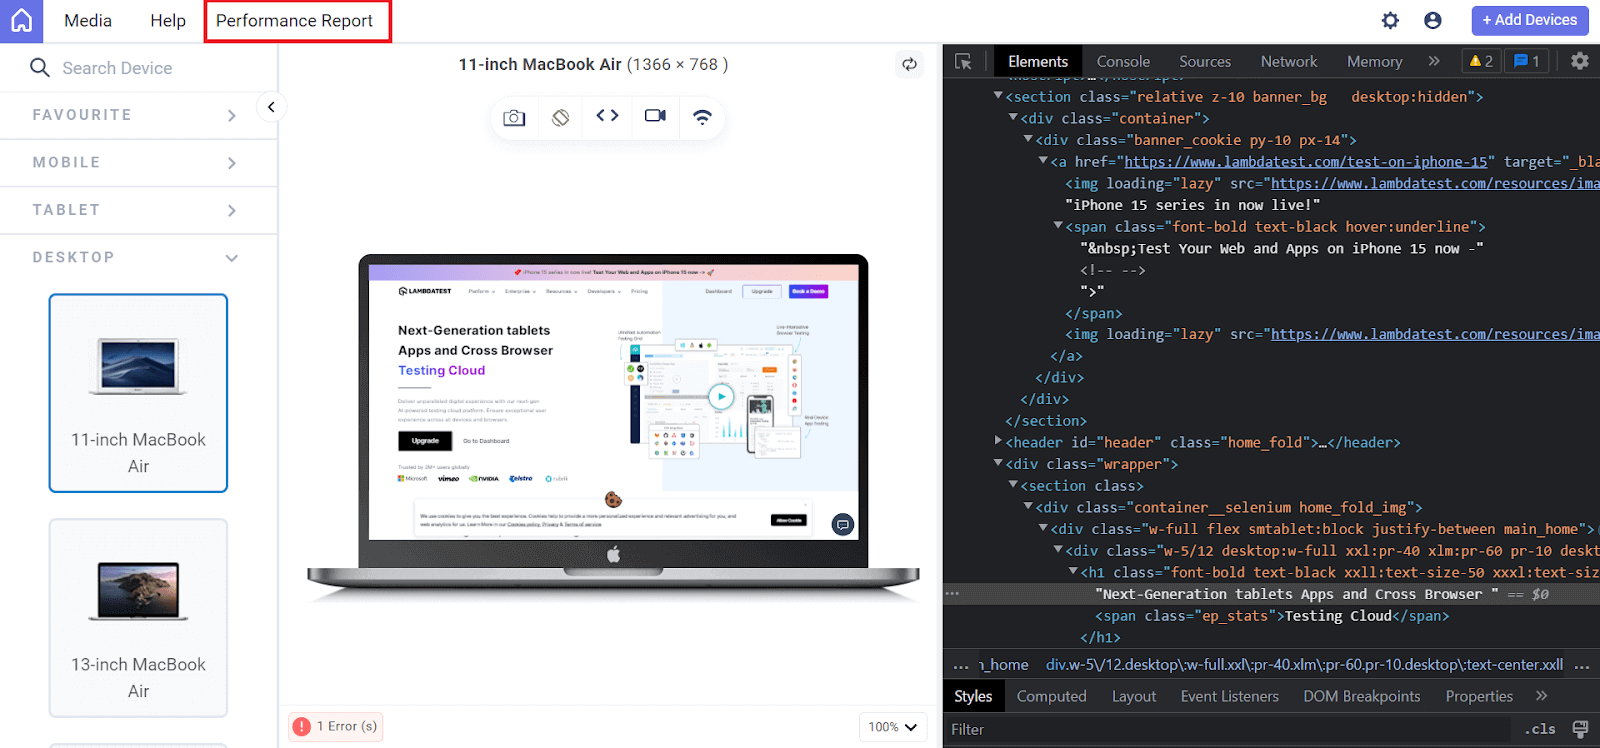
- You can also see the performance report by clicking the Performance Report tab from the header.
- It will redirect you to the detailed Performance Report page, where you can check the website’s loading speed, desktop and mobile performance, and more.
![]()
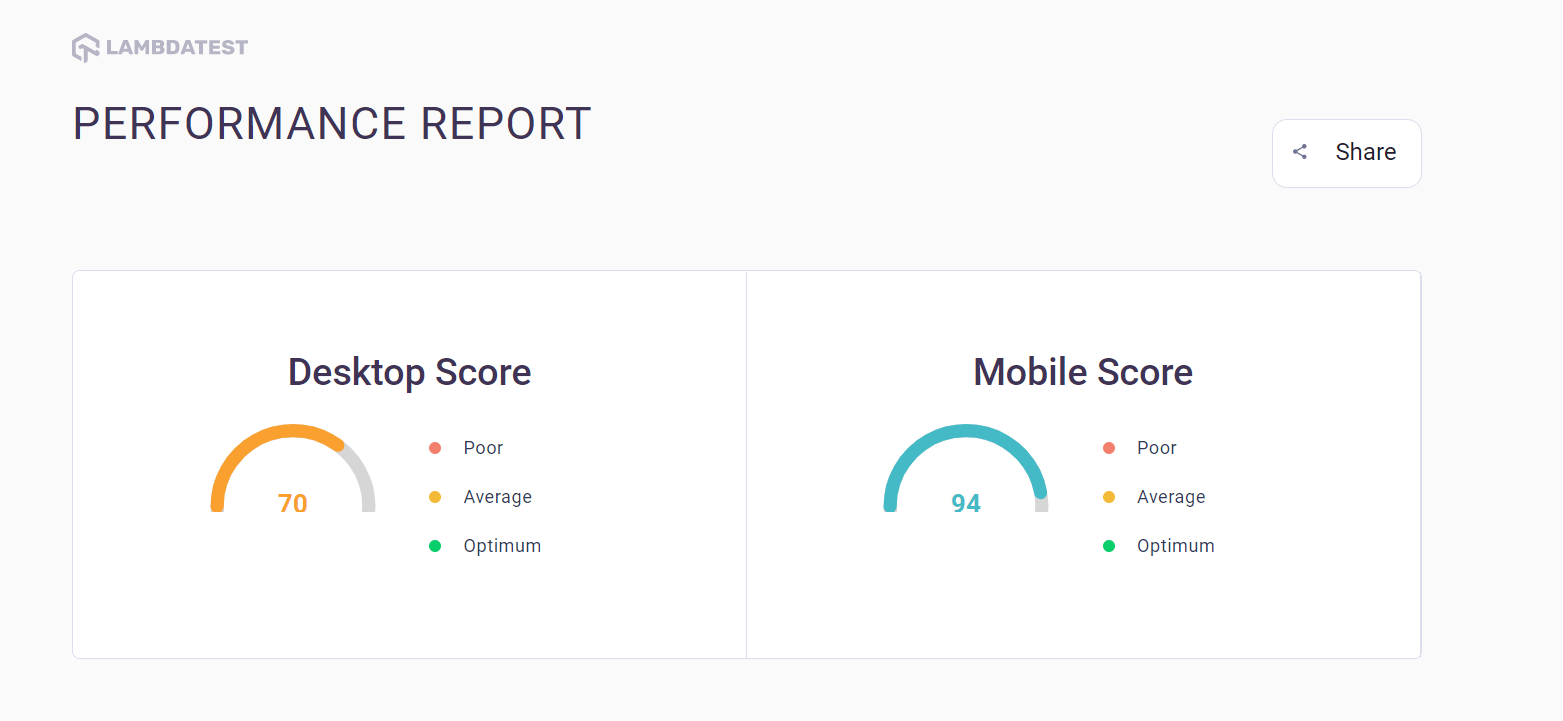
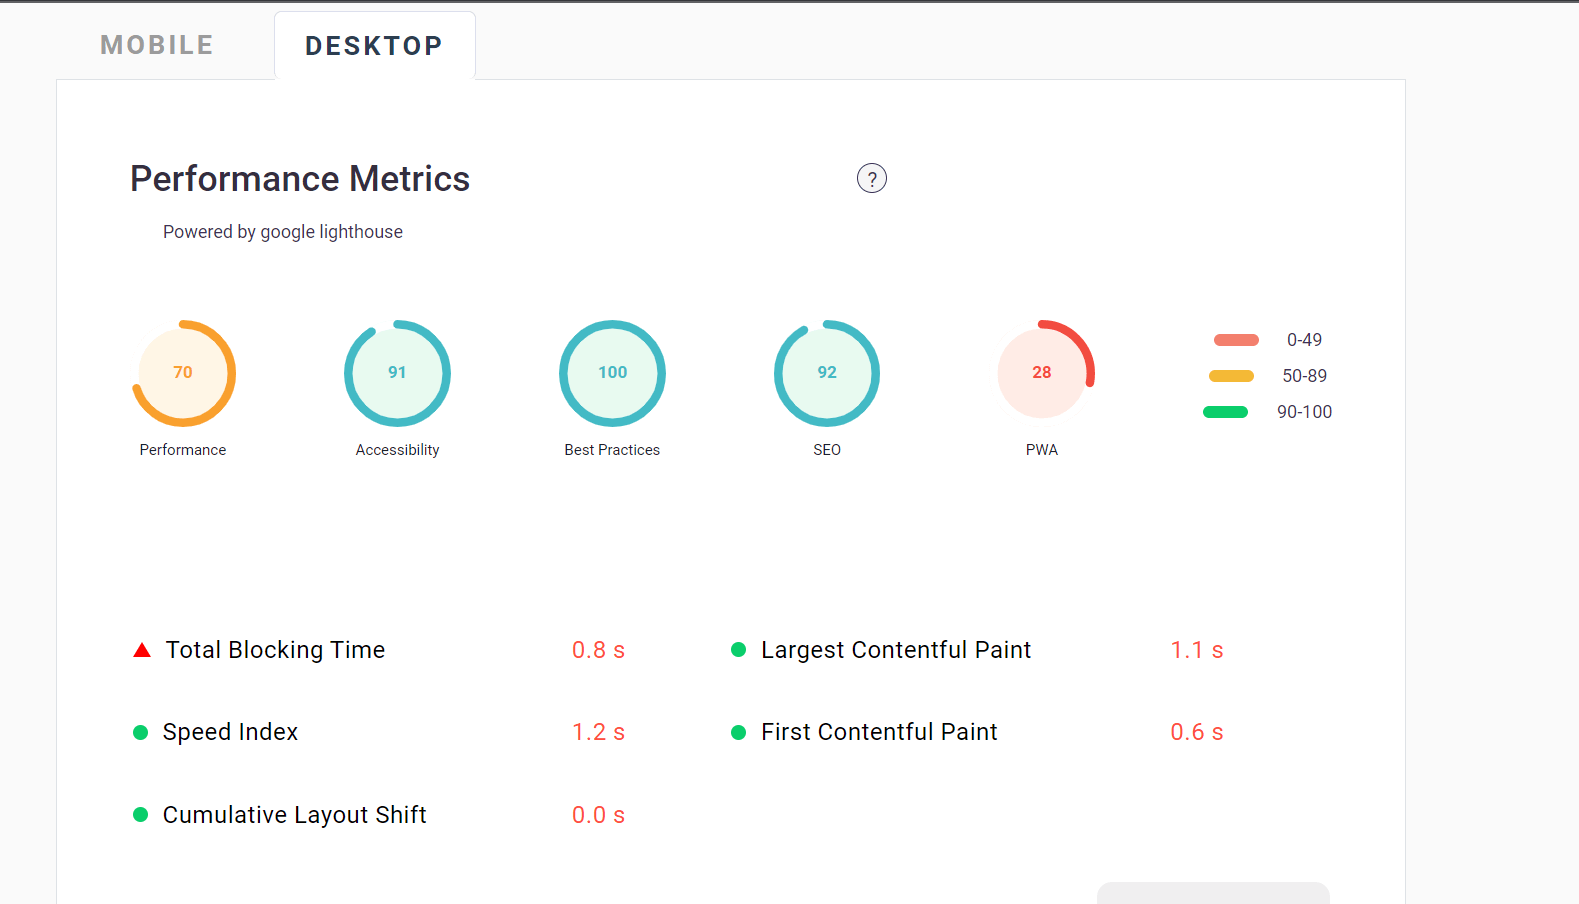
By using these steps, you can ensure your website looks and works well on various devices and screen sizes by selecting the devices from the left menu of LT Browser.
Hope you learned how to navigate through and understand better how to use Mac for element inspection along with well-known browsers and learned how to perform the inspection using a cloud-based platform like LambdaTest.
Conclusion
In this tutorial, we have learned the concept of inspecting elements on Mac using browsers like Safari, Chrome, and Firefox. We know this is important and valuable to both developers and software testers, providing insights into website structure and aiding in debugging. Enabling developer mode in Safari was detailed, alongside keyboard shortcuts to quickly access the inspect elements on Mac.
Furthermore, I have covered the steps to inspect and modify HTML elements and how to edit, copy, and duplicate elements using Safari’s developer panel. We saw that these changes are temporary but can guide developers’ coding decisions.
We have also covered the benefits of cloud-based platforms like LambdaTest, with a walkthrough of performing inspect elements on Mac tools.
Now, you have mastered the Inspect element that empowers developers and testers to achieve more significant insights into websites and applications, help debug processes, and improve overall productivity.
Frequently Asked Questions (FAQs)
How do you inspect elements in Chrome on a Mac?
To inspect elements in Google Chrome on Mac, simply visit the website, Right-click on the website, select “Inspect,” and use the developer tools panel to make any modification to HTML and CSS.
Why can’t I inspect a page?
To enable the “Inspect Element” feature on a Mac, follow the below steps:
- Open the Safari browser
- Click on “Safari” in the top menu bar.
- Select “Preferences.”
- In the Preferences window, go to the “Advanced” tab.
- Check the “Show Develop menu in menu bar.”
This will turn on developer mode, allowing you to inspect the page you want.
How do you inspect elements on a Mac without right-clicking?
Using the shortcut keys for Mac, Option+Command+C
How do I enable Web Inspector on Mac?
To enable Web Inspector on Mac, first enable developer mode, then to open Web Inspector, select Develop > Show Web Inspector.
How do I edit a website with an inspect element?
By right-clicking on an element, selecting “Inspect,” and accessing the webpage’s code in a panel, you can make temporary modifications such as altering text and adjusting colors by double-clicking and inputting new values. It’s important to note that these adjustments solely impact your view of the website and do not modify it for others.


Author’s Profile
Saniya Gazala
Saniya Gazala is a Computer Science graduate from Reva University. She began as a manual tester, honing her skills in defect identification and problem-solving. Transitioning to technical writing, she simplified complex tech concepts for users. Her journey is marked by continuous learning and growth in the tech industry.
Blogs: 13
Got Questions? Drop them on LambdaTest Community. Visit now


