How To Generate PHPUnit Coverage Report In HTML and XML?
Himanshu Sheth
Posted On: January 27, 2021
![]() 224722 Views
224722 Views
![]() 25 Min Read
25 Min Read
Code coverage is a vital measure for describing how the source implementation is tested by the test code (or test suite). It is one of the critical factors for ensuring the effectiveness of the code. PHPUnit, a popular test framework in PHP, also provides different ways for generating PHPUnit coverage report in HTML and XML.
Like me, you would have also come across many scenarios where the quality team comes back regarding insufficient code coverage since lower code coverage could be catastrophic for the product. As a Selenium PHP automation tester, it is essential to leverage the PHPUnit framework features for generating PHPUnit coverage report in HTML and XML.
By the end of this blog, you would be comfortable generating code coverage reports using the PHPUnit framework with Selenium.
TABLE OF CONTENT
- Introduction to Xdebug (Debugger for PHP)
- Introduction to PCOV (code coverage driver for PHP)
- PHPUnit code coverage reports using phpunit/php-code-coverage
- Demonstration – Generation of code coverage report in PHP
- PHPUnit code coverage report using PCOV and Xdebug
- PHPUnit code coverage report on Cloud-based Selenium Grid
Introduction to Xdebug (Debugger for PHP)
Xdebug, the PHP debugger and profiler tool, was initially presented by Derick Rethans in 2003. At that time, he introduced code coverage information collection to the PHP community for the first time.
php-code-coverage, which was later spun out from PHPUnit as a reusable component, leverages the code coverage functionality provided by Xdebug or PCOV(code coverage driver for PHP). The PHPUnit framework provides options for generating reports and log files in widely-used formats like HTML and XML. The framework lets you facilitate code coverage information in formats such as Clover, Crap4J, Text, and PHP.
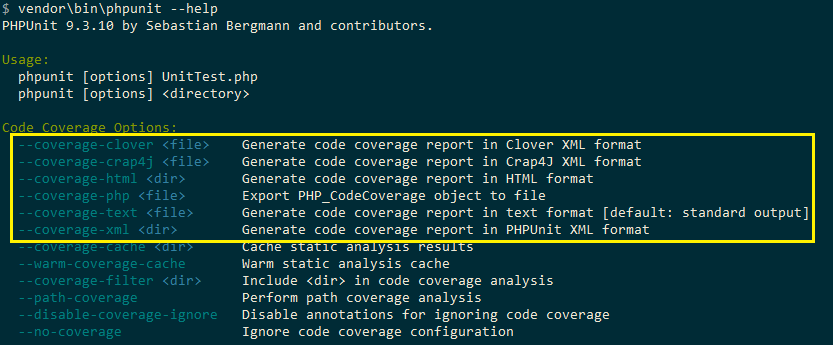
PHPUnit code coverage report information can also be printed on STDOUT, avoiding the need for exporting the results in a detailed report. This is not a feasible option to consider for large automation projects, as code coverage information will not be available for access to different project stakeholders.
Core features of Xdebug
Xdebug, which is an extension for PHP, has been in development since 2012. The latest version of Xdebug is 3.0.2, which was released on Sep 2, 2020. These are the primary features of Xdebug that aids in debugging and development:
- Xdebug adds stack traces for warnings, notices, exceptions, and errors.
- It upgrades the
var_dump()function of PHP. - It is equipped with a single-step debugger that can be used with IDEs.
- Along with code coverage functionality, Xdebug also provides a profiler that is handy for profiling the source code.
It also provides functionality that does the recording of every function call and assignment to the disk.
How to install Xdebug for PHP on Windows
Xdebug is not available by default with the PHP installer. The Xdebug feature support has to be enabled in the PHP configuration file (php.ini).
For installing the PHPUnit framework, create a composer.json file for the project:
|
1 2 3 4 5 6 7 8 9 10 |
{ "require":{ "php":">=7.1", "phpunit/phpunit-selenium": "*", "php-webdriver/webdriver":"1.8.0" }, "require-dev": { "phpunit/phpunit": "^9.3", } } |
Run the command composer require and press ‘Enter’ twice for installing the PHPUnit framework. With this, the PHPUnit framework with version 9.3 is installed.
As seen in the terminal screenshot below, Xdebug (or alternate code coverage driver) is not available in the framework. Hence, trying to generate a PHPUnit coverage report in HTML by invoking the command vendor\bin\phpunit --coverage-html < directory > gives a warning ‘No code coverage driver available.’

Alternately, you can redirect the console output to some text file by running the command php –i > <some_text_file> and paste the text file’s contents in https://xdebug.org/wizard, to view the PHPUnit coverage report in HTML. As seen in the ‘PHP Info Summary,’ Xdebug is not installed on our machine:
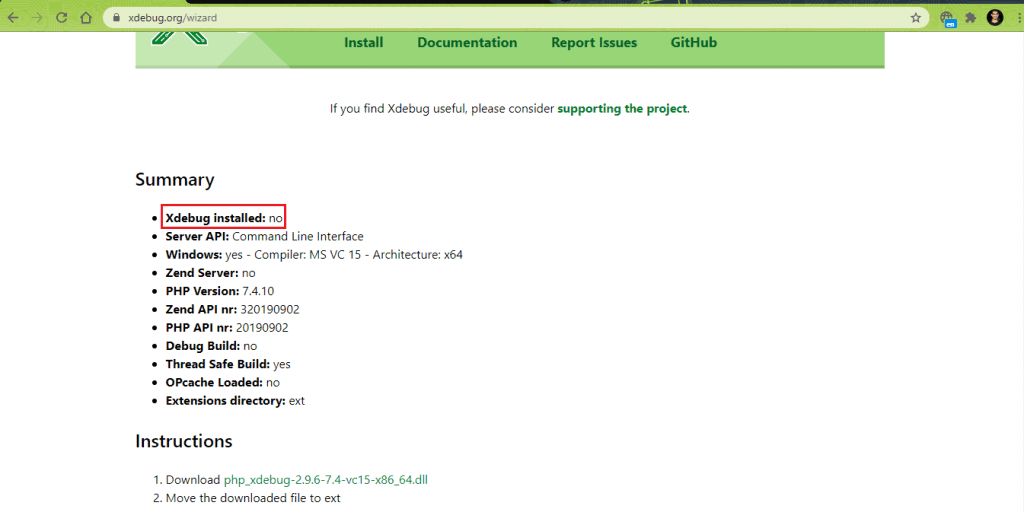
For enabling support for Xdebug in the framework, download the appropriate DLL as mentioned in the ‘Instructions’ section in https://xdebug.org/wizard.
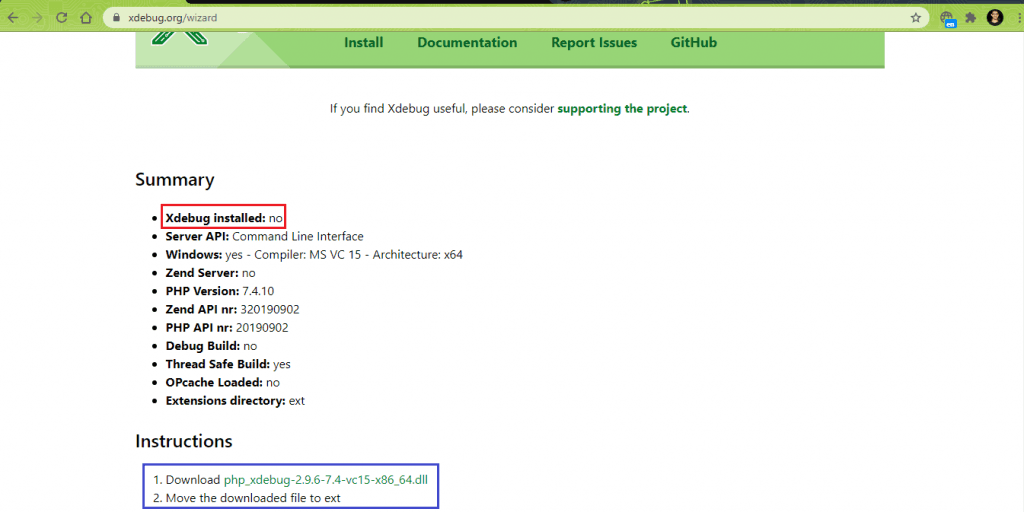
We performed the following operations for installing Xdebug for PHP on Windows:
- Download the latest Xdebug DLL file for PHP from here. The DLL being suggested can differ based on the configuration of the machine where PHP is installed.
- Move the downloaded DLL file to the ‘ext’ folder of the PHP installer. We have renamed the DLL to php_xdebug.dll.
- Modify
c:\PHP\php.iniby adding the entry of Xdebug DLL in zend_extension
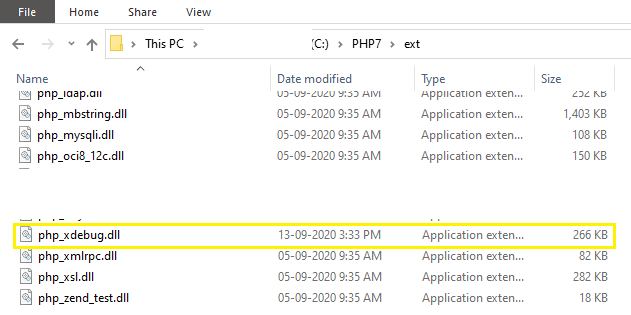
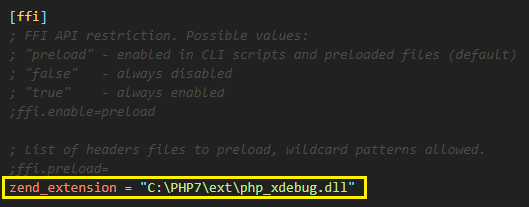
With this, the Xdebug support is enabled. To confirm, execute the command php –i > < some_text_file_2 > and paste the contents of the text file in https://xdebug.org/wizard. As seen in the ‘PHP Info Summary,’ it is confirmed that Xdebug support is enabled for PHPUnit installed on our machine:
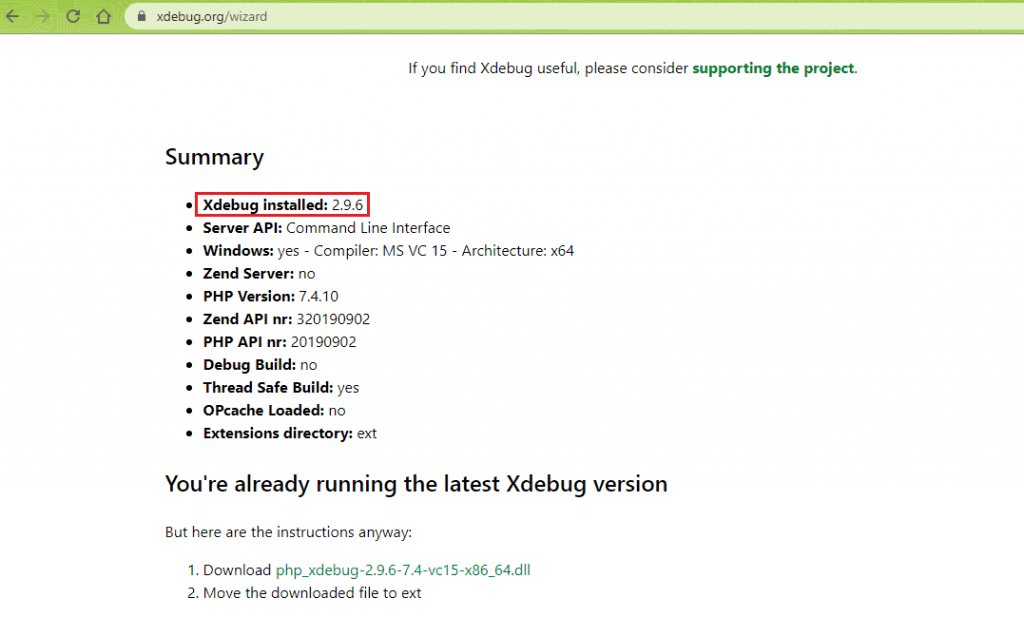
The execution of command vendor\bin\phpunit --coverage-html <directory> on the terminal now indicates that ‘code coverage driver is available’.
![]()
Introduction to PCOV (code coverage driver for PHP)
Unlike Xdebug, which provides features for debugging, code coverage reporting, etc., PCOV is just a self-contained code coverage compatible driver for PHP7 (and above).
The PCOV project is hosted on GitHub.
How to install PCOV for PHP on Windows
For installing PCOV for PHP, perform the following steps:
- Download the thread-safe DLL of PCOV according to the architecture of the machine where PHP is installed. In our case, we downloaded the following PCOV DLL, which is for an x64 machine. PCOV DLL’s for other machine architectures are available in their official download link.
- Untar the zip file and copy the tar file’s contents (i.e., php_pcov.dll and php_pcov.pdb) to the ‘ext’ folder present in the PHP installation directory.
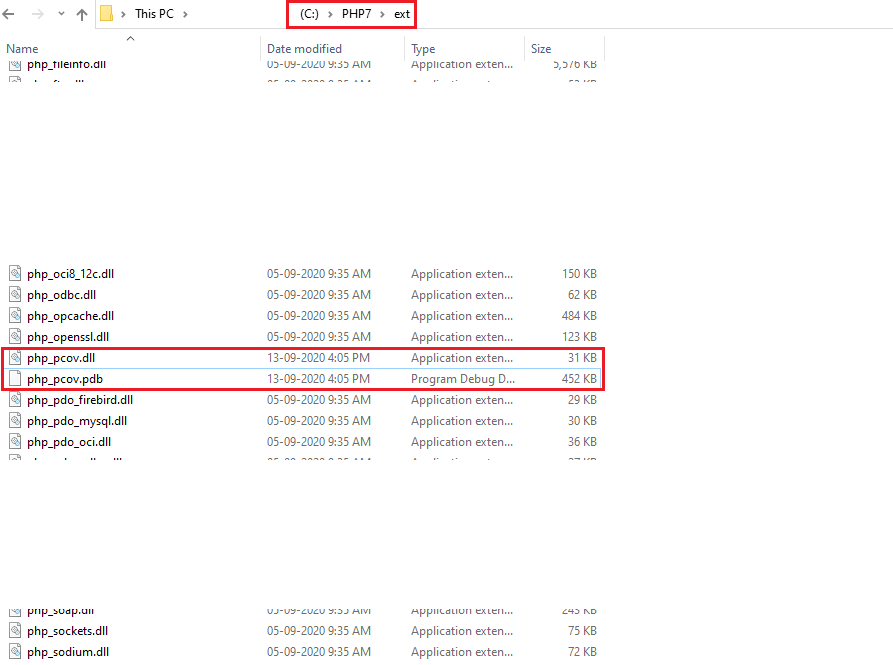
We also copied the Program Debugger Database file for PCOV to the ‘dev’ folder present in the PHP installation directory.

- Modify php.ini file for adding support of PCOV extension by adding the entry
extension=pcov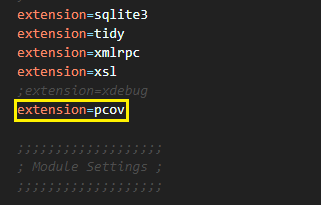
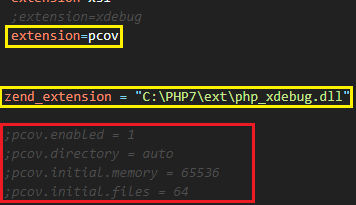
Though additional modifications are recommended in the official link of PCOV, we commented on those entries in php.ini, as we witnessed issues when using php-code-coverage with PCOV.
Shown below are the final settings for using PCOV for PHPUnit code coverage report:

- Modify the project-specific composer.json file to add an entry for installing the pcov/clobber package with version 2.0 (or above).

|
1 2 3 4 5 6 7 8 9 10 11 |
{ "require":{ "php":">=7.1", "phpunit/phpunit-selenium": "*", "php-webdriver/webdriver":"1.8.0" }, "require-dev": { "phpunit/phpunit": "^9.3", "pcov/clobber": "^2.0" } } |
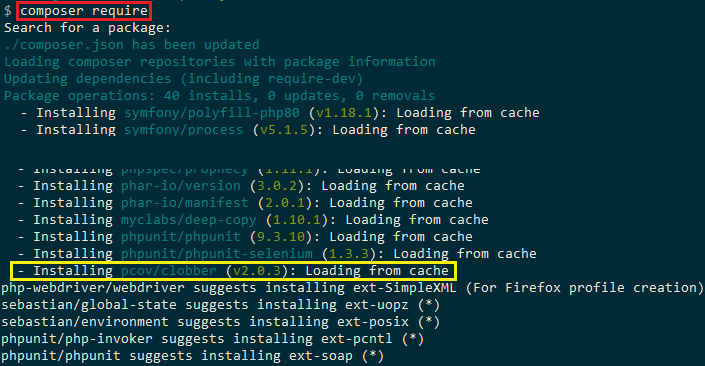
Run the command composer require on the terminal and press ‘Enter’ two times to install the PCOV package. As seen below, the PCOV package for the project was installed successfully.
Interoperability of PCOV with Xdebug
When PCOV is enabled with the addition of pcov.enabled=1 in the PHP configuration file (php.ini), interoperability with Xdebug is not possible. When PCOV is disabled using the configuration pcov.enabled=0, code runs at full speed, and Xdebug can also be loaded.
PCOV support was merged in PHPUnit 8. If you are using the older versions of PHPUnit (i.e., 5, 6, or 7), the developer of PCOV has provided a package that can clobber the Xdebug driver in the earlier versions of PHPUnit.
- The command
composer require pcov/clobber, installs the drivers for PCOV in the vendor directory, and installs vendor\bin\pcov. - The command
vendor/bin/pcov clobberclobbers the Xdebug driver in the current directory. - The command
vendor/bin/pcov clobberunclobbers the Xdebug driver in the current directory.
Apart from installing the PCOV package, we would not require the other two commands, as we are using PHPUnit 9.3 for demonstration. As mentioned earlier, we have commented on the options provided by PCOV, even when php-code-coverage uses PCOV.
PHPUnit code coverage reports using phpunit/php-code-coverage
The php-code-coverage module is spun out from PHPUnit and uses Xdebug & PCOV to provide code coverage information for Selenium PHP tests. Based on the configuration settings for Xdebug and PCOV in php.ini, php-code-coverage uses either of them to provide the user with useful detailed PHPUnit coverage report in HTML and XML.
The php-code-coverage package is available on GitHub. We would be using php-code-coverage with Xdebug and PCOV for collecting PHPUnit code coverage report information.
How to install php-code-coverage on Windows
The php-code-coverage library can be added as a per-project dependency using the Composer module. Run the following command on the terminal to install the php-code-coverage library for your project:
|
1 |
composer require phpunit/php-code-coverage |
A better option is to add the library requirement in the existing composer.json of the project. We modify the project composer.json by adding this extra request for installing php-code-coverage-library:
|
1 2 3 4 5 6 7 8 9 10 11 12 13 |
{ "require":{ "php":">=7.1", "phpunit/phpunit-selenium": "*", "php-webdriver/webdriver":"1.8.0", "symfony/symfony":"4.4" }, "require-dev": { "phpunit/php-code-coverage": "^9.1", "phpunit/phpunit": "^9.3", "pcov/clobber": "^2.0" } } |
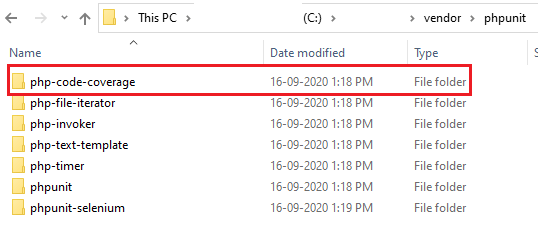
Run the command composer require on the terminal and press ‘Enter’ twice to install the phpunit/php-code-coverage library. On successful execution, the php-code-coverage library will be installed in < project_folder>\vendor\phpunit \php-code-coverage folder.
Usage of php-code-coverage for Coverage and Reporting in PHPUnit
In order to use php-code-coverage for reporting on PHPUnit coverage report in HTML, necessary hooks have to be added to the existing test implementation (or test cases). The library provides flexibility to perform code coverage on a ‘per line’ basis, which is a good indicator for checking whether the test code covers every line in the implementation.
Here are the changes that have be added to the test code for phpunit/php-code-coverage library to generate test reports (Reference Source):
Changes for using php-code-coverage for report generation
Here is the rundown of the changes required in the test code:
- To get started the necessary classes (or namespaces) are imported to the current scope.
- An object of the coverage filter is created. The includeDirectory or includeFile method provided by the filter object is used for including the Directory or File on which the coverage has to be performed.
If there are multiple files in a directory and code coverage has to be performed against a single file, it is recommended to use includeFile with input argument as the location of the PHP file against which tests are performed.
- A new Driver object with Line Coverage applied on the filter that was created in the earlier step.
- A new object of class CodeCoverage is created which uses driver and filter objects for code coverage.
- The start (with input parameter as Test Name) and stop methods are respectively used for recording and stopping the code coverage operations.
- A new PHPUnit coverage report in HTML is generated using the process method of HtmlReport class. The process method takes two arguments – Coverage object and location to where Coverage reports will be generated.
|
1 2 3 4 |
use SebastianBergmann\CodeCoverage\CodeCoverage; use SebastianBergmann\CodeCoverage\Driver\Driver; use SebastianBergmann\CodeCoverage\Filter; use SebastianBergmann\CodeCoverage\Report\Html\Facade as HtmlReport; |
|
1 2 3 4 5 |
$filter = new Filter; /* Perform coverage at a directory level */ $filter->includeDirectory('\path\to\directory'); /* Perform coverage at a file level */ $filter->includeFile('\path\to\source-file\file.php'); |
|
1 |
$driver = Driver::forLineCoverage($filter); |
|
1 |
$coverage = new CodeCoverage($driver, $filter); |
|
1 2 3 |
$coverage->start('<name of test>'); /* Test implementation goes here */ $coverage->stop(); |
|
1 |
(new HtmlReport)->process($coverage, '\path\to\coverage report'); |
The steps (2 – 4) can be one-time operations by creating global objects of $filter, $driver, and $coverage classes. The process operation mentioned in step (6) can be performed only once for generating PHPUnit coverage report in HTML of the executed test scenarios.
Demonstration – Generation of code coverage report in PHP
The php-code-coverage module, an extension of PHPUnit, can use XDebug or PCOV, which facilitates code coverage functionality. For demonstrating the usage of php-code-coverage for code coverage analysis and reporting, we consider two test scenarios that are executed against different browsers (and OS combinations).
The test scenarios are tested on a local Selenium Grid installed on our Windows 10 machine. We have used Selenium Grid 3 (i.e., 3.141.59) for performing the tests. You can use the following command to start the Selenium Grid server:
|
1 |
java -jar selenium-server-standalone-3.141.59.jar |
Here are the test scenarios:
Test Scenario – 1 (Browser – Chrome, Platform – Windows 10)
- Navigate to the URL https://lambdatest.github.io/sample-todo-app/
- Select the first two checkboxes
- Send ‘Yey, Lets add it to list’ to the textbox with id = sampletodotext
- Click the Add Button and verify whether the text has been added or not
- Assert if the title does not match with the expected window title
Test Scenario – 2 (Browser – Firefox, Platform – Windows 10)
- Navigate to the URL https://www.google.com/ncr
- Locate the Search text box
- Enter ‘LambdaTest’ in the search box
- Click on the search button and assert if the title does not match with the expected window title
Directory Structure
We create separate ‘src’ and ‘tests’ folders where:
- src 🡪 Contains two PHP files (i.e., Search.php and Todos.php) that include the methods which will be used by the test files.
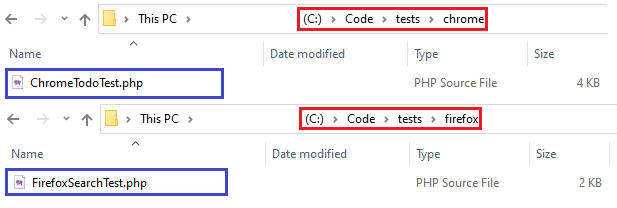
- tests 🡪 Contain test files (i.e., ChromeTodoTest.php and FirefoxSearchTest.php) stored in browser-specific folders (i.e., Chrome and Firefox), respectively.
Apart from these folders, composer.json, and phpunit.xml.dist are kept in the parent folder. Here is the overall folder structure:


Implementation
a. composer.json
The first step is the creation of composer.json in the root project folder for downloading the dependencies for the Selenium PHP project under development.
For validating the format of JSON can be validated by going to JSON Lint. Below are the projected dependencies that are listed in composer.json:
- PHP (version 7.1 or above)
- PHPUnit (version 9 or above)
- PHPUnit-selenium (latest version)
- PHP-WebDriver (version 1.8.0) – Selenium WebDriver library for automation with Selenium PHP
- Symphony (version 4.4) – Set of reusable PHP components and a PHP framework for building web applications, APIs, and microservices.
- phpunit/php-code-coverage (version 9.3 and above)
- pcov/clobber (version 2.0 and above)
For installing the dependencies mentioned in composer.json, run the command composer.require on the terminal and press Enter twice to proceed with the installation of the specified packages:
|
1 |
composer require |
Here is the screenshot of the terminal:

Upon completing the command execution, the file composer.lock and folder ‘vendor’ would be created in the project folder. Vendor contains all the downloaded packages and composer.lock contains detailed information on the dependencies.


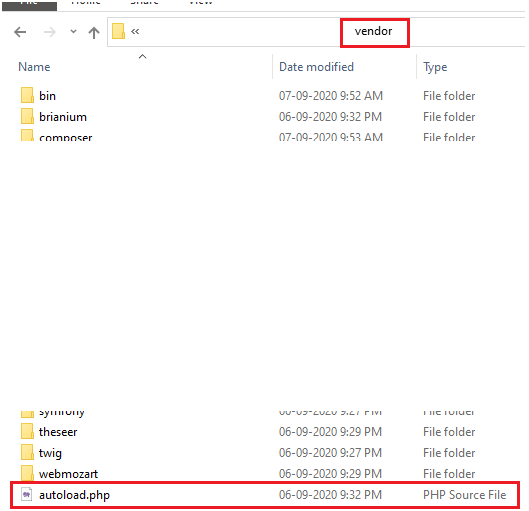
As seen above, the composer module has generated a vendor\autoload.php file. The file should be included in the PHP files that contain the test implementation so that the classes provided by those libraries can be used without putting extra efforts (in the code).
b. src\ Todos.php
Here is the code walkthrough of the essential parts in the implementation:
- The __construct() method is implemented, which is used to initialize the object’s properties upon the creation of the object. The $session variable is used in all the methods.
- Based on the requirements of the test scenario, appropriate methods are created which would be further used in the test code.
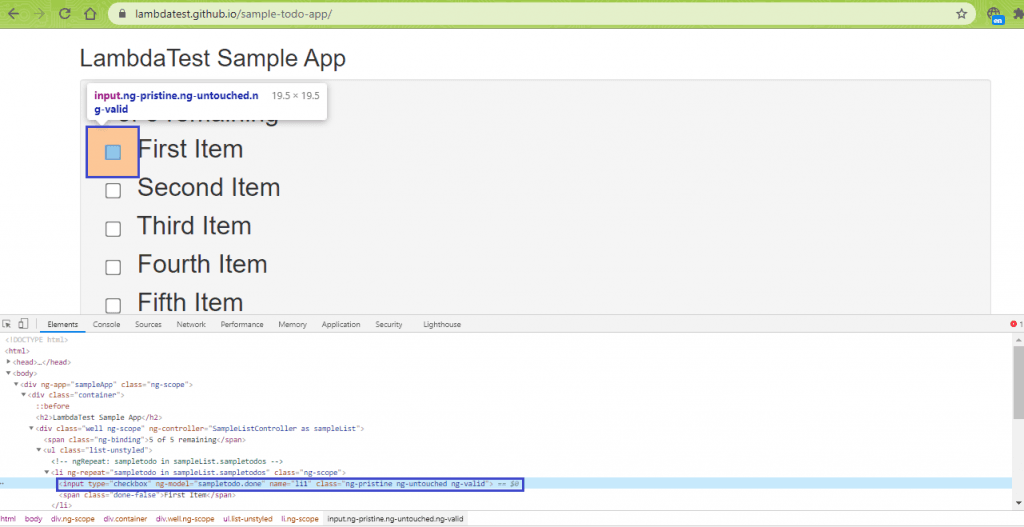
In ToggleLi1, the web element with the name ‘li1’ on https://lambdatest.github.io/sample-todo-app/ is located, and the a ‘click’ operation is performed. The methods are created based on the assumption that the ToDo app on LambdaTest is used as the web page under test.
The Inspect tool in the Chrome browser is used for getting information about the web element.
|
1 2 3 4 5 |
public function __construct($session) { $this->session = $session; $this->input = $session->findElement(WebDriverBy::id("addbutton")); } |
|
1 2 3 4 5 |
public function ToggleLi1() { $element1 = $this->session->findElement(WebDriverBy::name("li1")); $element1->click(); } |
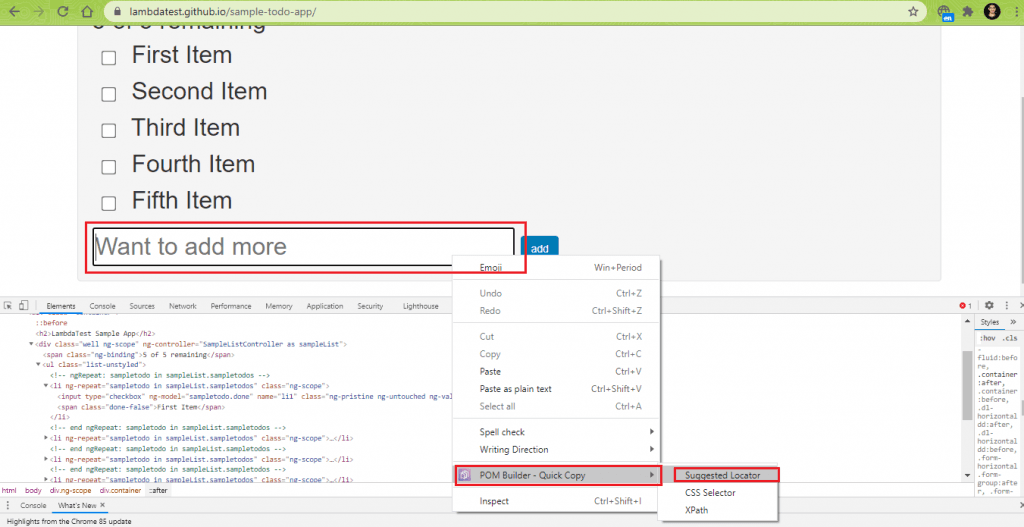
The same set of operations are also performed for elements with the name ‘li2’. For adding a new item in the ToDo list, the text box with ID ‘sampletodotext’ is located, and the sendKeys() method in Selenium is invoked for adding the new item in the list.
We used the POM Builder extension in Chrome to get details of the web element on the page.
|
1 2 3 4 5 6 |
public function addTodo($itemName) { $element = $this->session->findElement(WebDriverBy::id("sampletodotext")); $element->click(); $element->sendKeys($itemName . "\n"); } |
c. src\ Search.php
Here is the code walkthrough of the important parts of the implementation:
- The $session variable is used in the __construct function (or constructor), which is the ideal way for storing information (in variables) that would be used across multiple pages.
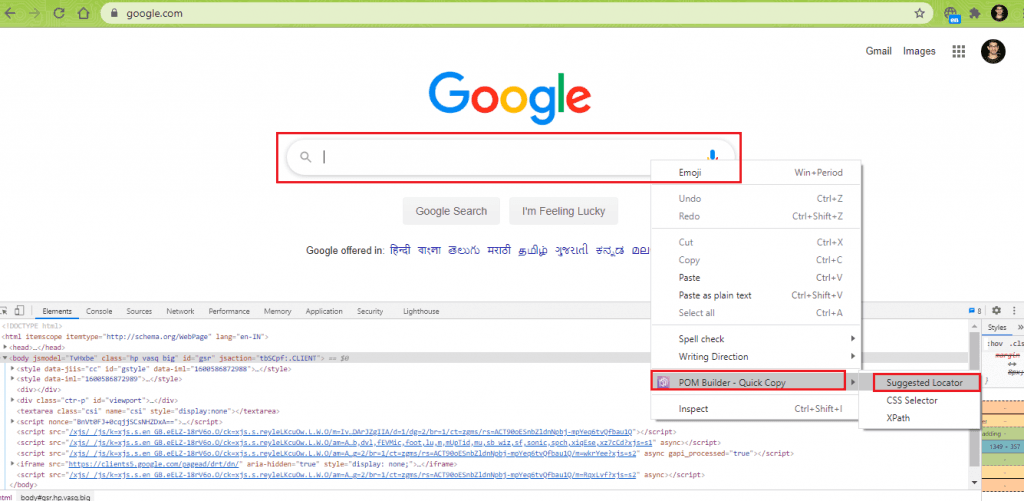
- Search box on the Google home-page is located using the ‘name’ property. The sendKeys Selenium method with input argument as ‘search string’ (which is passed from the test method) is used against the located web element.
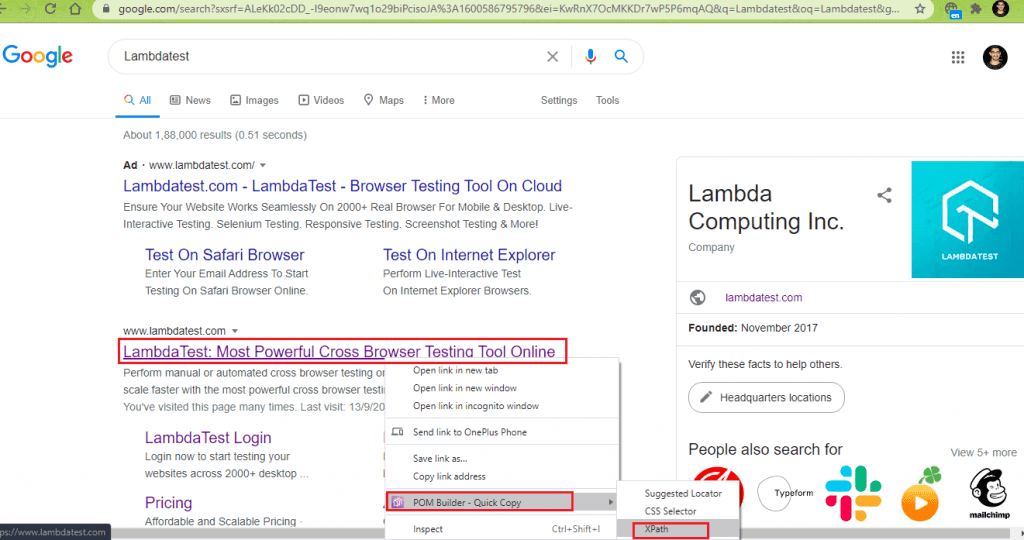
- In the ClickSearchResult method, the link with XPath as “//h3[.=’LambdaTest: Most Powerful Cross Browser Testing Tool Online’]” is located, and a click operation is performed.
|
1 2 3 4 5 |
public function __construct($session) { $this->session = $session; $this->input = $session->findElement(WebDriverBy::name("q")); } |
|
1 2 3 4 5 6 7 8 9 |
public function SearchonGoogle($search_string) { $element = $this->session->findElement(WebDriverBy::name("q")); $element->click(); if($element) { $element->sendKeys($search_string); $element->submit(); } } |
|
1 2 3 4 5 6 7 8 |
public function ClickSearchResult() { $element = $this->session->findElement(WebDriverBy::xpath("//h3[.='LambdaTest: Most Powerful Cross Browser Testing Tool Online']")); sleep(2); if($element) { $element->click(); } } |
d. tests\ ChromeTodoTest.php
Here is the code walkthrough that deep dives into the test code’s essential parts (used for running Test Scenario-1).
- Apart from importing classes and functions related to RemoteWebDriver, we import the classes related to the CodeCoverage module.
- A new filter object is created and the
includeFile()method of the Filter class is used for limiting the code coverage to the concerned PHP file (i.e. ToDos.php) - A new Driver object is created, and its method forLineCoverage() is applied on the filter object (i.e., Code coverage analysis will be based on line-coverage, and the ToDos.php is the file against which the coverage is calculated).
The CodeCoverage object is created, with driver and filter objects as the arguments.
- A global Boolean variable named ‘condition_comp’ is created, and it is set to true. The variable has other usage, as code coverage across the files can also be calculated without php-unit-coverage in the test code.
We would touch upon that aspect in subsequent sections.
- The test case ‘ChromeTodoTest’ extends the TestCase class, a part of the
PHPUnit\Framework\TestCasepackage. - The setUp() method contains the initialization related implementation regarding Selenium PHP automation.
The create method of RemoteWebDriver class is used for creating a new instance of the Chrome browser. The first argument of the method is the Selenium server address that has to be started before the tests are executed. In our case, the Selenium server is listening on port 4444 for any incoming requests (i.e., http://localhost:4444/wd/hub).
- The get method of RemoteWebDriver class is used for setting the target URL i.e. https://lambdatest.github.io/sample-todo-app/
A new object (i.e. todos) of Todos class is created with an input parameter as the webdriver object. - The test case testClickli1() tests the ToggleLi1() method (of Todos class). The start method of the $coverage object is invoked for starting the PHPUnit coverage report in HTML. The stop method of the $coverage object is invoked to stop the PHPUnit code coverage report for testClickli1().
- For every test case, the start() method of the coverage object is invoked to trigger the start of code coverage, and the stop() method is used for stopping the coverage for the particular test case.
In this test case, a non-blocking wait of 10 seconds is performed using wait(10,500), where the presence of the required web element is checked at a 500ms duration. The required web element count should return a non-zero value if that particular web element (i.e., Yey, Lets add it to list’) is present on the page.
- As this is the final test case, we need to process the PHPUnit HTML report. Hence, a new PHPUnit coverage HTML report is generated using the process method of HtmlReport class. Coverage object and location where coverage reports would be stored (relative to the root folder) are passed to the process method.
|
1 2 3 4 |
use SebastianBergmann\CodeCoverage\CodeCoverage; use SebastianBergmann\CodeCoverage\Driver\Driver; use SebastianBergmann\CodeCoverage\Filter; use SebastianBergmann\CodeCoverage\Report\Html\Facade as HtmlReport; |
|
1 2 |
$filter = new Filter; $filter->includeFile('absolute-path-toTodos.php'); |
|
1 2 |
$driver = Driver::forLineCoverage($filter); $coverage = new CodeCoverage($driver, $filter); |
|
1 |
$condition_comp = true; |
|
1 |
class ChromeTodoTest extends TestCase |
|
1 2 3 4 5 6 7 8 9 10 11 12 |
protected function setUp(): void { global $condition_comp; if ($condition_comp == true) { global $filter; global $driver; global $coverage; } $this->webDriver = RemoteWebDriver::create('http://localhost:4444/wd/hub', DesiredCapabilities::chrome()); ................................................. ................................................. } |
|
1 2 3 4 |
$this->webDriver->get('https://lambdatest.github.io/sample-todo-app/'); ................................................. ................................................. $this->todos = new Todos($this->webDriver); |
|
1 2 3 4 5 6 7 8 9 10 11 12 13 14 |
public function testClickli1() { global $condition_comp; if ($condition_comp == true) { global $coverage; $coverage->start('testClickli1'); } $this->todos->ToggleLi1(); ................................................. ................................................. if ($condition_comp == true) { $coverage->stop(); } } |
|
1 2 3 4 5 6 7 8 9 10 11 12 13 14 15 16 17 18 19 20 21 22 23 |
/** * @covers Todos::addTodo */ public function testAddToList() { global $condition_comp; if ($condition_comp == true) { global $coverage; $coverage->start('testAddToList'); } $itemName = 'Yey, Lets add it to list'; $this->todos->addTodo($itemName); $this->webDriver->wait(10, 500)->until(function($driver) { $elements = $this->webDriver->findElements(WebDriverBy::cssSelector("[class='list-unstyled'] li:nth-child(6) span")); return count($elements) > 0; }); ................................................. ................................................. if ($condition_comp == true) { $coverage->stop(); (new HtmlReport)->process($coverage, 'code-coverage-report\report'); } } |
|
1 2 3 4 5 6 7 8 9 10 11 12 13 14 |
public function testAddToList() { global $condition_comp; if ($condition_comp == true) { global $coverage; $coverage->start('testAddToList'); } ................................................. ................................................. if ($condition_comp == true) { $coverage->stop(); (new HtmlReport)->process($coverage, 'code-coverage-report\report'); } } |
e. tests\ FirefoxSearchTest.php
Here is the code walkthrough of the test implementation used for running Test Scenario-2.
- Along with including autoload.php from the vendor folder, we also include the PHP file (i.e., Search.php) whose methods would be used in the test code.
- An instance of the Firefox browser is invoked in the setUp method, and the URL is set to https://www.google.com.
- A new object of the Search class is created and a webdriver object is used as the input argument.
- The ClickSearchResult() method, which was implemented in the Search class, is tested here.
The test code contains only one test case, i.e., testSearchResult(). Hence, start and stop methods of code coverage object and the test code report’s processing is done in this method.
- The quit method of RemoteWebDriver is invoked for closing the instance of the web browser.
|
1 2 |
require 'vendor/autoload.php'; require 'src/Search.php'; |
|
1 2 3 4 5 6 7 |
protected function setUp(): void { $this->webDriver = RemoteWebDriver::create('http://localhost:4444/wd/hub', DesiredCapabilities::firefox()); $this->webDriver->get('https://www.google.com'); ................................................. ................................................. } |
|
1 |
$this->search = new Search($this->webDriver); |
|
1 2 3 4 5 6 7 8 9 10 11 12 13 14 15 16 17 |
public function testSearchResult() { global $condition_compl; if ($condition_compl == true) { global $coverage_t; $coverage_t->start('testSearchResult'); } $this->search->SearchonGoogle("LambdaTest"); sleep(2); $this->search->ClickSearchResult(); sleep(2); $this->assertEquals('Most Powerful Cross Browser Testing Tool Online | LambdaTest', $this->webDriver->getTitle()); if ($condition_compl == true) { $coverage_t->stop(); (new HtmlReport)->process($coverage_t, 'code-coverage-report\report'); } } |
|
1 2 3 4 |
public function tearDown(): void { $this->webDriver->quit(); } |
f. phpunit.xml.dist
As we have to invoke multiple test cases, we compose a test suite using XML configuration.
Between the <directory> tags, we include the location of the directory that contains the source implementation. In our case, it is src.
|
1 2 3 4 5 |
<coverage> <include> <directory suffix=".php">src</directory> </include> </coverage> |
The respective tests are added between the <testsuite> tags, and those are further enclosed between the <testsuites> tags. As we have two test cases, the implementation is located in different folders (i.e., tests/chrome/ChromeTodoTest.php and tests/firefox/FirefoxSearchTest.php), both would be stored under different <testsuite> tags. The details under <directory> tag indicate the source files’ location (i.e., src/Todos.php, src/ Search.php) so that coverage is calculated only against those files. If this is not done, the coverage is calculated against all the source files, and the coverage percentage would be incorrect.
|
1 2 3 4 5 6 7 8 9 10 |
<testsuites> ................................................. ................................................. <testsuite name="chrome"> <file>src/Todos.php</file> <directory>tests/chrome</directory> </testsuite> ................................................. ................................................. <testsuites> |
Execution
For executing the test cases, invoke the following command on the terminal:
|
1 |
vendor\bin\phpunit |
We have not passed the directory details where the PHPUnit coverage HTML reports would be stored, as the directory details were already implemented using phpunit/php-code-coverage package methods.
Here is the terminal screenshot, which indicates that the tests have been successfully executed.

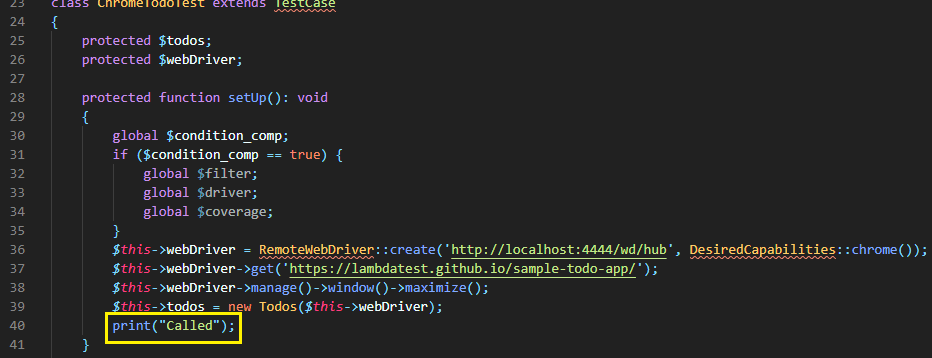
The PHPUnit framework invokes a new browser instance for each test case. Since tests\ChromeTodoTest.php comprises three test cases i.e. testClickli1(), testClickli2(), and testAddToList(); hence a fresh Chrome browser instance is invoked for every test case. Hence, we have the log under setUp (i.e., Called) is printed thrice on the terminal
The PHPUnit coverage HTML reports are available in the newly created directory – code-coverage-report.
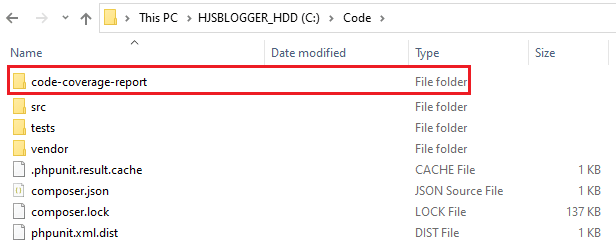
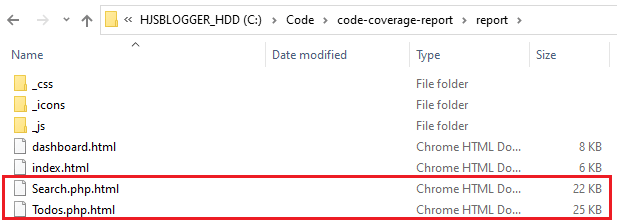
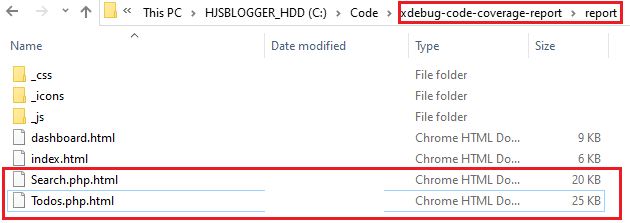
Two reports named Search.php.html and Todos.php.html are created in the code coverage directory.
As seen in the PHPUnit HTML report contents, the test cases were instrumental in testing all the individual source files’ methods.
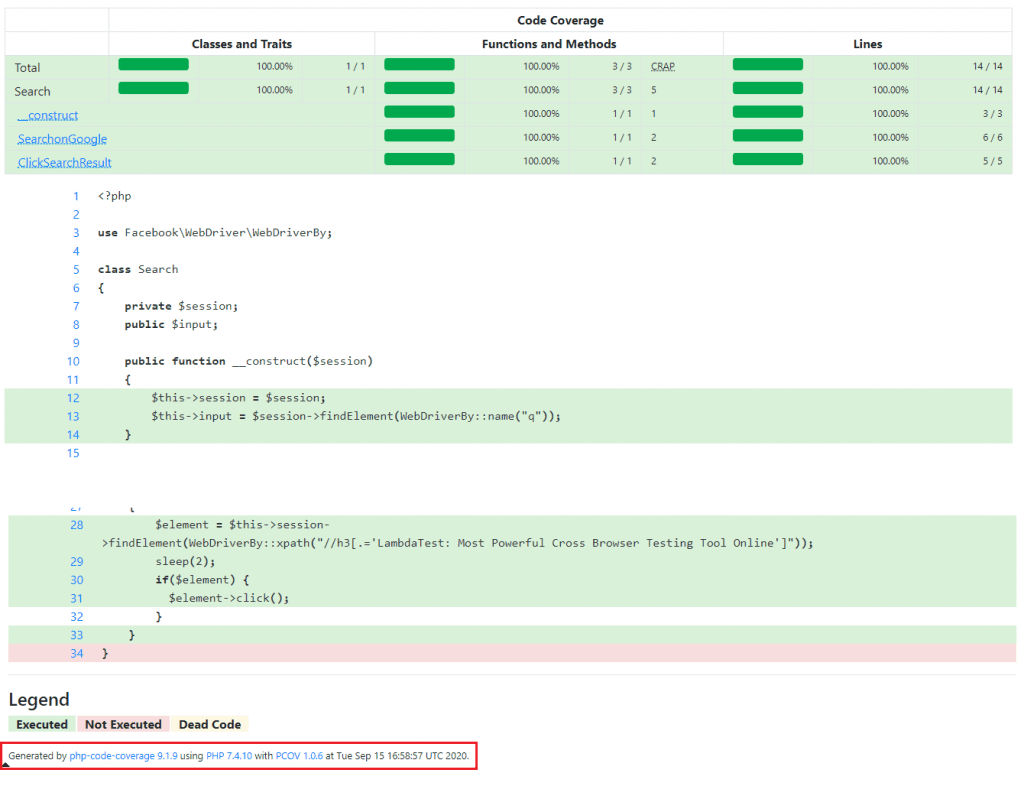
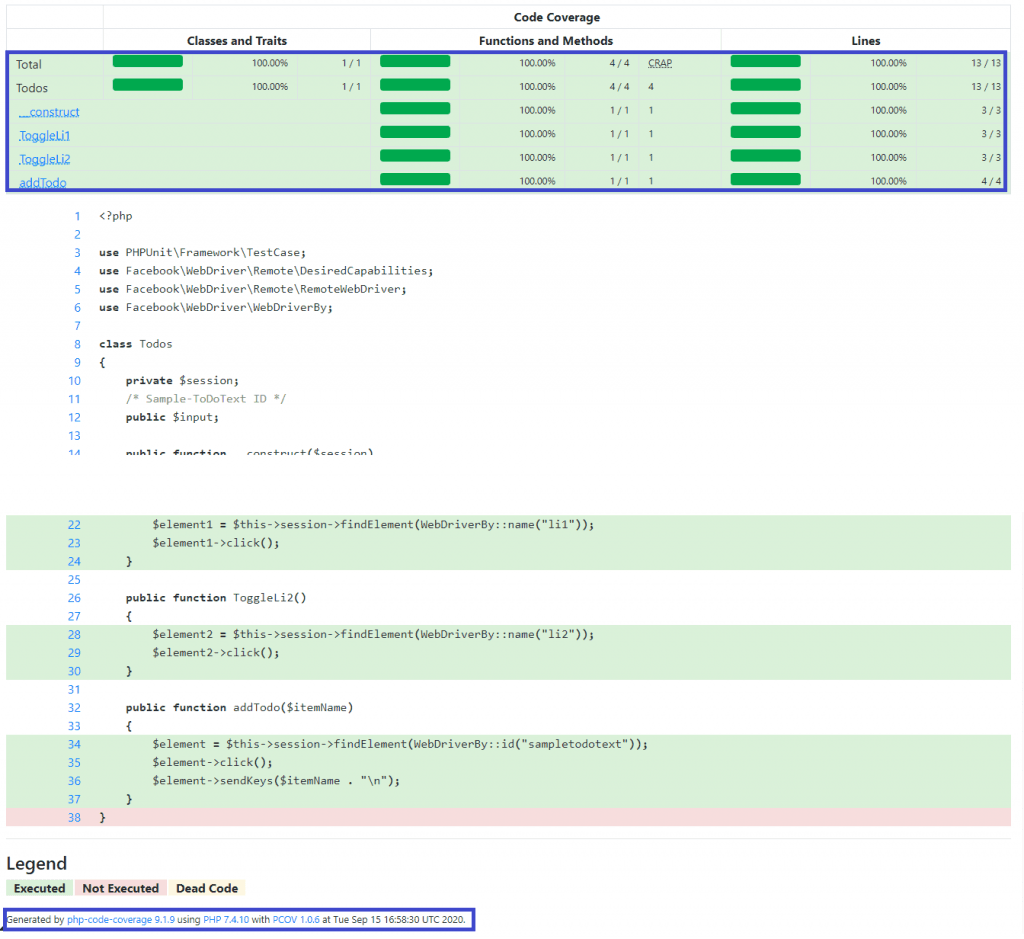
We have obtained 100 percent code coverage, and the same is reflected in the test reports. As seen at the bottom of the reports, php-code-coverage used PCOV for performing code coverage.

Since we have enabled the PCOV extension in php.ini, hence it is used by php-code-coverage.

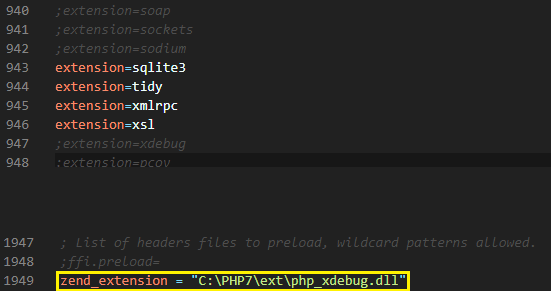
It is important to note that PCOV and Xdebug cannot be used simultaneously. Hence, one extension should be disabled in php.ini when the other one is used. For using php-code-coverage with Xdebug, we disable the PCOV extension and keep the entry titled zend_extension enabled in the file.

Here is the report snapshot after php-unit-coverage uses Xdebug. As indicated in the report footer, Xdebug 2.9.6 was used for code coverage report generation.
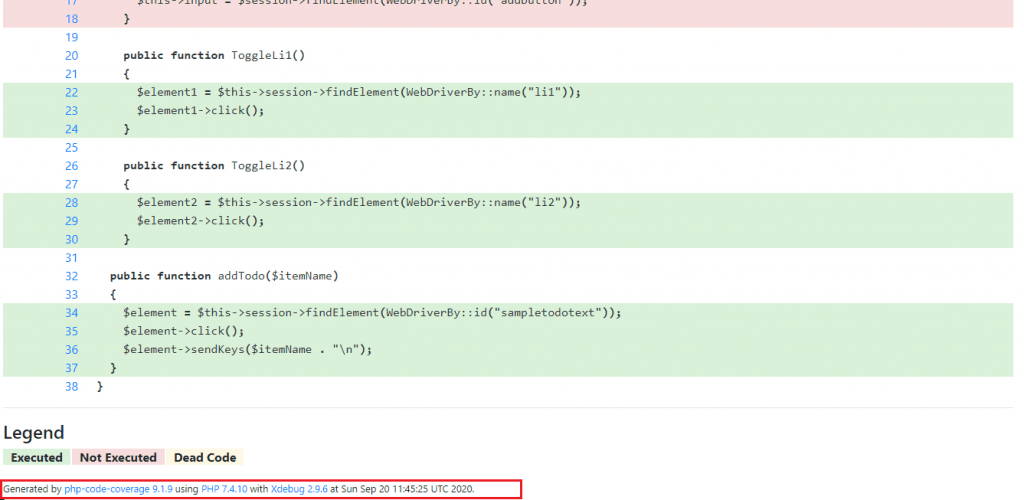
Our recommendation is to use phpunit/php-code-coverage with PCOV instead of Xdebug extension.
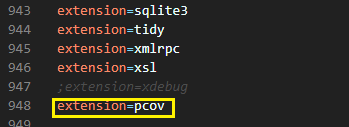
PHPUnit code coverage report using PCOV and Xdebug
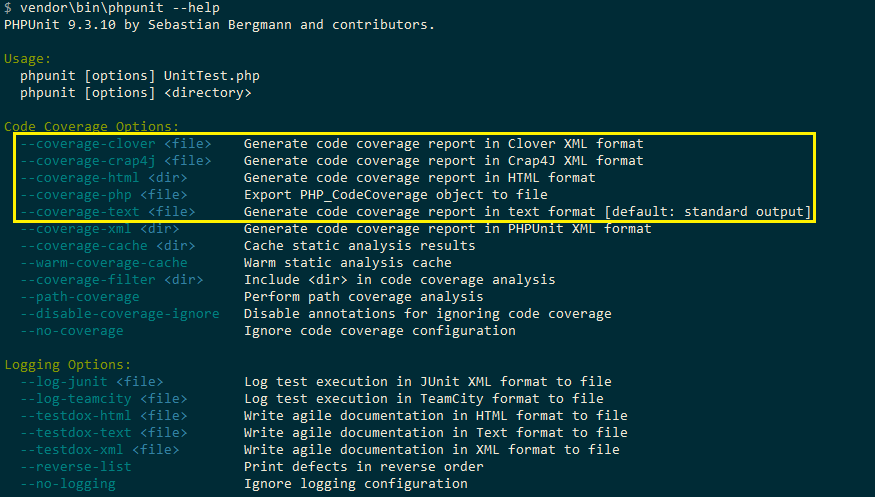
The advantage of using phpunit/php-unit-coverage for code coverage is that you selectively use it for performing code coverage on a ‘selected set of files.’ However, the –coverage-html option offered by PHPUnit can also be used for getting code coverage. Xdebug or PCOV should be enabled in php.ini for using this option. No changes in the test code are required. Apart from HTML format, code coverage reports can be generated in text, Clover XML, and Crap4J XML formats.
PHPUnit Test Coverage Reports using Xdebug
We disable the PCOV and enable support for Xdebug in php.ini
For performing code coverage on the existing test code, we disable the support for php-unit-coverage in the test files. The Boolean variable condition_comp is set to false to disable the support for php-unit-coverage.
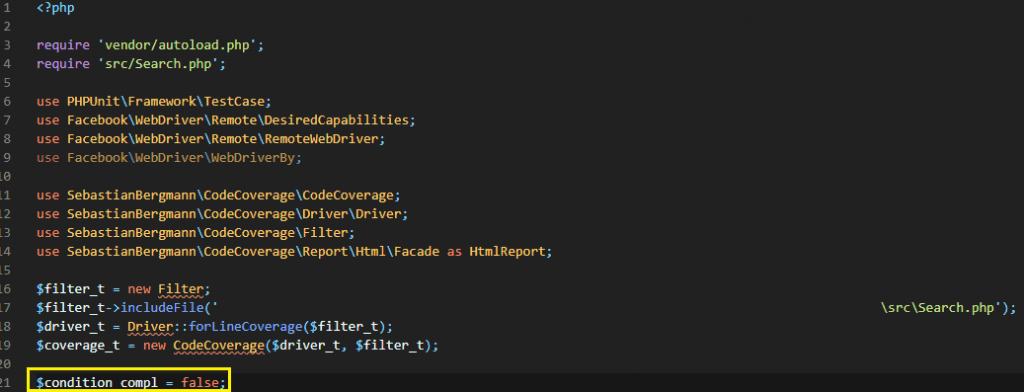
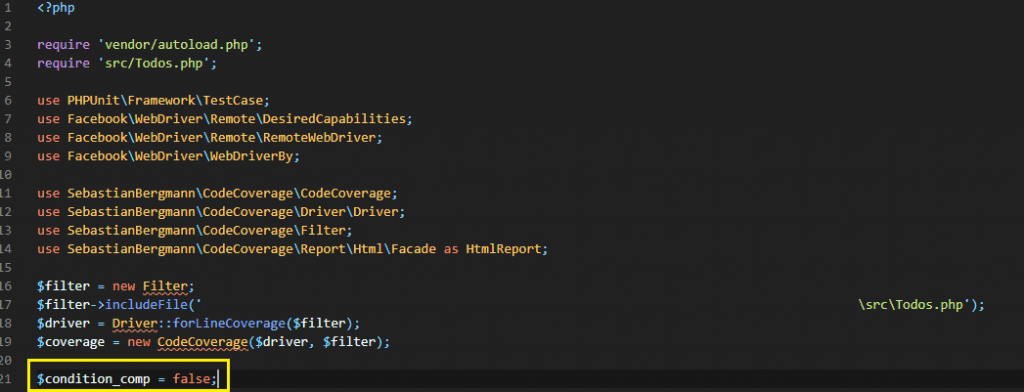
Run the following command on the terminal:
|
1 |
vendor\bin\phpunit --coverage-html xHTML |
where xHTML is the directory where test reports are generated.
Here is the execution snapshot:

As seen in the report snapshot of ToDo tests, the Xdebug extension was used for profiling and code coverage.
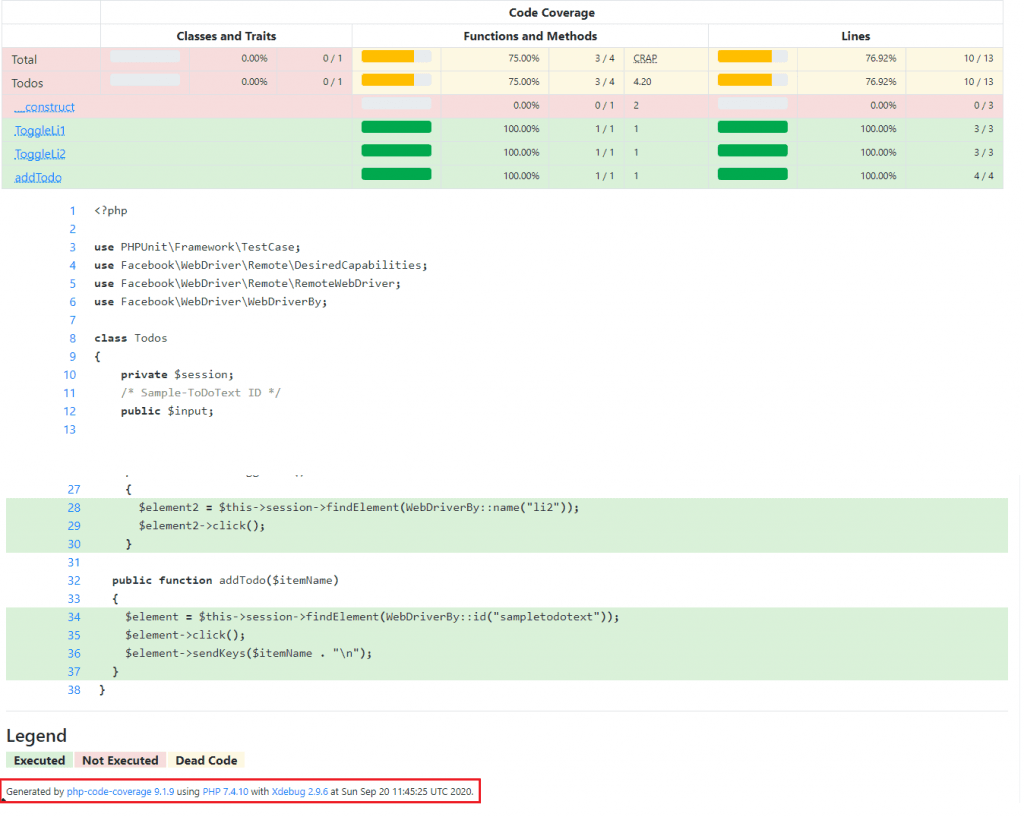
Separate PHPUnit code coverage report is generated for the tests executed using the Xdebug extension.
PHPUnit Test Coverage Reports using PCOV
We disable Xdebug and enable support for PCOV in php.ini
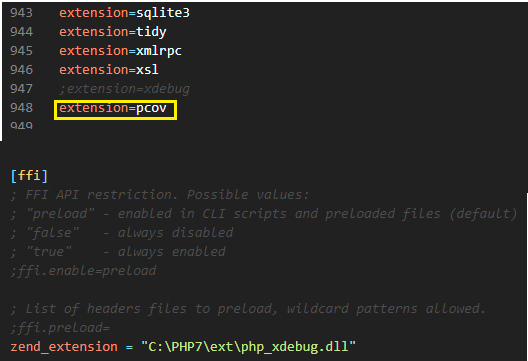
Run the following command on the terminal:
|
1 |
vendor\bin\phpunit --coverage-html pHTML |
where pHTML is the directory where code coverage reports are generated.
Here is the execution snapshot:

As seen in the report snapshot, the PCOV extension was used for profiling and code coverage.
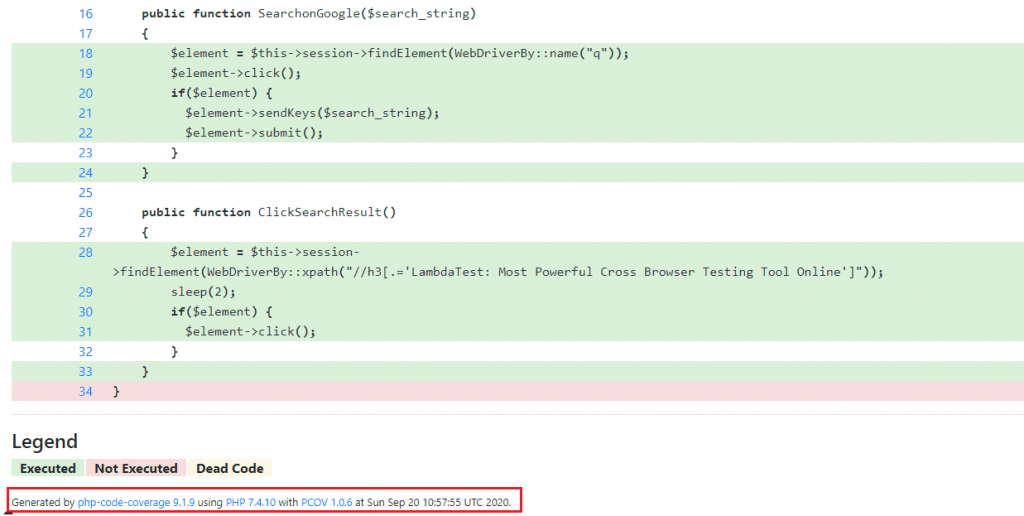
Separate PHPUnit code coverage report is generated by PCOV 1.0.6:

However, we personally recommend using phpunit/php-code-coverage instead of the non-programmatic options provided by Xdebug and PCOV.
PHPUnit code coverage report on Cloud-based Selenium Grid
When using PHPUnit on a local Selenium Grid, the Selenium Grid Server has to be started up and the browser binaries have to be made available on that machine.
Testing and reporting on a local Selenium Grid is not scalable, as it becomes a daunting task to perform testing on different browsers and old browser versions. The respective browsers and their corresponding browser binaries have to be downloaded to that system.
Instead, using PHPUnit on a cloud-based Selenium Grid like LambdaTest lets you perform testing and reporting on close to 2,000+ real browsers & operating systems online. Porting the existing code that generates PHPUnit code coverage report from a local Selenium to a cloud-based Selenium Grid requires minimal changes.
After creating an account on LambdaTest, keep a note of the user-name & access-key available on the profile page since the combination would be used for accessing the resources on the Grid on LambdaTest. For the test scenarios 1 & 2, generate the browser capabilities using LambdaTest browser capabilities generator.
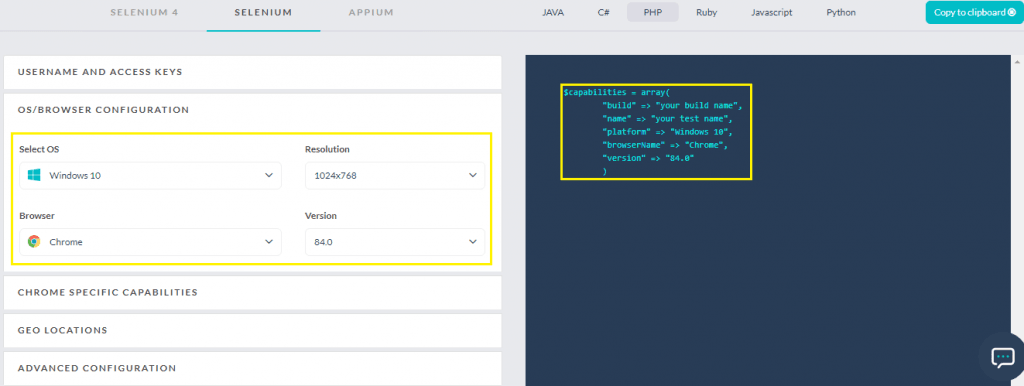
After generation of browser capabilities, we port the existing implementation that demonstrates reporting on local Selenium Grid to LambdaTest’s cloud-based Grid (i.e., only infrastructure-related changes in tests are made).
For reporting, we used php-code-coverage hence, the global variable $condition_compl is set to True.
As seen in the code snippet, capabilities that have been generated using the LambdaTest capabilities generator are used for testing. The combination of user-name and access-key, which are stored in global variables, is used for accessing the LambdaTest Grid [@hub.lambdatest.com/wd/hub]
We have marked the code changes for the ToDo test conducted on Chrome below.
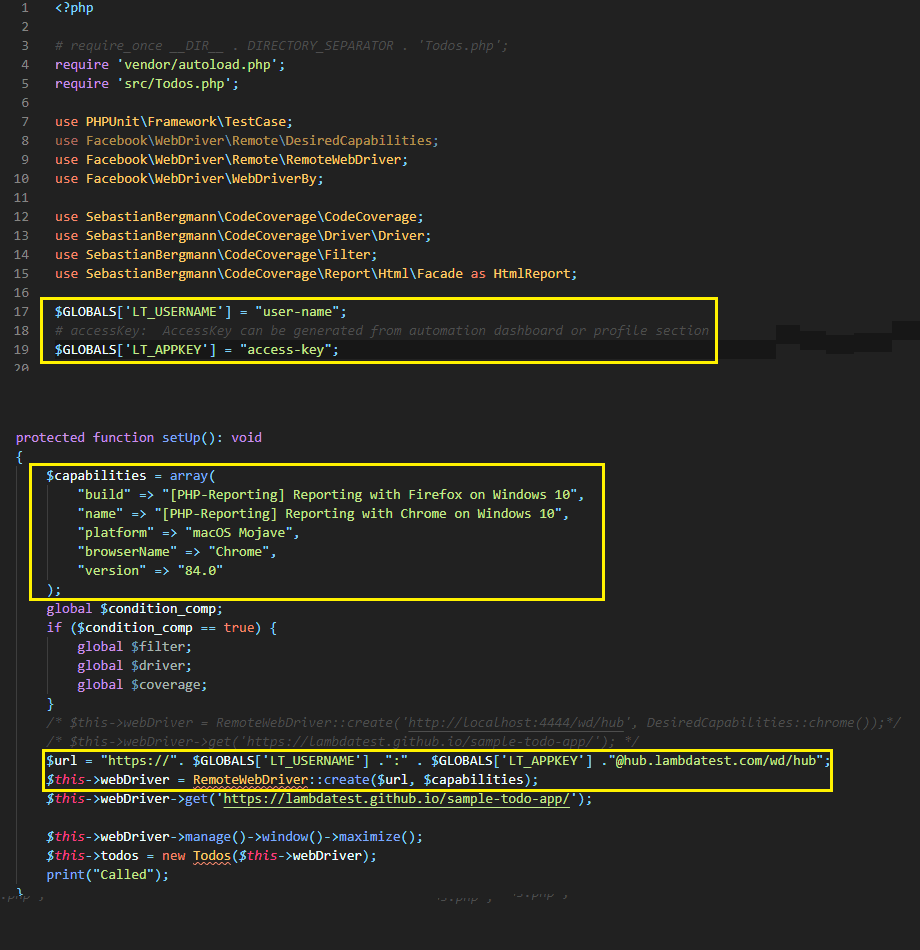
Run the following command for executing the tests:
vendor\bin\phpunit
As seen in the execution screenshot obtained by accessing the Automation tab on LambdaTest, it is clear that four tests (in total) were executed on the Grid.

If you are a PHP expert, you can acquire a benchmark industry certification specializing in core PHP programming skills and expand your opportunities to advance your career in PHP automation testing.
It’s a Wrap

PHPUnit code coverage reports come extremely handy as they give detailed information about code coverage. This helps in optimizing the test code in a manner that the code coverage is optimum. Xdebug and PCOV are the two widely used extensions for code coverage analysis.
For creating a PHPUnit coverage report in HTML, the php-code-coverage module that is spun out from PHPUnit and extends Xdebug and PCOV should be used. Using PCOV and Xdebug for code coverage does not involve implementation changes. It is recommended to use php-code-coverage as there is better control over the test report generation.
For attaining better code coverage while using cross browser testing, it is recommended to shift the testing process to a cloud-based Selenium Grid. When moving to the cloud-based Grid, no changes are involved in the reporting mechanism, and minimal changes are involved in the test code.
Frequently Asked Questions
What is the difference between code coverage and test coverage?
Code coverage refers to the measure of code covered or executed throughout the testing process. Whereas, Test coverage refers to the measure of features covered or tested throughout testing.
What is acceptable code coverage?
The acceptable amount of code coverage is directly proportional to the failure cost of the project. If the failure cost is quite high, the acceptable amount of code coverage should be around 90-100%. Normally, for most of the projects, the acceptable code coverage is targeted at 70-80%.
Is 100 percent code coverage possible?
100 percent code coverage is the ideal case. Though every project should target for 100% code coverage, it might not be possible in the real world. Normally, the code coverage is kept based on the failure cost of the project.
Got Questions? Drop them on LambdaTest Community. Visit now


