
Learn To Debug JavaScript Using Chrome Debugger
Tanay Kumar Deo
Posted On: October 10, 2023
![]() 50363 Views
50363 Views
![]() 15 Min Read
15 Min Read
For any front-end developer, finding and fixing errors in the code can be extremely difficult sometimes because of incoming unexpected data from the server and uncertain user interactions. Modern browsers have a JavaScript debugging tool to debug errors in the code.
Google Chrome, one of the most popular browsers, is still catching up in this feature and has one of the best JavaScript debugging tools called Chrome Debugger (also called Chrome Developer Tools). Developers can leverage this Chrome debugger to see what their JavaScript is doing in real time as they move around the screen. They can view console logs, set breakpoints, check variable values, inspect network-related activity, analyze and optimize memory usage, and audit certificated and website SEO.
This article seeks to clarify the process of using the Chrome debugger tool to debug JavaScript source code.
TABLE OF CONTENTS
- What is Chrome Debugger?
- JavaScript Debugging with Chrome Debugger
- How to Put Breakpoints in JavaScript using Chrome Debugger
- How to Debug Javascript using console.log
- Some Common Challenges of JavaScript and its Solutions
- Advanced JavaScript Debugging Using Cloud Based Tools
- frequently asked question
What is Chrome Debugger?
Chrome Debugger, a JavaScript debugging tool enabled via the Chrome DevTools. It is a built-in suite of tools within the Chrome browser that offers a wide range of functionality for web development and debugging.
To enable the debugger, developers may use the following three methods:
- The easiest one is using keyboard shortcuts i.e. Ctrl + Shift + J in Windows and cmd + Option + J in Mac.
- Open the browser menu by clicking on the three dots in the upper right corner, scroll down to the “More tools” option, and select the “Developer tools” option.
- Right-click on the web page to debug and click on the “Inspect” option.
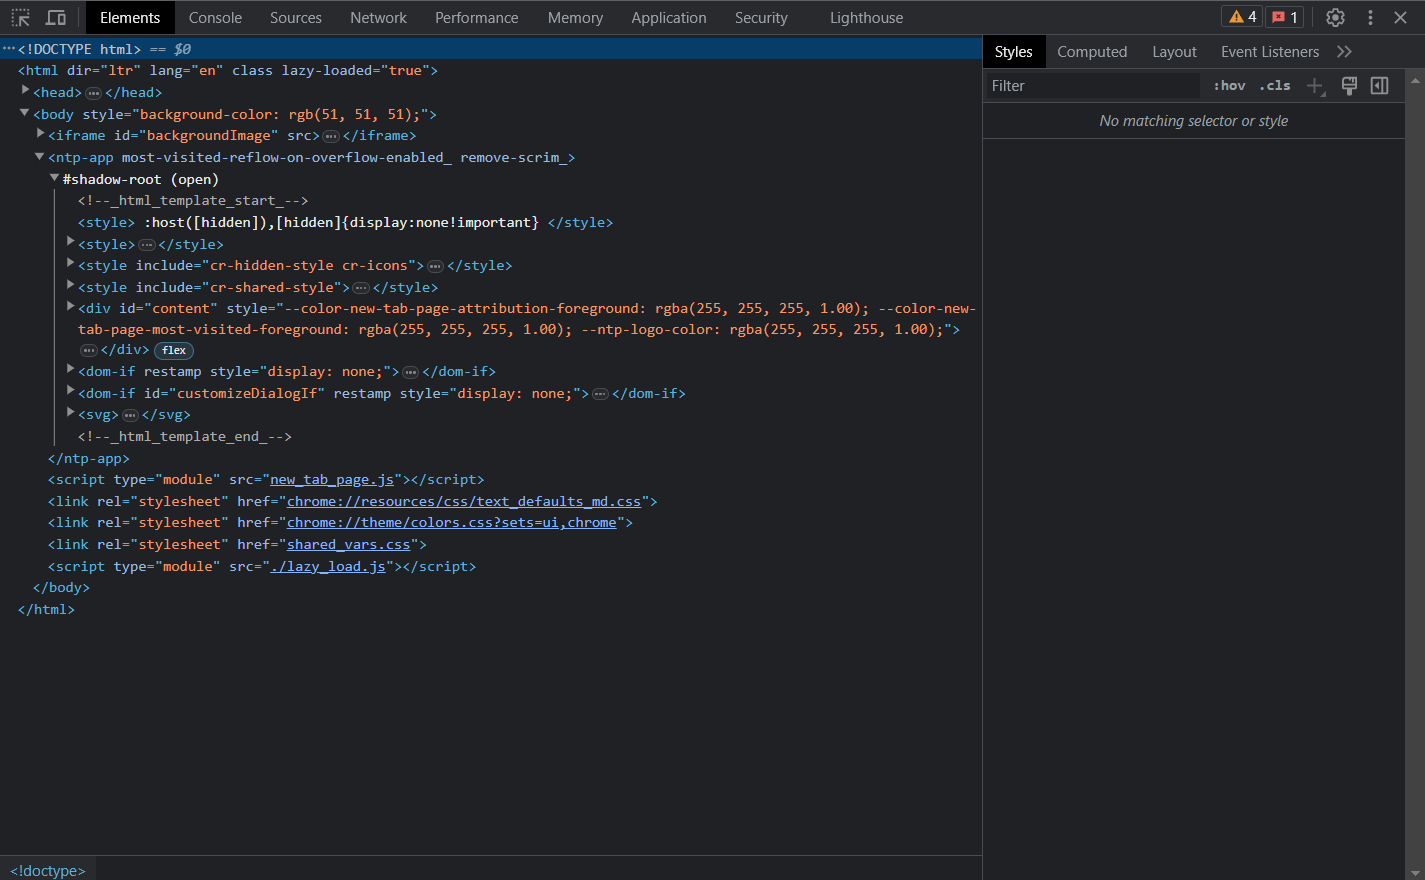
As you can see in the above image, the Chrome debugger has nine panels. All these panels are responsible for different debugging tasks. Here is a quick summary of what each panel is mainly responsible for.
- Elements: It can be used to inspect and edit DOM elements and style attributes.
- Console: Mainly responsible for viewing logs and executing JavaScript code.
- Sources: Used to debug JavaScript, edit JavaScript, add breakpoints, etc.
- Network: Responsible for viewing and debugging network-related activities.
- Performance: Used to analyze the speed and optimization of the web page.
- Memory: Assists in tracking memory usage and fixing memory-related issues.
- Application: It is used to inspect cookies, localStorage, sessionStorage, IndexDB, and any other local database.
- Security: Used to debug certificates and other security problems.
- Lighthouse: It audits the web app/website’s SEO, performance, quality, accessibility, etc.
Subsequently, we will focus primarily on the console and sources panel as they are responsible for debugging in JavaScript.
JavaScript Debugging with Chrome Debugger
Let’s look at some helpful JavaScript debugging strategies to debug JavaScript code more effectively and how to achieve that using the Chrome debugger.
The sources and the console panel are primarily responsible for JavaScript debugging using breakpoints and log statements. So let’s get started with the sources panel and understand how it works.
The Sources Panel
The sources panel is where developers can view source code or bundle output. It is the main panel we use for JavaScript debugging. Here we can view our source files to set up multiple breakpoints, watch variables, and perform the majority of debugging. It has a file tree that we can use to navigate through various files of the source code. We can open the sources panel by clicking the sources tab in the Chrome debugger.
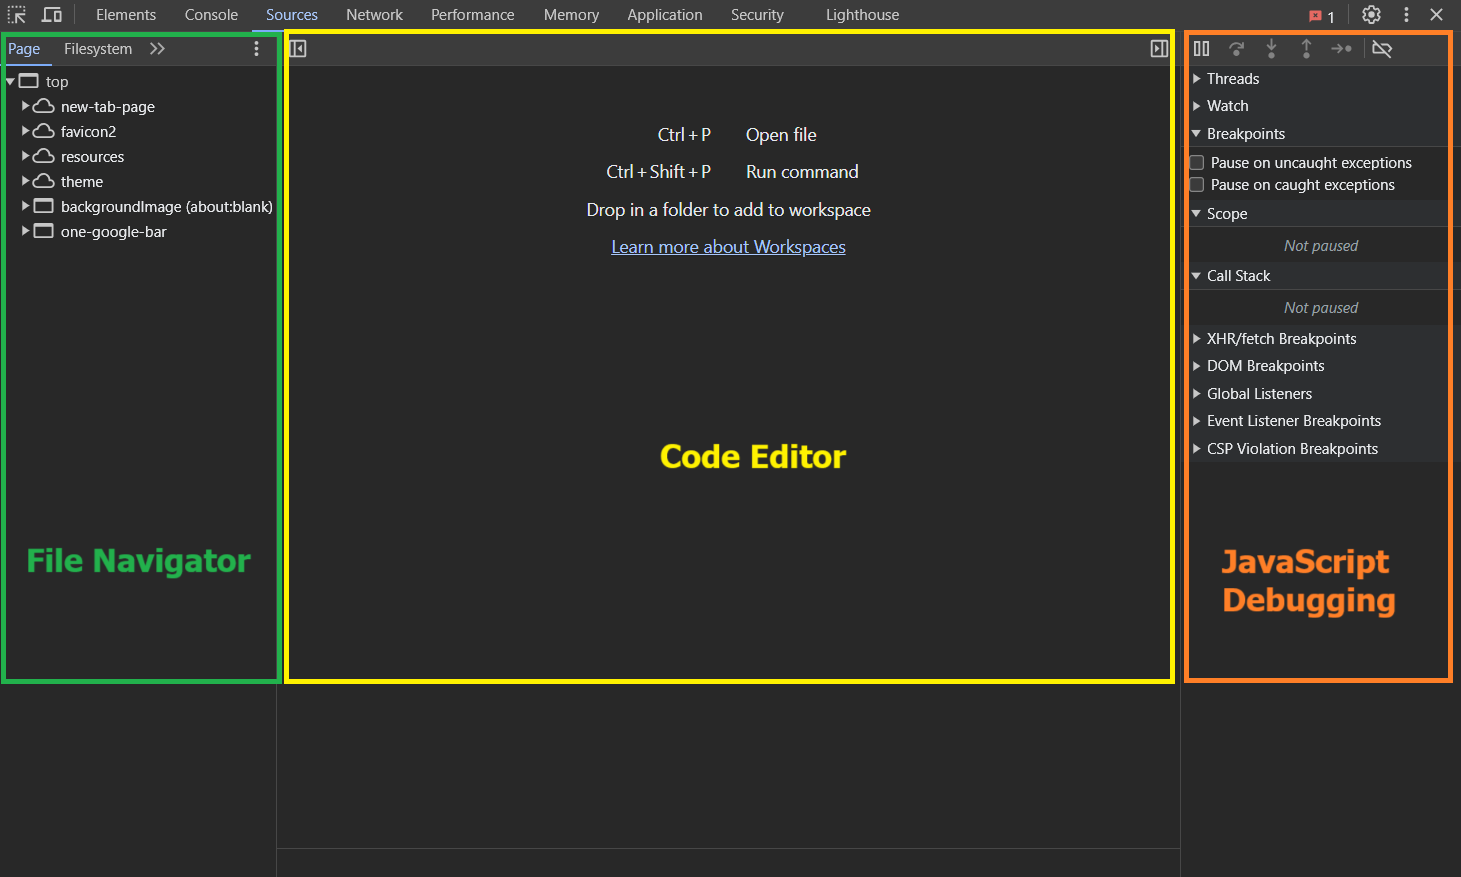
As shown in the image above, the Sources panel has three primary components.
- On the left we have the File Navigator pane, it lists a file tree of the source code including HTML, JavaScript, CSS, and other files, including assets that are attached to the page. Chrome extensions’ files may also appear here.
- In the center, we have the Code Editor pane, which displays the source code for the file chosen from the File Navigator.
- On the right we have the JavaScript Debugging pane, which is mainly for debugging the JavaScript code, we’ll explore it soon.
The Console Panel
The console panel of the Chrome debugger is mainly used to write JavaScript programs and run them. We can also see the log output created by our website in this panel. To open the console panel, we can click on the console tab in the debugger.
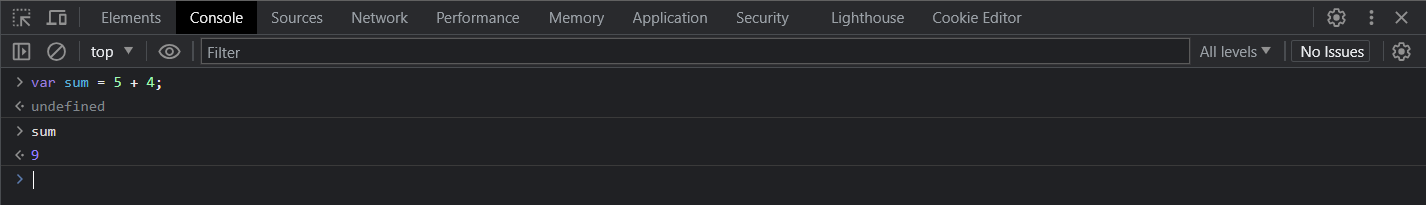
In the image above, we can execute JavaScript statements. This comes in handy while debugging the JavaScript code.
 Note
NoteAchieve unparalleled speed in debugging. Try LambdaTest Today!
How to Put Breakpoints in JavaScript using Chrome Debugger
We’ll examine a practical illustration of setting breakpoints in the source panel to debug JavaScript. So let’s first look at an example webpage with a bug before continuing with the debugging. Here, we’ll look at an illustration of a simple interest-based loan amount calculator.
Given below is the HTML/CSS and JS code for the simple interest loan calculator.
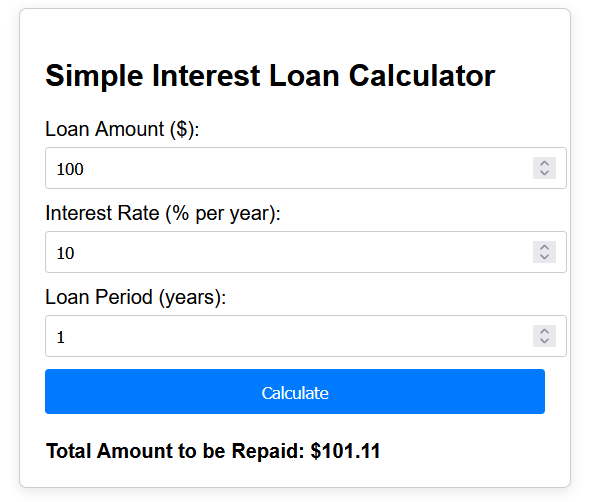
For the image shown above, with input values – principal = $100, rate of interest = 10%, and time = 1 year, the calculator produces $101.11, which is a wrong answer and must show $110 instead.
This implies that our JavaScript code for calculating loan amounts has a bug. Let’s try to fix this issue using the Chrome debugger. For proper JavaScript debugging, we can follow the below steps:
Step 1: Produce the Bug
The first and foremost step in JavaScript debugging is to perform some operations and produce the bug that we need to fix. We already completed this step with the data shown above.
Step 2: Add BreakPoints
A breakpoint is an intended stopping point in our code’s execution. This is the point in a code’s execution where the developer intends to pause the code and inspect the content of the related variables and other properties.
In our example of the loan calculator, it is evident that the calculated loan amount becomes inaccurate after clicking the Calculate button. Therefore, we need to check if the JavaScript code is calculating correctly.
To do this, we must set a breakpoint before the code calculates the loan amount. Doing this will help us analyze the values of all specified variables up to the fixed breakpoint.
There are several types of breakpoints we can set in our code. Let’s take a quick look at them:
- Line-of-code – When we need our code to pause on an exact point in our code.
- Conditional – This is useful when code should pause on an exact point in our code but only if a defined condition evaluates to true.
- DOM – It pauses the program at a point in a code block that alters a specific DOM node.
- Event Listener -It is used to pause the program at a point in a code block that executes after an event is triggered.
- Function – It pauses the program whenever a function is called.
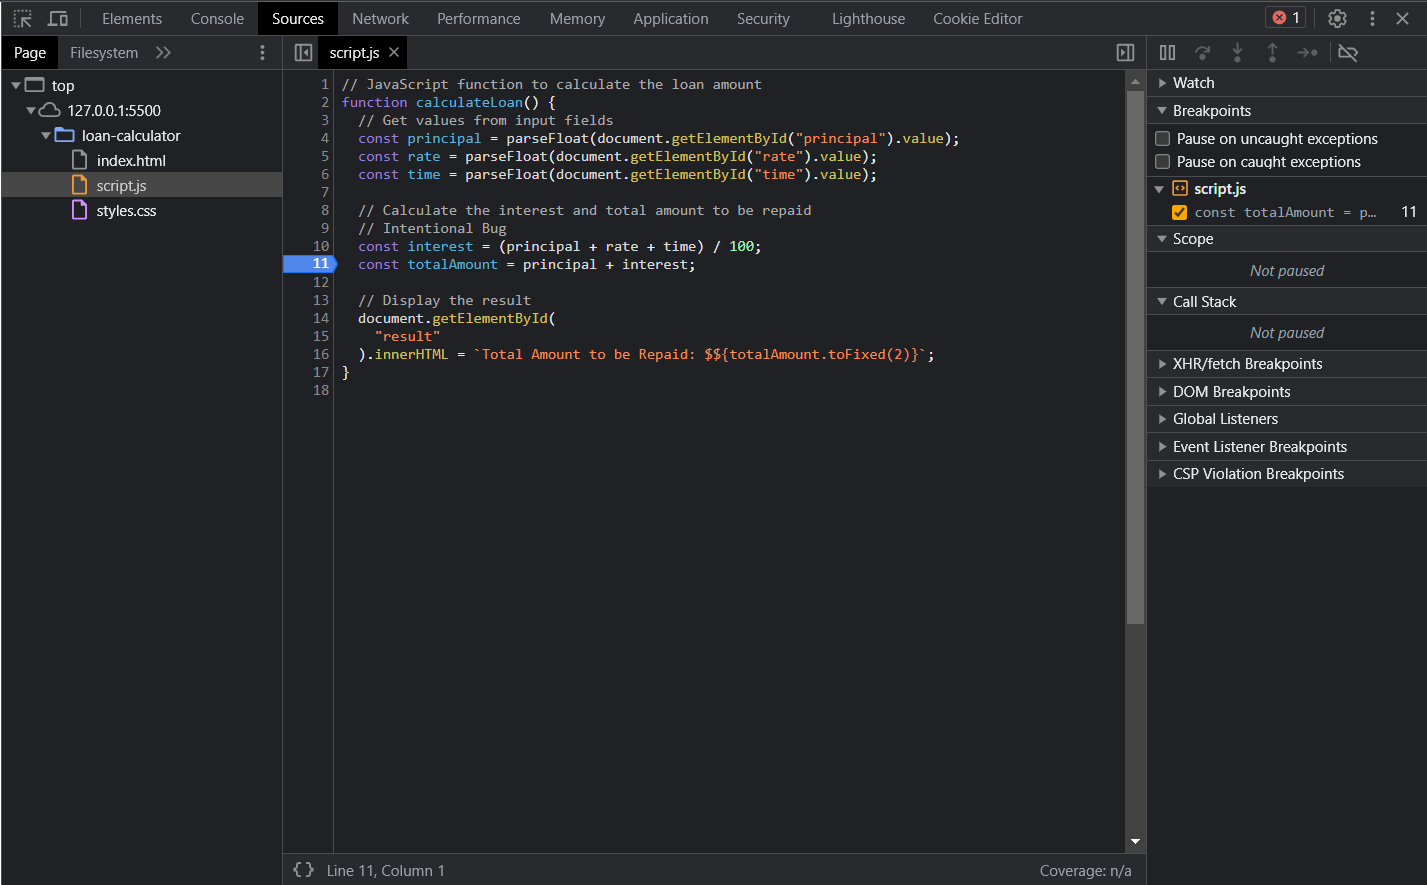
Now that we have clearly understood the breakpoints, let’s get a hands-on experience by using it in our example to debug the code. Here, we are going to use a “line-of-code” breakpoint and set it at line number 11. Follow the steps to do so:
- Open Chrome Debugger and go to the Sources tab
- Go to the File Navigator pane and choose script.js to open the code inside it in the code editor pane.
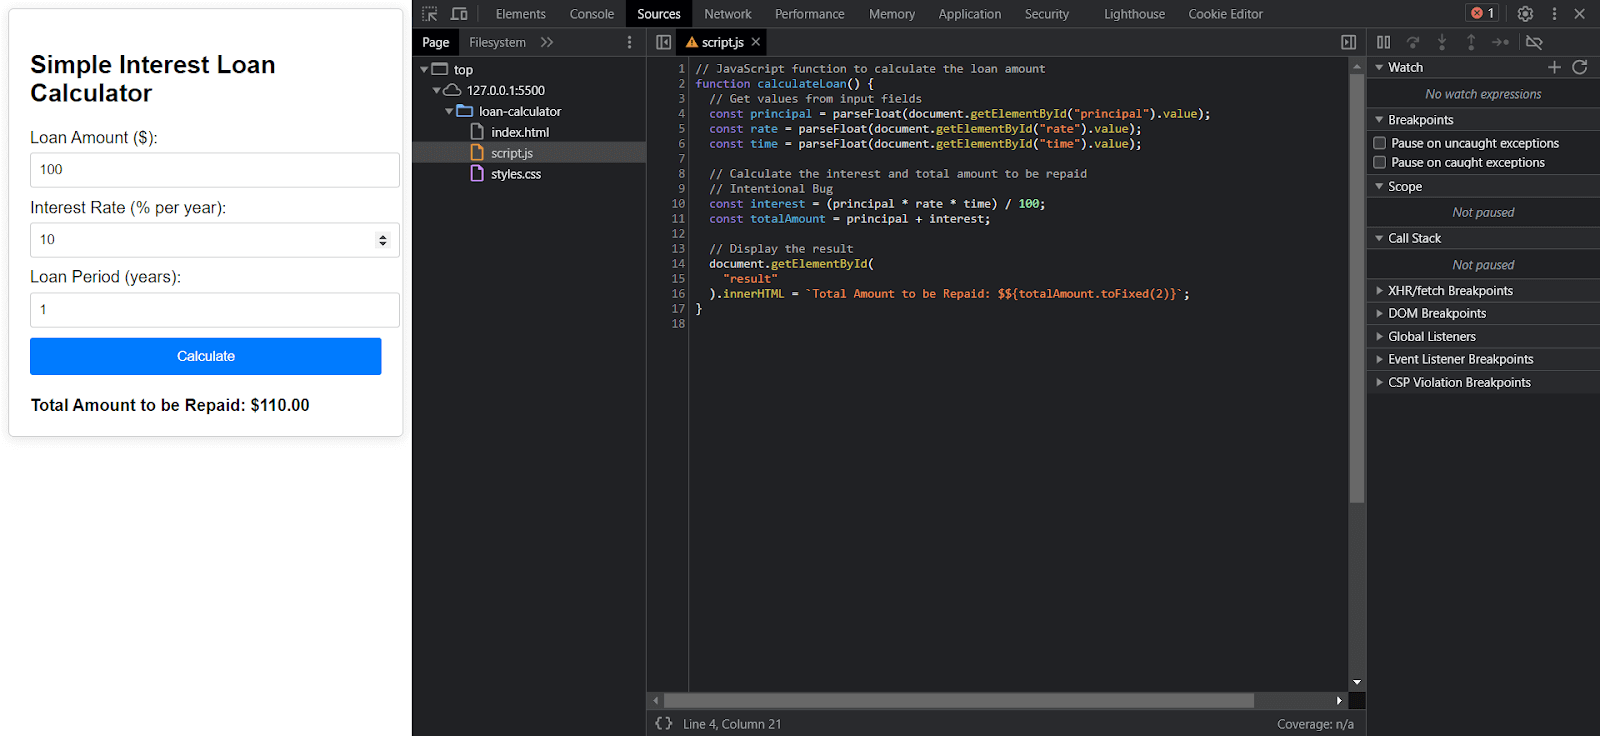
- Within the code editor, select line number 11 by clicking right on the number digit, not on the line containing the code. This will add a breakpoint at line number 11 which is responsible for the final loan amount calculation.
To activate the JavaScript debugging, we can execute the code again by providing inputs on the web page and then clicking on the Calculate button. The Chrome debugger will pause the code’s execution and highlight the 11th line (where the breakpoint was set). This will also show the value of variables in the code till line 11.
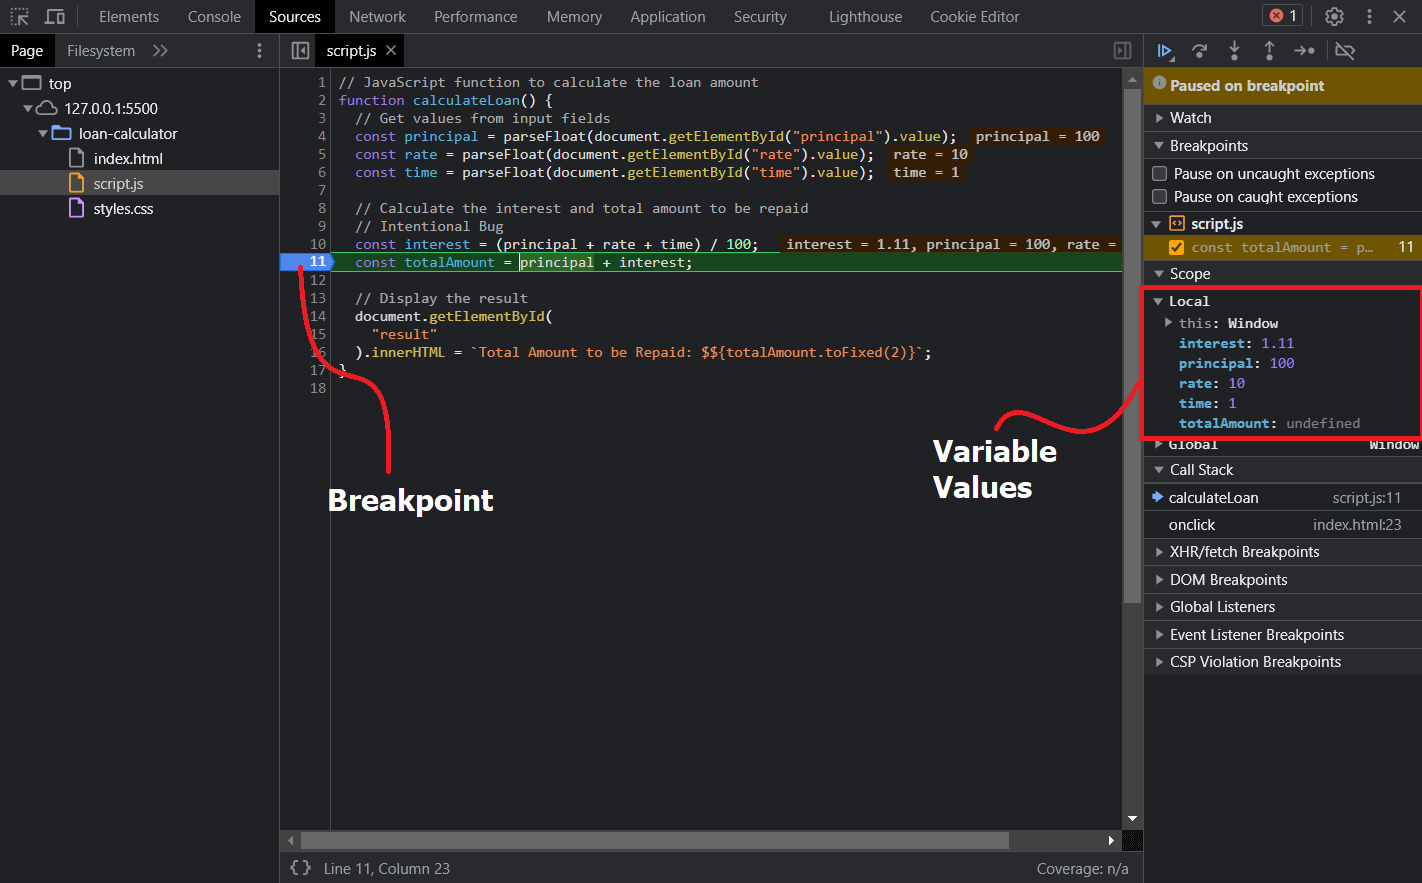
The above image clearly depicts how the breakpoint paused the execution and listed all the variables with their values in the Local option inside the Scope window. Now we can analyze these variables to find the actual issue and fix that.
Step 3: Analyze the Variables
Chrome debugger provides us with tools that help in analyzing the state of our code and variable values on any line as we step breakpoint through it.
- Watch: Using the Watch window, we can specify a variable (or expression) we want to monitor. We can add the variable or expression by clicking the plus sign +.
- Call Stack: The Call Stack window shows a set of methods and functions executed during our code’s execution.
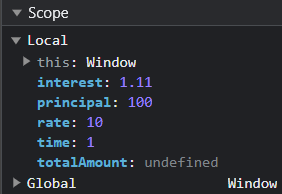
- Scope: This is the window where we can view and edit values of variables and properties in the local and global scope. This is very useful in fixing issues where multiple data and variables are involved.
In our example, we will analyze the local variables and check for the actual issue that leads to an incorrect loan amount calculation. On observing carefully, we can see that the interest is calculated wrongly i.e. its current value is 1.11 instead of 10.
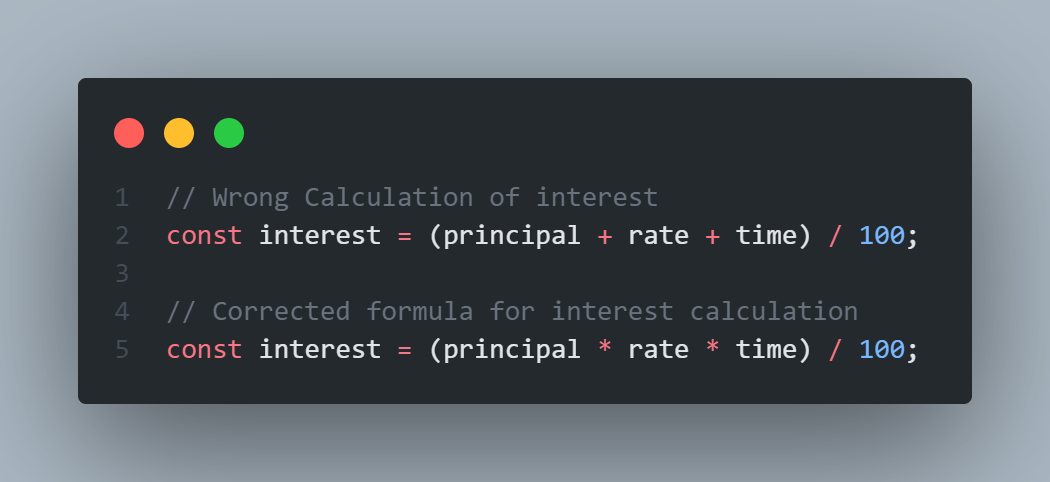
On diving deeper, we can clearly visualize that the root cause for this problem lies in the way this interest has been calculated. The formula used here is incorrect ( i.e. here the principal, rate, and time are added instead of being multiplied ).
Step 4: Fixing the Bug
Now that we have successfully identified the bug it’s time to fix that by correcting the typo mistake. Obviously, we can do this by editing the code and then re-running the code, but with Chrome debugger, we don’t even need to leave the browser to apply the fix. Here are the instructions we can follow to edit our JavaScript code directly inside the Chrome debugger interface.
- Since we are still in debugging mode, first click the Resume execution button (
 ) to exit debugging mode.
 - Now, in the Code Editor, replace all the + symbols with the * symbol in line 10.
- Press CTRL + S (Windows) or CMD +S (Mac) to save the changes.
- Click the line number 11 again delete the breakpoint before running the code.
Now on clicking the “Calculate” button again, we get the correct loan amount calculated i.e 110.
How to Debug JavaScript using console.log
An efficient technique for resolving web page glitches involves employing the console.log() function within your code. This nifty tool permits real-time examination of variable values through the Chrome debugger’s console panel.
While this method enjoys popularity, it occasionally lacks the depth required for intricate issues. It thrives in scenarios with a limited variable count or stable values but may not suffice for dynamic and numerous variables. In such instances, the Chrome debugger emerges as the preferred, more effective debugging solution.
NoteAutomate your tests on a Selenium based cloud Grid of 3000+ real browsers and devices. Try LambdaTest Today!
Some Common Challenges of JavaScript and its Solutions
JavaScript Debugging can sometimes be challenging and mysterious, hence knowing the common challenges of JavaScript can help you debug faster. Here is a list of some common challenges that may lead to a bug in the JavaScript program.
Challenge Set 1 – Lexical Errors
Lexical errors are encountered when the developers use unwanted symbols not part of the programming language. Usually, these are typo mistakes that go undetected while compiling.
To avoid these types of errors, it is good to break down the JavaScript code into pieces and avoid writing complex functions at once. This will help us easily debug such errors during the execution of the web application.
Challenge Set 2 – Syntactic Errors
Syntactic errors, also known as syntax errors, are the most common errors developers encounter. A syntax error arises when we use the correct symbols but in a method that doesn’t make sense to the interpreter or compiler.
These errors are always caught up by the interpreter or compiler and developers can fix them by seeing the error logs created while compiling.
Challenge Set 3 – Execution Errors
Execution errors, also known as runtime errors, occur when the code has a valid lexicon and syntax, but we’re making bad requests to get the results we desire.
Execution errors are usually encountered when we process data incorrectly coming from APIs. These errors can be encountered by using the Chrome debugger tool.
Challenge Set 4 – Logic Errors
These are errors encountered through faulty algorithm logic. Here, the code is executed successfully but leads to unexpected results. These are the most challenging errors to spot and usually the most expensive ones to correct.
Advanced JavaScript debugging is required to fix these issues. We may utilize the advanced features of Chrome debugger to fix these issues.
Advanced JavaScript Debugging Using Cloud-Based Tools
Although this Chrome Debugger is great for debugging the code during the development of the application. But as our web app grows in size and complexity, it becomes difficult to test it manually for each and every functionality. Hence, developers usually automate the testing of web apps using the various automation tools available.
Cloud based automation tools are really useful because they can test our app in almost all popular browsers and platforms and hence ensure better quality assurance for the web app. One such popular cloud-based testing platform trusted by large enterprises as well as startups is LambdaTest.
LambdaTest is an AI-powered test orchestration and execution platform that provides a comprehensive solution for testing web and mobile applications with over 3000+ real device browsers and OS combinations, ensuring quality and speed.
Conclusion
Congrats! You have successfully completed debugging your JavaScript program using Chrome debugger. Chrome debugger has so much to offer. It is a powerful developer tool, and investing the time to master it will earn you a more efficient debugger tag.
We urge you to go and experiment with a debugger using your own web applications. Get used to analyzing the state of properties and variables at each point.
Stay tuned for further updates and announcements. You can also subscribe to Coding Jag – our weekly newsletter, and stay hooked to the latest news around the testing world.
Additionally, you can try out LambdaTest for more advanced testing of your web application. It can test your websites on multiple browsers and platforms at the same time.
Frequently Asked Questions (FAQs)
How to open the Chrome Debugger tool?
The easiest one is to use the keyboard shortcuts i.e. Ctrl + Shift + J in Windows and Ctrl + Option + J in Mac. Other options are, open the browser menu, scroll down to the “More tools” option, and select the “Developer tools” option or right-click on the web page to debug and click on the “Inspect” option.
How to edit JavaScript in Chrome Debugger?
Developers may edit JavaScript in Chrome debugger by using the Code Editor tab of the Sources panel of the DevTool. Developers may directly edit the JavaSCript in the Code Editor and then press CTRL + S (Windows) or CMD + S (Mac) to save the edited code.
How to put Breakpoint in Chrome debugger?
To put breakpoints we first need to open the desired file in the Code Editor pane of the “Sources” panel. Within the code editor, select the line number where you want to add a breakpoint by clicking right on the number digit, not on the line containing the code. This will add a breakpoint at the selected line number.
How to see variable values in Chrome Debugger?
The Sources panel provides the capability to watch multiple variables within our application. This is located in the watch pane of the debugger sidebar. We can also check the value of all the local and global variables inside the Scope section of the JavaScript debugging pane.


Author’s Profile
Tanay Kumar Deo
Tanay kumar deo is a skilled software developer, Upcoming SDET at GlobalLogic (A Hitachi group company). With expertise in Android and web development, he is always eager to expand his skill set and take on new challenges. Whether developing software or sharing his knowledge with others, he is driven by a desire to make a positive impact on the world around him. In addition to his technical abilities, Tanay also possesses excellent blogging and writing skills, which allow him to effectively communicate his ideas and insights to a wider audience.
Blogs: 16
Got Questions? Drop them on LambdaTest Community. Visit now


