
Guide To Chrome Developer Tools
Tanay Kumar Deo
Posted On: November 30, 2023
![]() 85461 Views
85461 Views
![]() 17 Min Read
17 Min Read
For front-end developers and testers, finding and fixing bugs in the web app can be tough sometimes because of unexpected data from the API call and uncertain user interactions. All modern browsers have a developer tool to debug errors in the code.
Developer tools allow developers and testers to view and modify the HTML/CSS and JavaScript of the web page opened. It can also modify the DOM elements directly through the browser.
Google Chrome, one of the most popular browsers, also has built-in developer tools called Chrome Developer Tools. This article will guide you on using Chrome developer tools for debugging and testing web applications.
TABLE OF CONTENTS
What are Chrome Developer Tools?
Chrome Developer Tools or Chrome DevTools is a set of web development tools built into the Google Chrome browser that lets us inspect, edit, and debug our code and measure our page’s performance. These tools let developers see the changes on web pages in real time, diagnose problems more quickly, and build a better website. Explore 25 Best Debugging Tools for 2023, which will help you debug seamlessly.
How to Access Chrome Developer Tools?
To access the Chrome developer tools, developers may use the following three methods:
- The easiest one is using keyboard shortcuts i.e. Ctrl + Shift + J in Windows and cmd + Option + J in Mac.
- Open the browser menu by clicking on the three dots in the upper right corner, scroll down to the More tools option, and select the Developer tools option.
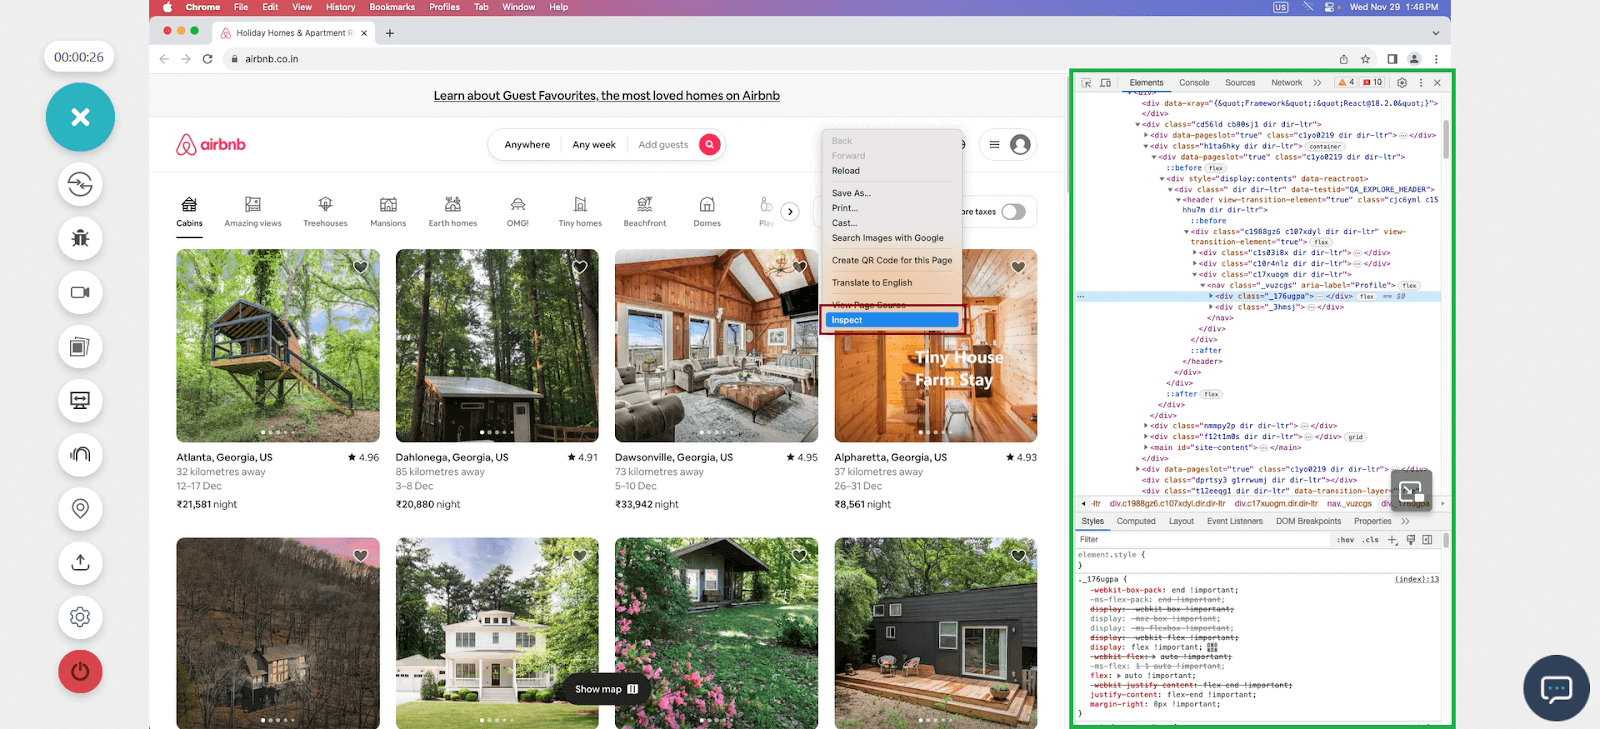
- Right-click on the web page to debug and click on the Inspect option.
Different Components of Chrome Developer Tools
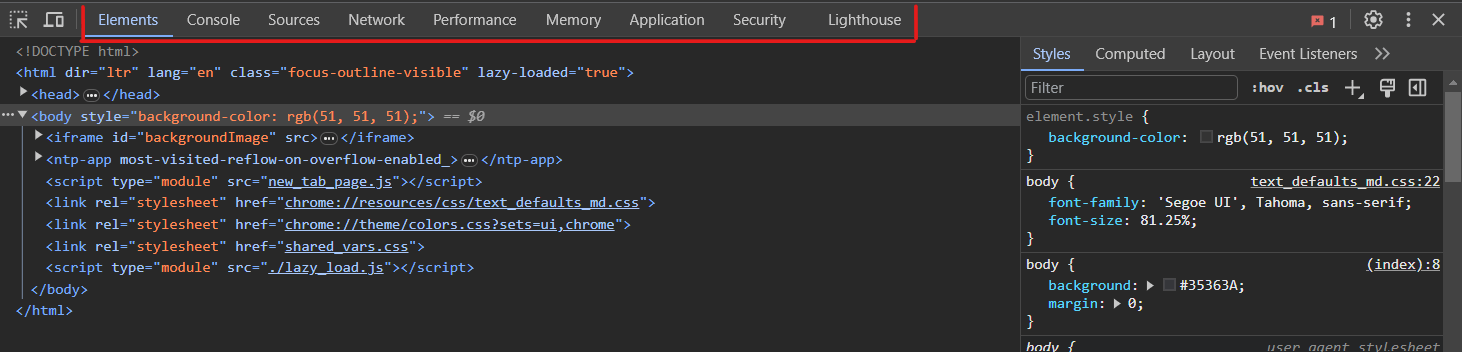
As you can see in the above image, the Chrome debugger has nine panels. All these panels are responsible for different debugging tasks. Here is a quick summary of what each panel is mainly responsible for.
- Elements: It can inspect and edit HTML elements and CSS style attributes.
- Console: Mainly responsible for viewing logs and executing JavaScript code.
- Sources: Used to debug JavaScript, edit JavaScript, add breakpoints, etc.
- Network: Responsible for viewing and debugging network-related activities.
- Performance: Used to analyze the web page load speed and optimization.
- Memory: Assists in tracking memory usage and fixing memory-related issues.
- Application: It inspects cookies, localStorage, sessionStorage, IndexDB, and any other local database.
- Security: Used to debug certificates and other security problems.
- Lighthouse: It audits the web app/website’s SEO, performance, quality, accessibility, etc.
Let’s have a detailed look at all these nine panels in detail.
Elements Panel
The elements panel lets developers inspect and modify the HTML and CSS of the web page. With the elements panel, we can modify the code directly in the browser and see those changes instantly reflected on the web page.
Developers and testers mainly use the elements panel to experiment with the HTML structure or the web page’s design. Its features include a color picker, responsive screen sizes, CSS editor, layout analyzer, animation builder, event listeners, and rulers.
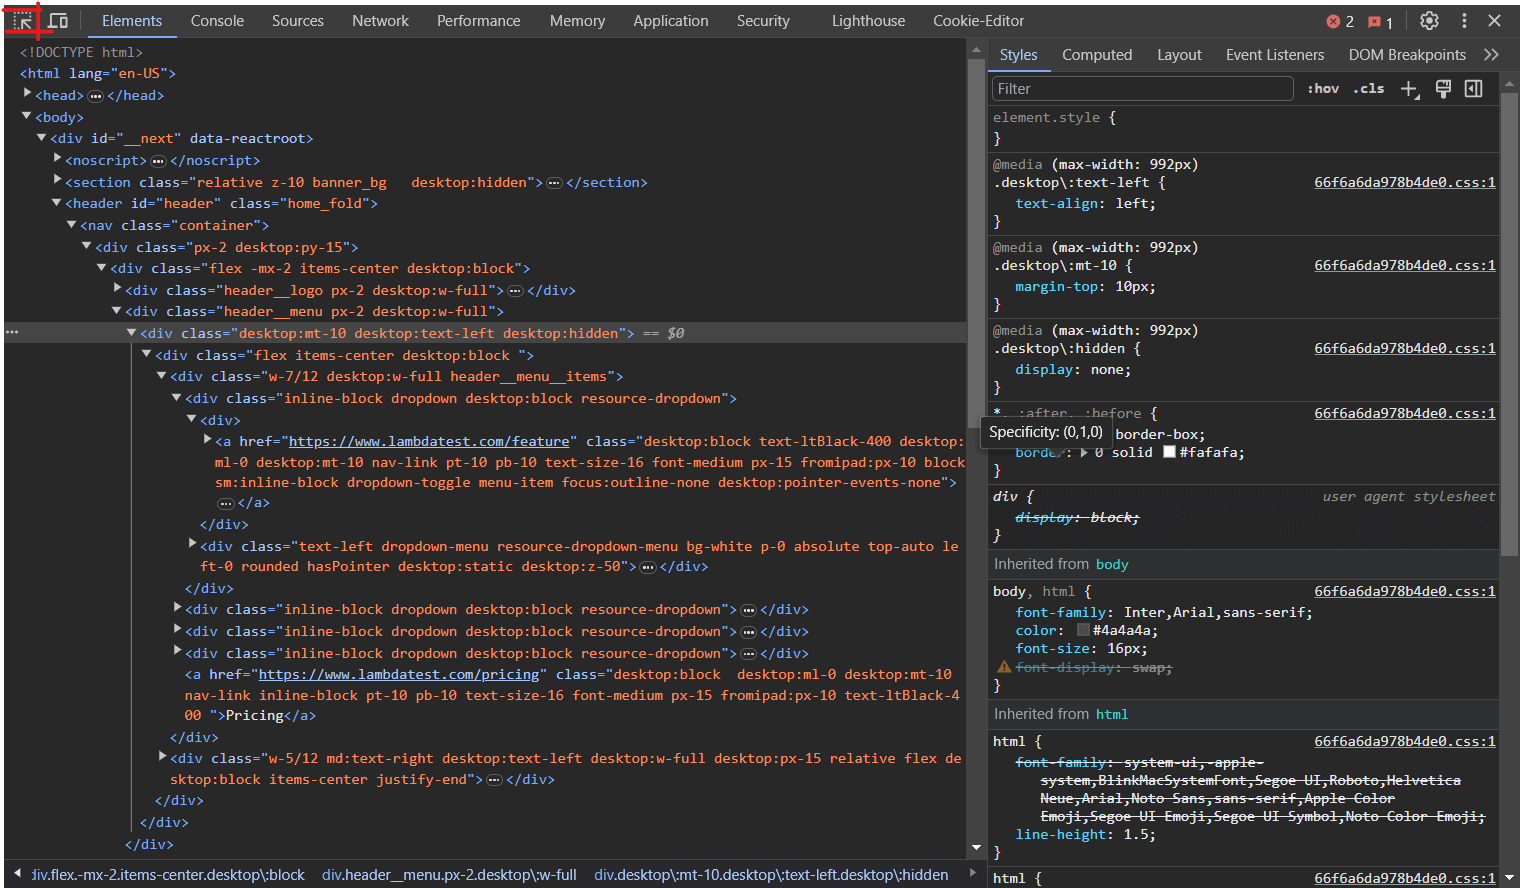
To inspect and modify any component we need to select that using the selection tool icon on the top right corner or by pressing Ctrl + Shift + C or Cmd + Shift + C as a shortcut. This will display the HTML/Document Object Model (DOM) and CSS for that component in the elements panel. Next, we can modify the HTML or CSS for that component. Any changes we make will be immediately reflected on the page and will not affect the source file directly.
Console Panel
The console panel of the Chrome debugger is primarily used to write and execute JavaScript codes. We can also see the log output created by our website in this panel. To open the console panel, we can click on the console panel tab in the Chrome devTools.
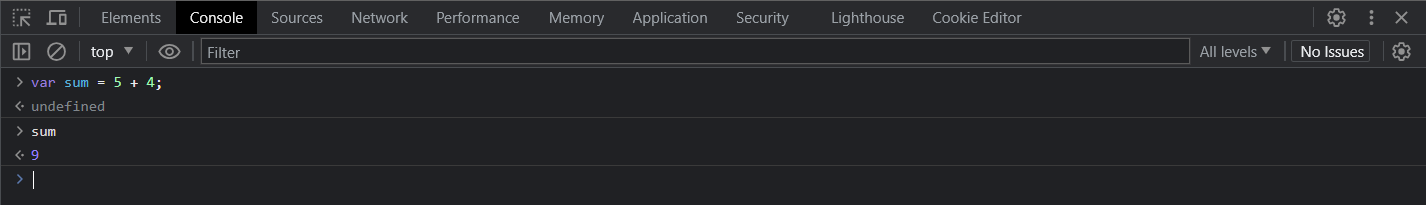
This permits real-time examination of variable values using the Chrome developer tools’ console panel. Developers and testers may put various console.log() statements in their code and then see their output in the console panel as the user interacts with the browser.
Sources Panel
The sources panel allows developers and testers to view source code or bundle output. This panel is primarily used for complex JavaScript debugging. Here, we can view our source files and set up multiple breakpoints, watch variables and their values, and perform the majority of debugging. It contains a file tree that can navigate through all source code files. To open the sources panel, we can click the sources panel tab in the Chrome developer tools.
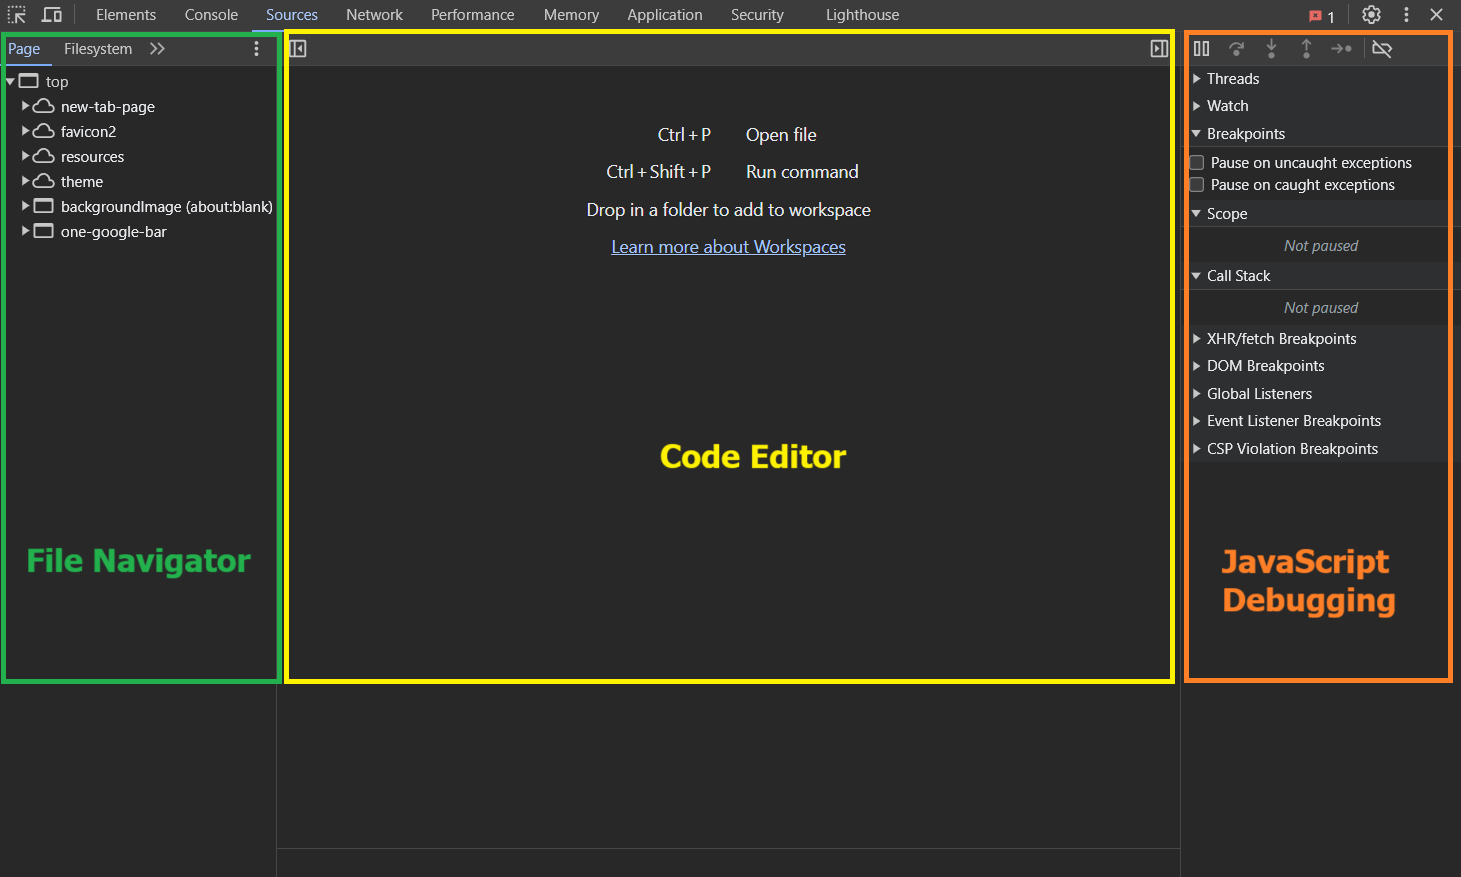
As shown in the image above, the sources panel has three primary components.
- On the left, we have the File Navigator pane; it lists a file tree of the web app, including HTML, CSS, JavaScript, and other files, including assets attached to the web app. Chrome extensions’ files may also appear here.
- In the center, the Code Editor pane displays all the source codes for the files selected from the File Navigator.
- On the right, we have the JavaScript Debugging pane, which is especially used for debugging the JavaScript code.
Learn How To Debug JavaScript Using Chrome Debugger.
 Note
NoteElevate JavaScript based web app testing with LambdaTest’s AI-Orchestrated cloud. Test smarter. Try LambdaTest Today!
Network Panel
The network panel is mainly used to detect any upload or download request made by the webpage using the network. We can log and analyze all network activity in the log section.
The network panel in Chrome DevTools has a waterfall graph for all the resources loaded in the web app. This waterfall graph helps us measure the individual performance of each asset, resource, and API endpoint; hence, it can be used to improve the network performance of the web app. Furthermore, we can filter our time required by different types of resources like Fetch/XHR (for API requests), JavaScript, CSS, Img, Media, Font, Doc, and others.
To analyze the web app’s network performance using the Chrome Developer’s tool we can open the network panel by clicking on the Network tab. Next, we may clear all previous logs by clicking on the clear icon. Finally, we can refresh our web page to get the network log and real time waterfall graph of the website.
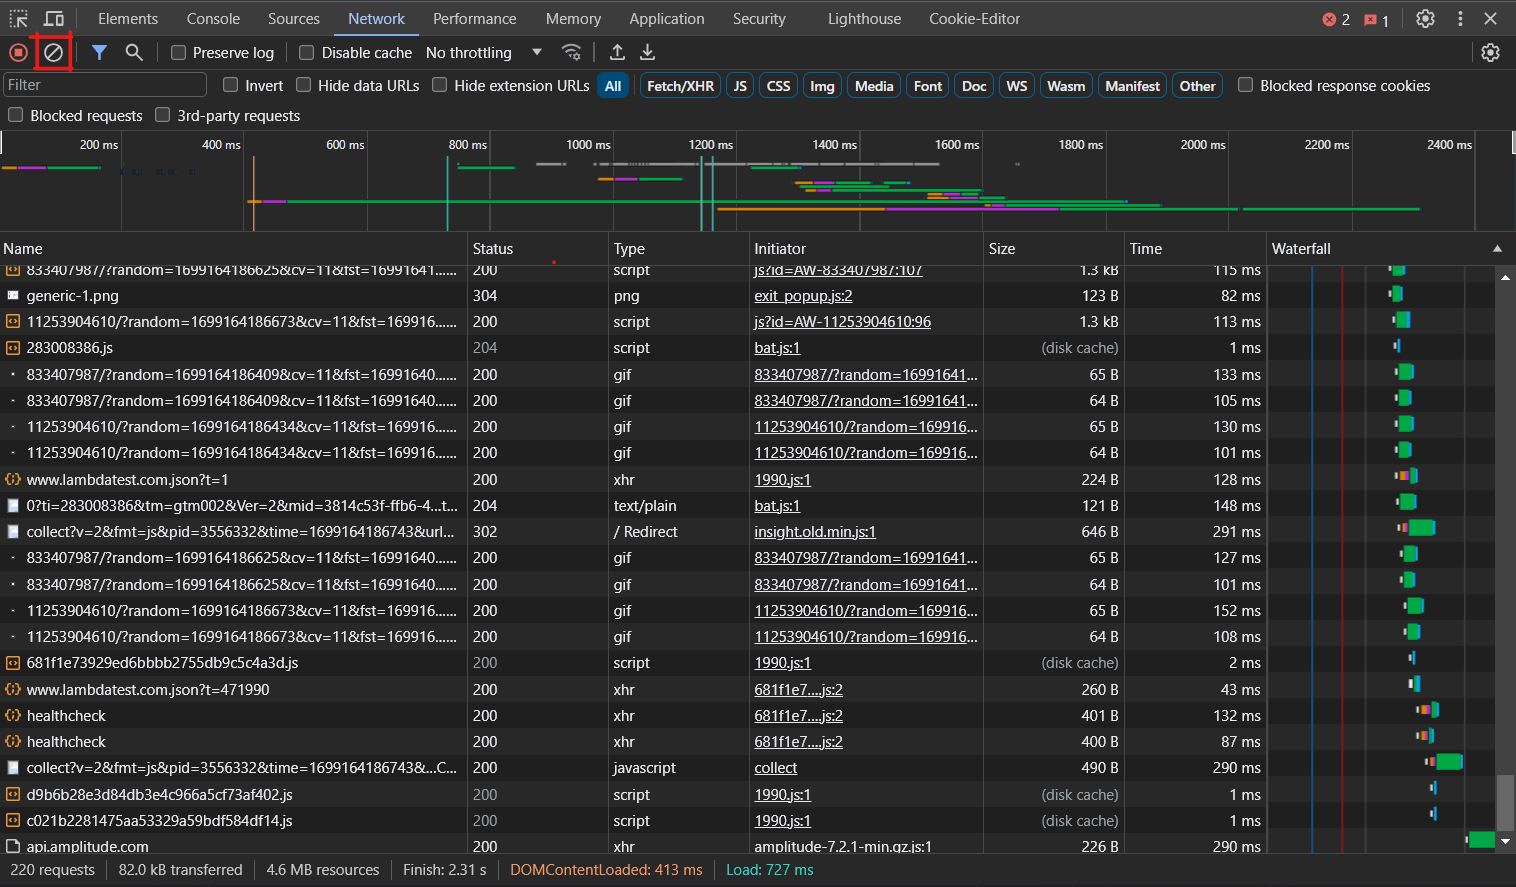
The network panel is used to monitor the number of requests made by a web page, total data transferred, loading time taken, resources downloaded or uploaded, caching performance, and other network-related activities. This information helps developers and testers to optimize individual resources and the web app.
Performance Panel
The performance panel in Chrome DevTools allows developers and testers to measure the page load performance of a web app. This is achieved by running a performance analysis on the web page and generating metrics on various aspects of the page load process, like the time taken by the web page to display, various network resources to load, and the web page to be interactive. To open the performance panel, we can click on the performance tab on the Chrome developer tools.
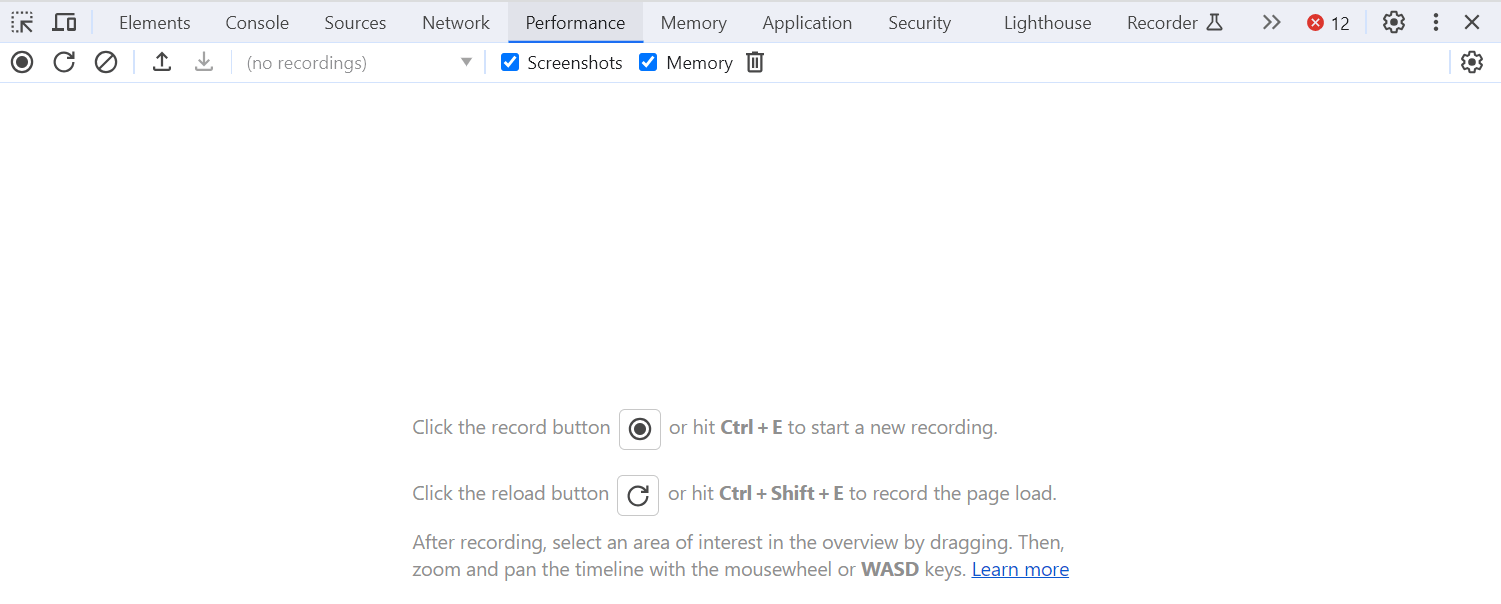
The record and reload page button in the performance panel of Chrome DevTools allows developers and testers to run performance analysis on a web page and view detailed metrics about how the page is rendering and loading. By clicking the reload button, the tool will simulate a user visiting and interacting with the web page, providing information about the page load process in graphs and screenshots.
Detailed performance analysis on the LambdaTest website is shown below.
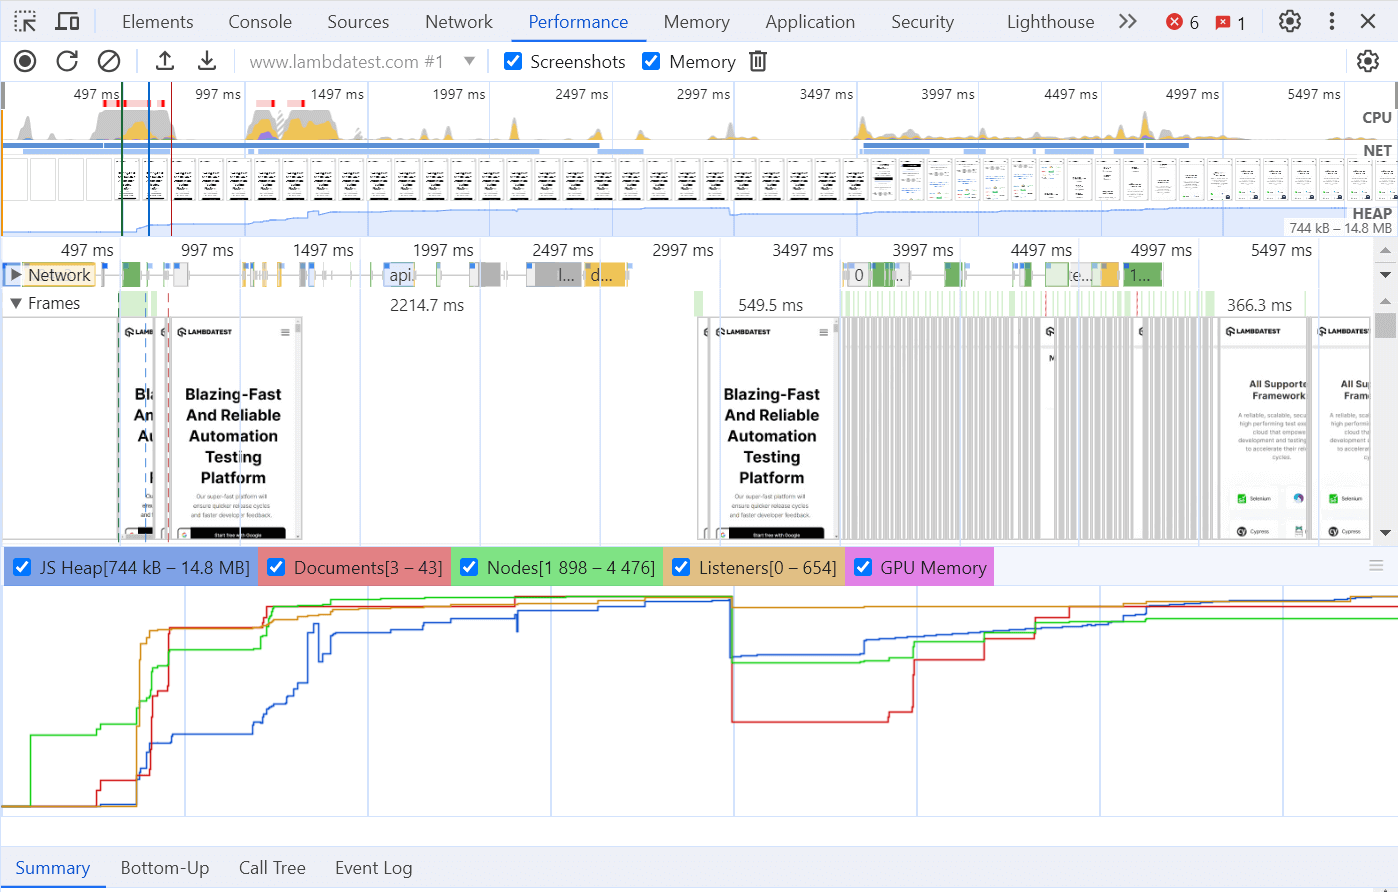
We can even interact with call stacks and check functions that may consume more time, block the main thread, and delay the TTI (Time To Interactive) metric. Selecting a function provides all kinds of information for that function. We can check how long that function was executed and what other functions it called, and we can also open the function in the sources panel.
Memory Panel
The memory panel in Chrome developer tools provides advanced insight into the web page’s memory consumption. We can inspect memory usage by component, snapshot heap allocation, and record allocation timelines.
The memory panel detects and fixes memory-related issues like leaks, bloats, and garbage collections. To open the memory panel, we can click on the memory tab on the Chrome developer tools.
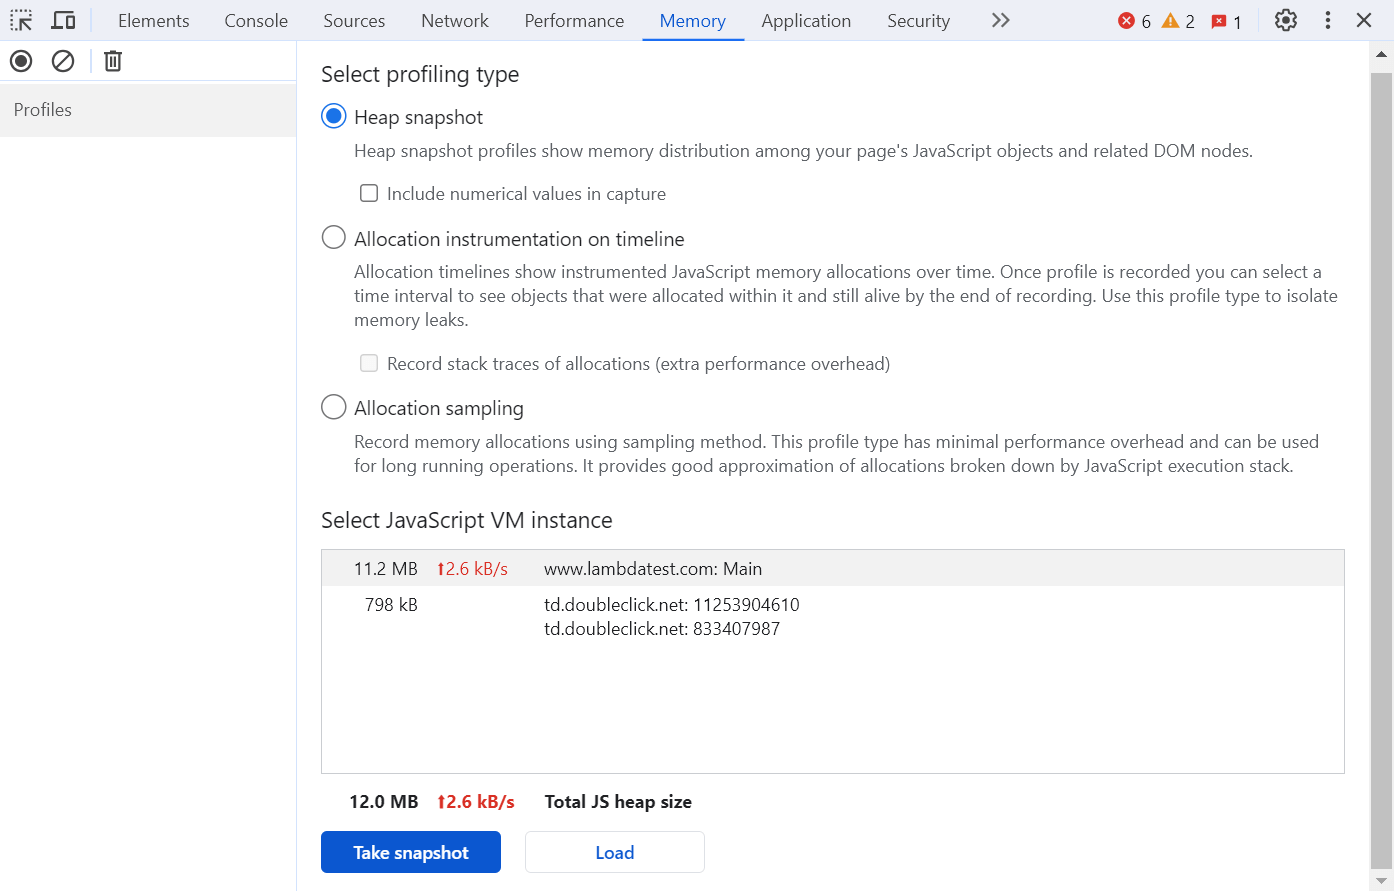
This screen shows a summary of the memory used by the web page by analyzing the total JavaScript heap size of the web page. Detailed memory consumption data by the web page can be generated by clicking on the Take Snapshot button.
The Chrome DevTools memory panel allows us to select from three profiling types.
- Heap Snapshot
- Allocation instrumentation on time
- Allocation Sampling
This is one of the most commonly used memory profiling types. It allows you to take a snapshot of the JavaScript heap at a specific point in time. This snapshot shows the memory distribution between various JavaScript and related DOM elements of the web page.
This profiling type provides us with the memory distribution between various JavaScript and DOM elements over time while scrolling and interacting with the web page.
The Allocation Sampling view maps memory consumption for individual page components like frames, documents, web workers, and graphics layers. This profiling type indicates the source of any high memory consumption.
Application Panel
The application panel in Chrome developer tools is used to inspect and edit the manifest file, service worker, cookies, localDB, sessionStorage, and other local databases. This panel is also used to view the website’s metadata, protocols, and icons.
To open the application panel, click on the Application tab in the Chrome DevTools.
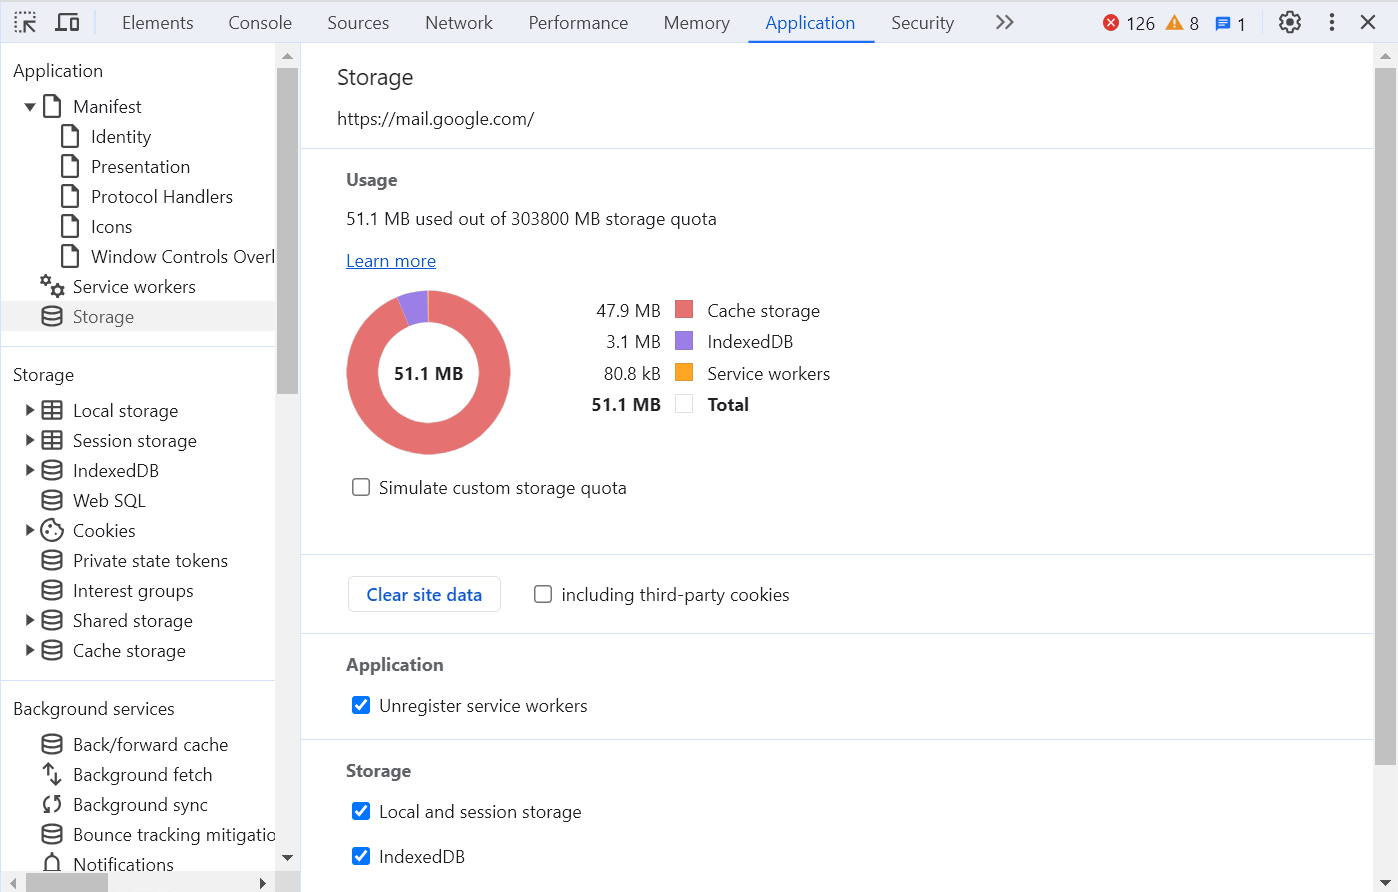
The application panel is mainly helpful in inspecting the progressive web apps that use local storage and API. This helps developers and testers manage storage, caches, and databases; inspect and clear cookies; and inspect Resources.
Security Panel
The security panel in Chrome developer tools displays connection security information for all network requests. This panel is used to determine if the data collected through network requests are secure or not. The website or network request will display a green lock icon if it is secure.
This panel can be used to view SSL certificates and encryption types of each network request and overall website. To open the security panel, we can click on the Security tab in the Chrome DevTools.
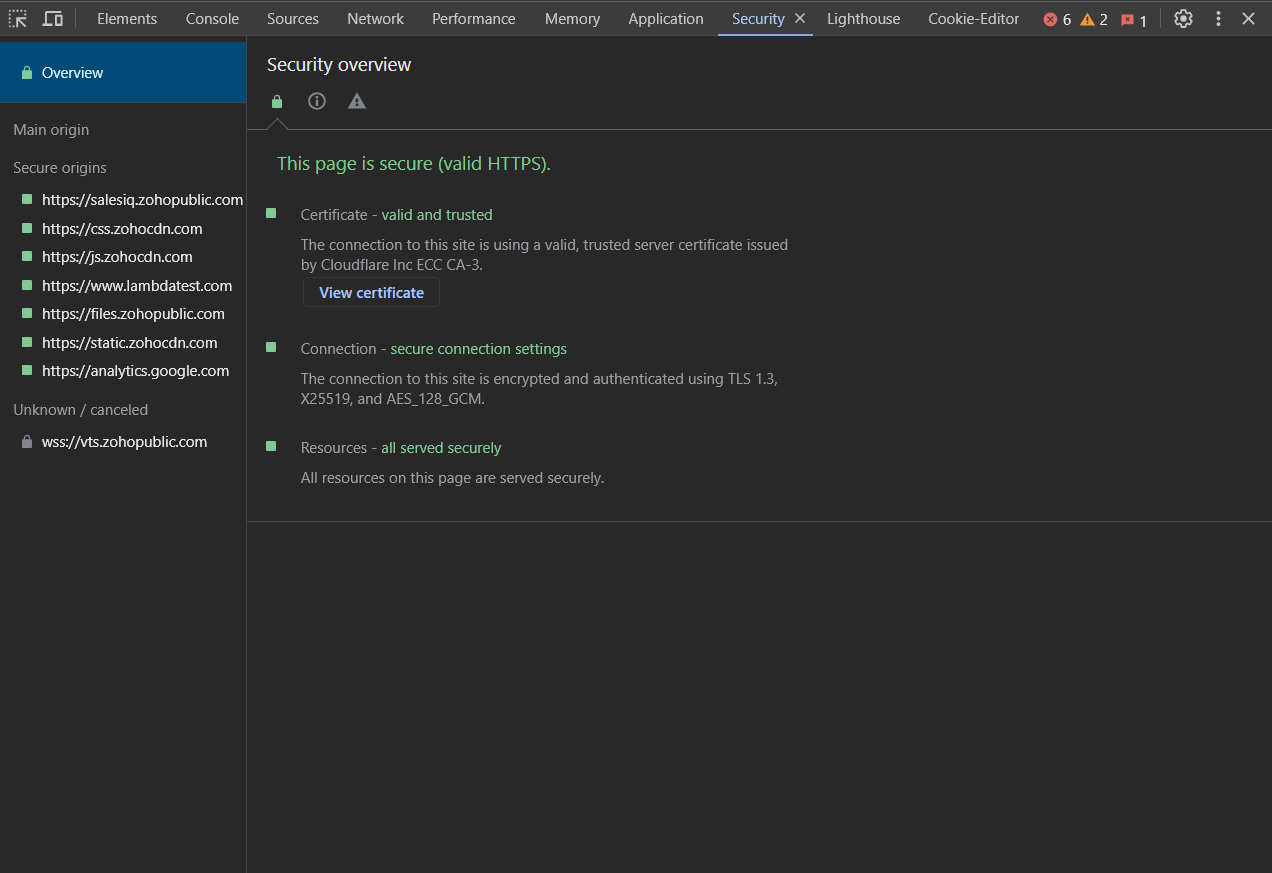
As shown in the image above, the security panel provides information about
- Certificate verification, indicating whether the website has proven its identity with a TLS certificate.
- TLS connection, indicating whether the website uses a modern and secure protocol.
- Subresource security indicates whether the website loads insecure HTTP subresources (mixed content).
Lighthouse Panel
Google Lighthouse is an open-source, free tool that can help developers and testers analyze and improve the website’s performance, speed, and overall experience by generating a Lighthouse report.
The lighthouse panel in Chrome developer tools is equipped with Google Lighthouse, which can audit the website without any extra plugins or widgets. To audit a website on Chrome DevTool follow the steps below:
- Navigate to the Lighthouse tab on Chrome developer tools.
- Click on the “Generate Report” button in the image below.
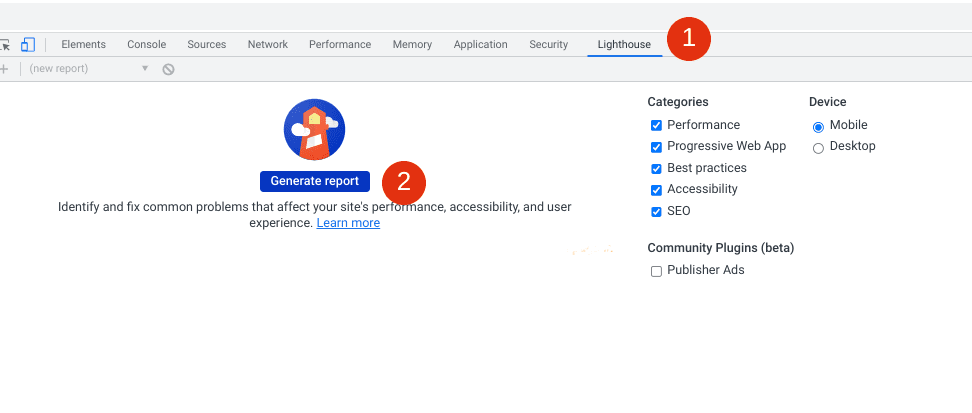
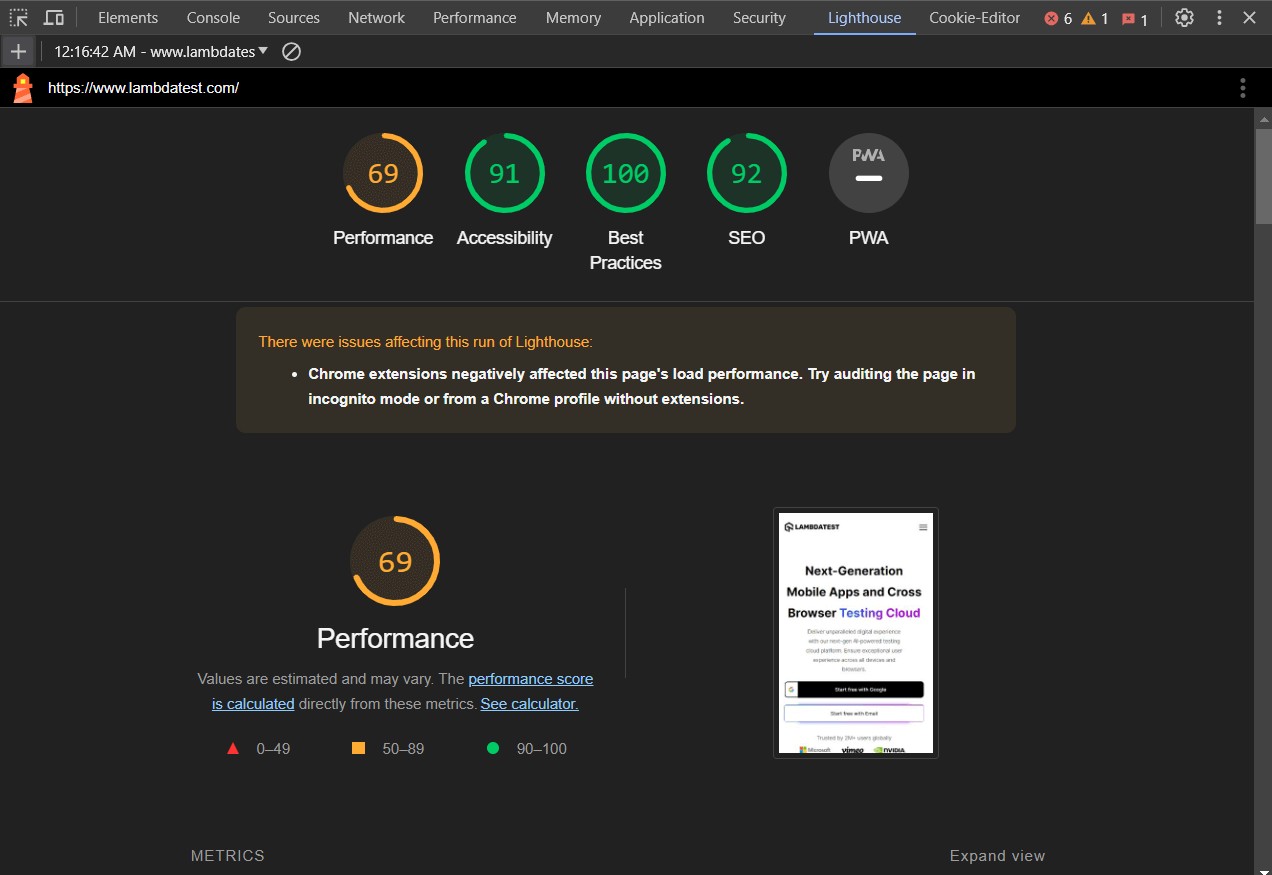
It allows us to assess a website’s SEO, performance, accessibility, best practices in code, and progressive web app. It is also highly configurable, making it flexible and useful for all types of sites, from the simple to the highly complex. This flexibility includes several categories to run audits on both mobile and desktop devices.
Auditing the website uses a 1 to 100 scoring system based on tests run against a simulated 4G connection of the selected data. A generated report for the LambdaTest home page is shown below.
NoteTest your website’s compatibility on the cloud Selenium Grid of 3000+ real browsers. Try LambdaTest Today!
Common Use Cases of Chrome Developer Tools
Chrome developer tools can be used in various scenarios to help us develop better websites. Here are a few common use cases of Chrome developer tools:
- Check responsiveness
- Style into the website
- Identify issues in the website
- Catch non-working plugins
Front-end developers and testers most commonly use Chrome developer tools to check the responsiveness of websites. It allows managing viewport appearance using both free scaling and preselected sizes. This feature is available in the elements panel.
If we are trying to improve the design of an existing web page, we can navigate to one already existing and inspect it with Chrome developer tools. So if layout, sizing, colors, or design is an issue, we can modify the CSS and check if our copy still looks good in the environment it will be displayed. Finally, we can make the same change in our actual code base by copy-pasting.
Chrome developer tools are commonly used to identify bugs and issues in the code. We can check the API requests and responses, JavaScript source files, and HTML files. We can even analyze and audit our page’s performance to improve our website.
Almost every website relies on a third-party plugin and widgets. Whether for analytics tools, form or popup tools, or chat add-ons, it’s crucial to keep track of whether they are working properly. Chrome DevTools can greatly help us in testing the performance of these tools.
Cloud Based Developer Tools
Although the Chrome developer tools running on our physical devices can greatly help us analyze and improve the website performance in various aspects, we must ensure that our website performs the same in all different browser versions, platforms, and devices. To achieve this, we may run real time testing on cloud based testing tools.
Cloud-based automation tools are handy because they can test our app in almost all popular browsers and platforms, ensuring better quality assurance for the web app. One such popular cloud based testing platform trusted by large enterprises as well as startups is LambdaTest.
With LambdaTest you can pace up cross browser testing while performing interactive and live testing on desktop and mobile browsers with our native cloud-based browser developers tools.
How To Launch Developer Tools On LambdaTest?
To launch developer tools on LambdaTest, we can follow the steps below:
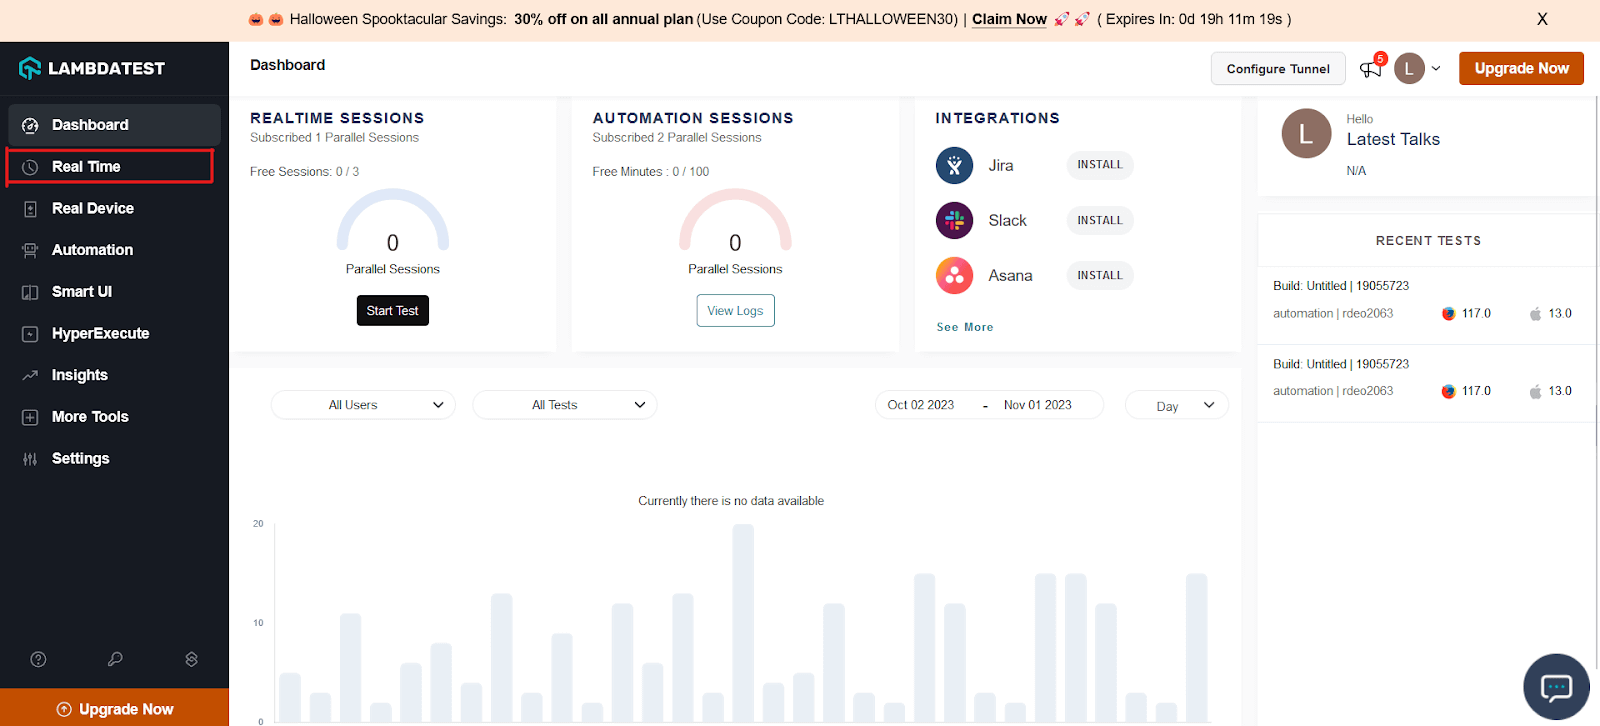
- Before proceeding we must create a LambdaTest account by registering for free and then navigate to the dashboard.
- Navigate to the real time testing dashboard by clicking the Real Time button from the left navigation menu.
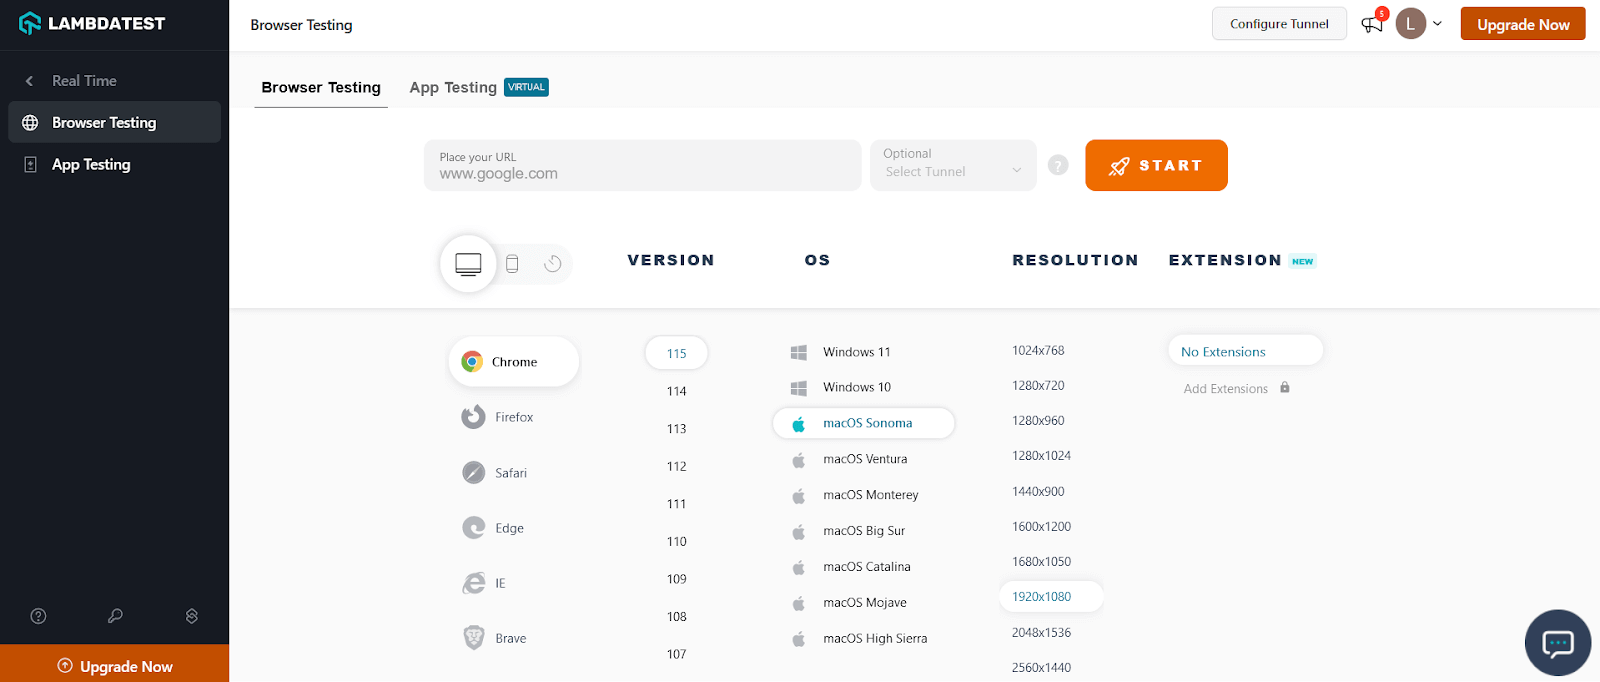
- Select the test configuration as per your choice. You can select from 8 different browsers on desktop and phone devices & their hundreds of versions to perform a real time test session. You may also select from multiple operating systems and screen resolutions for evaluating the website when rendered across various devices of different screen sizes.
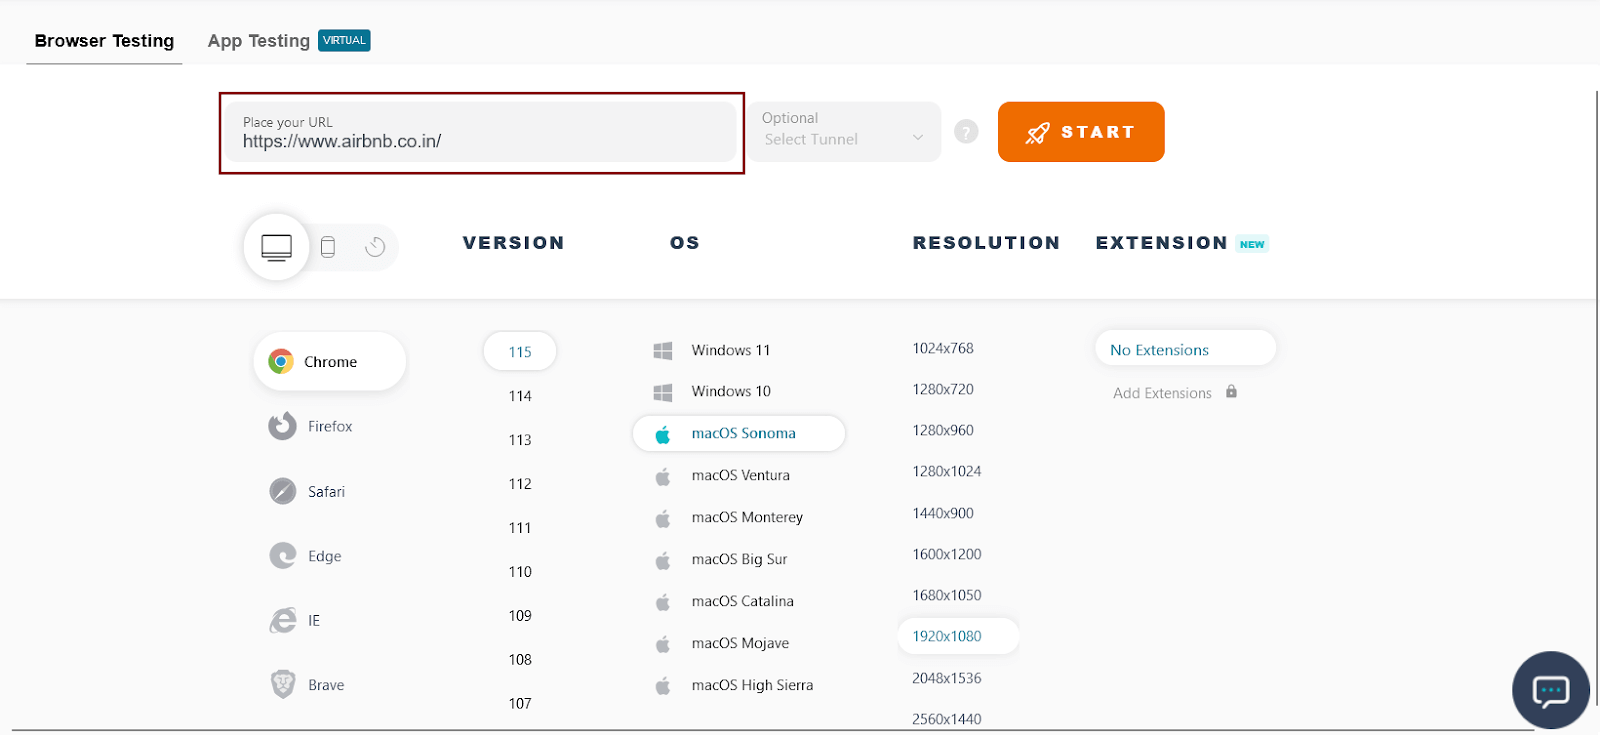
- After selecting browser configuration, enter a URL and hit the Start button to start testing.
- For desktop devices: Once the desired virtual machine is launched and operable, Right-click anywhere on the loaded webpage and click on the Inspect option.
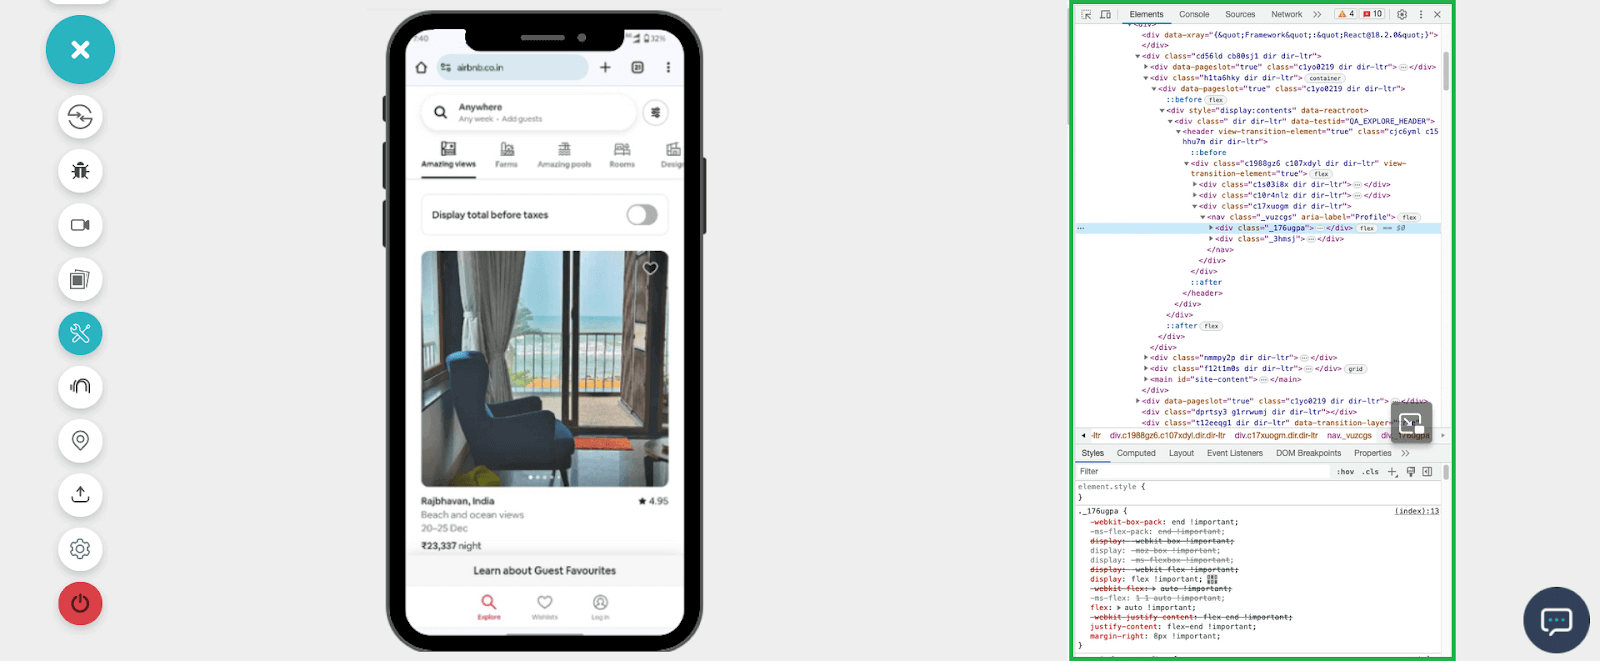
For mobile devices: If your selected configuration of VM is a mobile device and once it is launched and operable, you can notice controller buttons on the left side of the screen. Click the icon button with the tools icon to open developer tools.
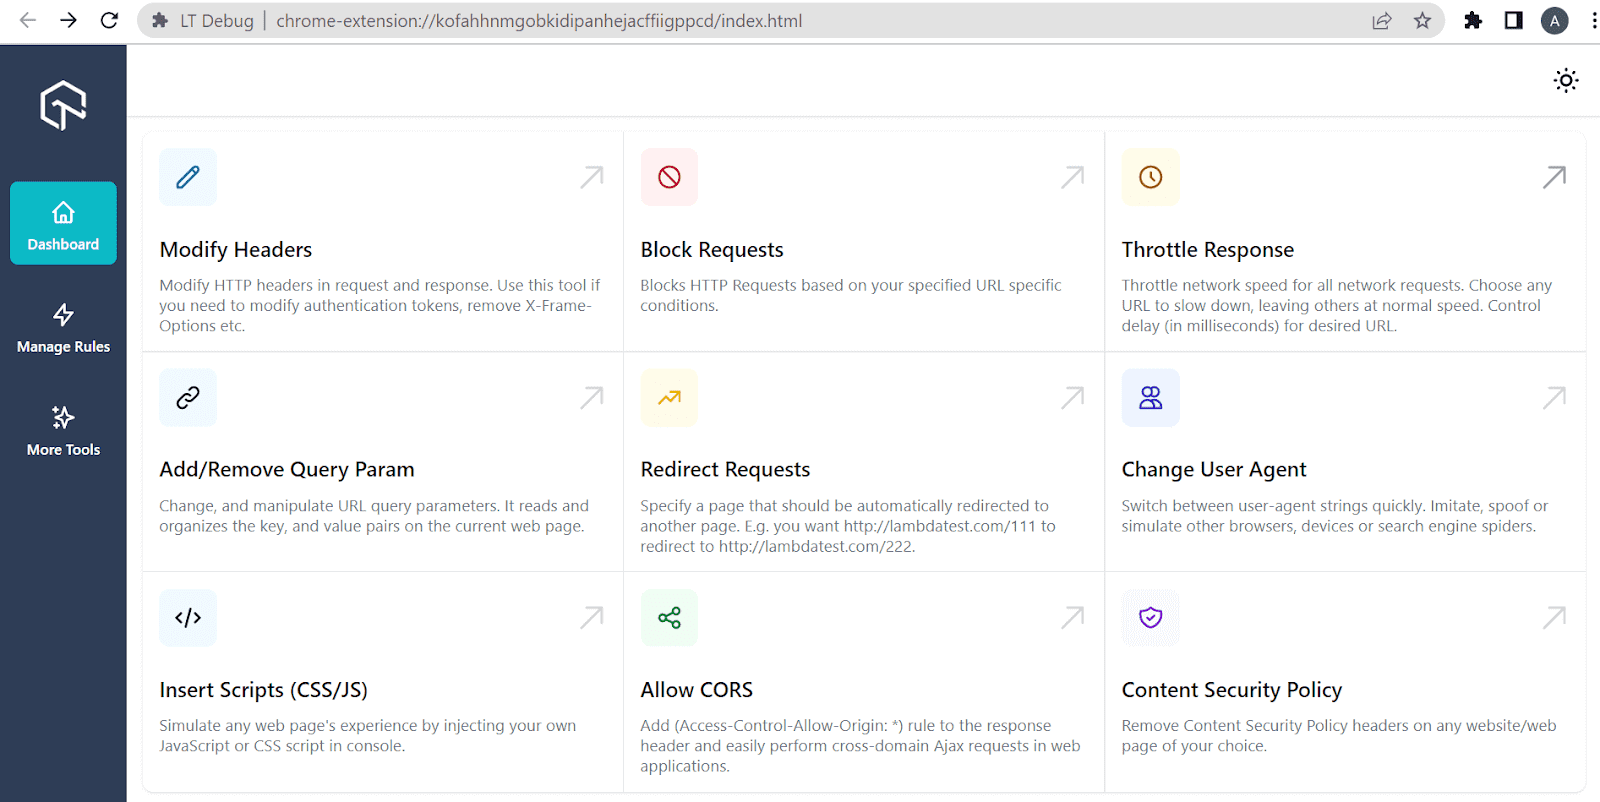
Bonus Chrome Developer Extension for Pro Debugging
LambdaTest brings a brand new Chrome extension called LT Debug to make the life of testers and developers easy and fuss-free while debugging. This free developer tool is simple to use with over nine amazing features used by web developers and testers during debugging on a day-by-day basis.
Even though there are various debugging tools in the market, we believe we are one among them! Here are some top reasons to trust our LT Debug Chrome extension:
- It’s free to use forever.
- All you need to do is fill out a simple form and start your debugging.
- It provides access to 100+ extensions, to make the life of developers and testers easier.
Here is our simple step-by-step guide on the installation process of LT debug:
Step 1: Go to the official LT Debug Chrome Extension page.
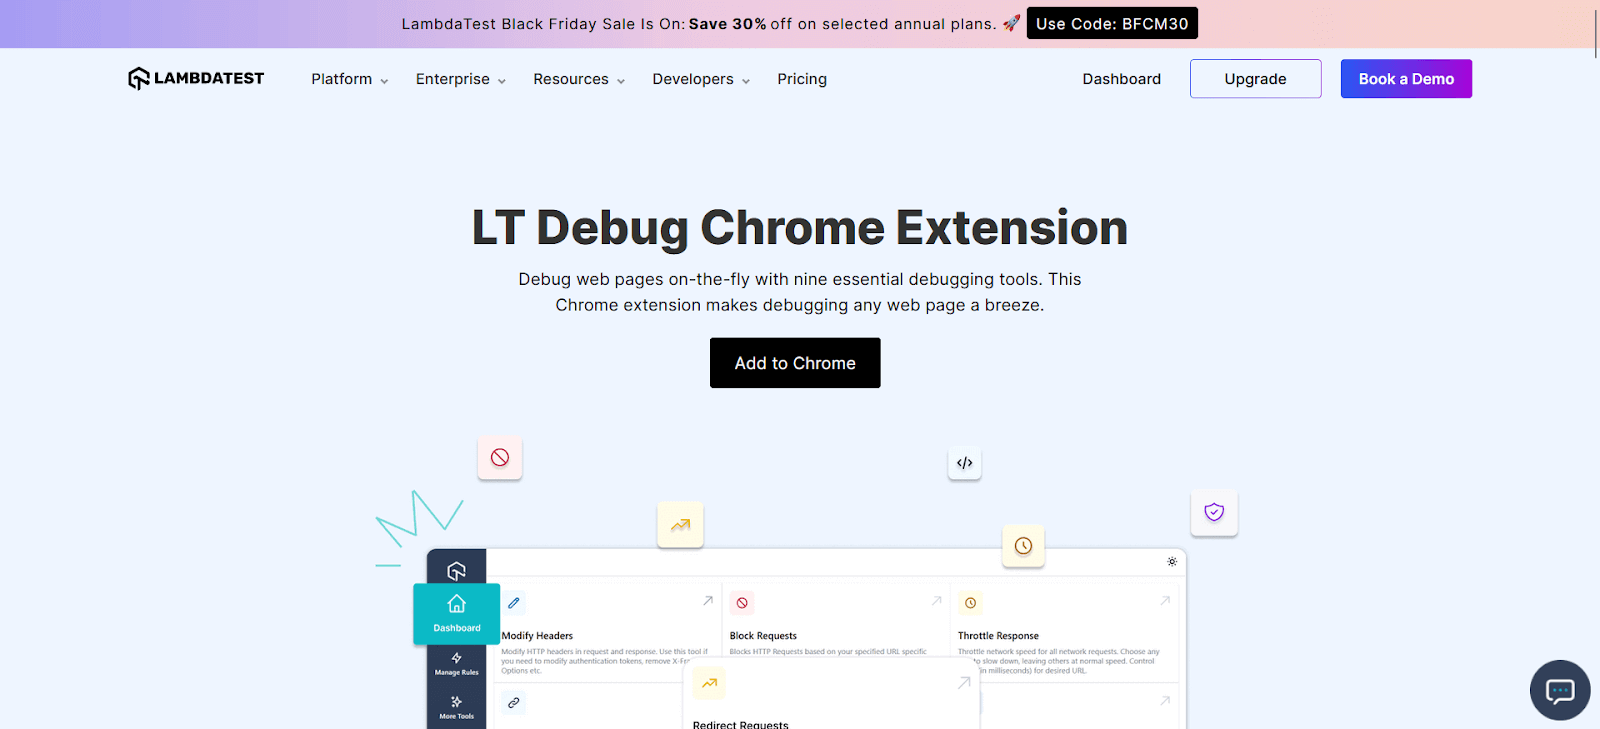
Step 2: Press the Add to Chrome button. You will be redirected to the Chrome web store.
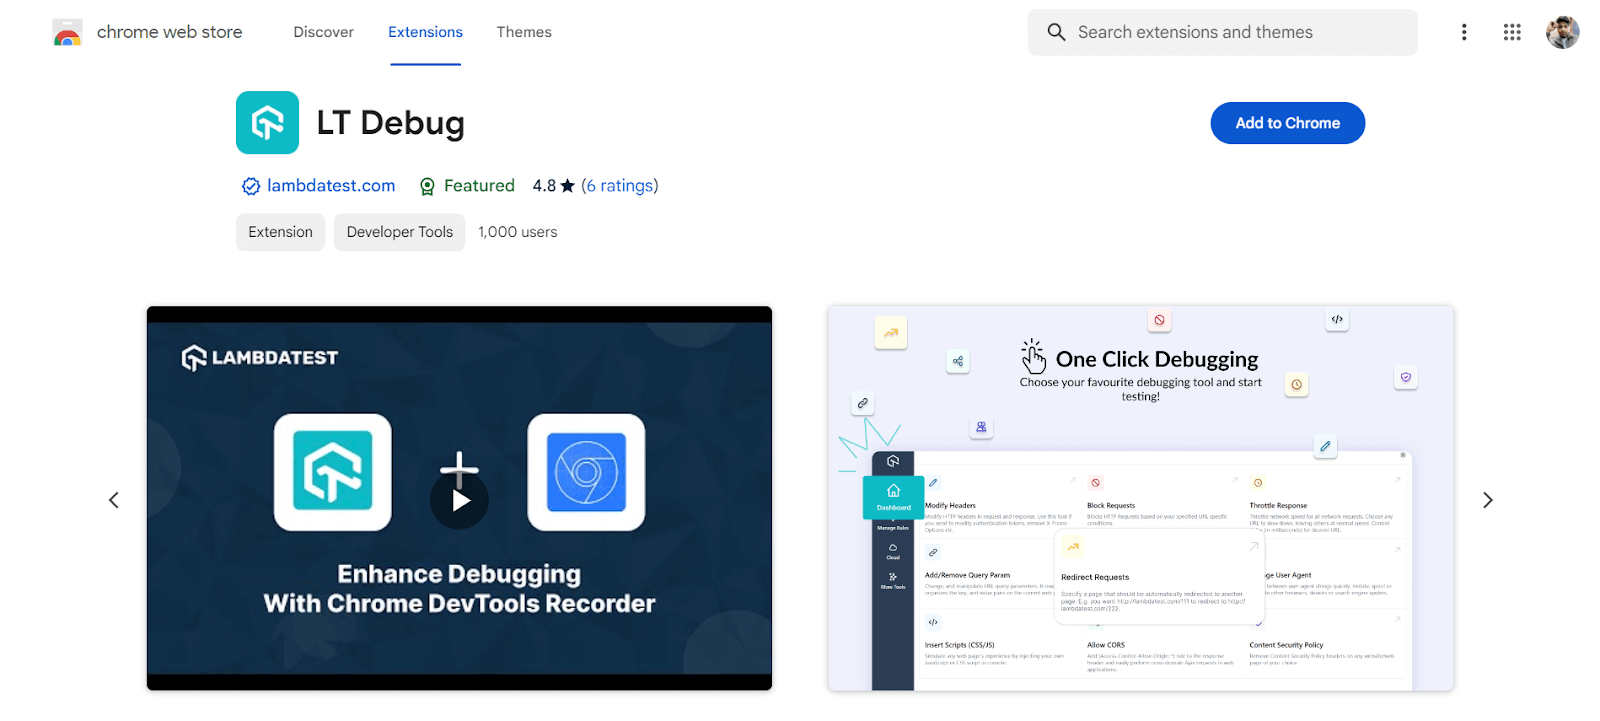

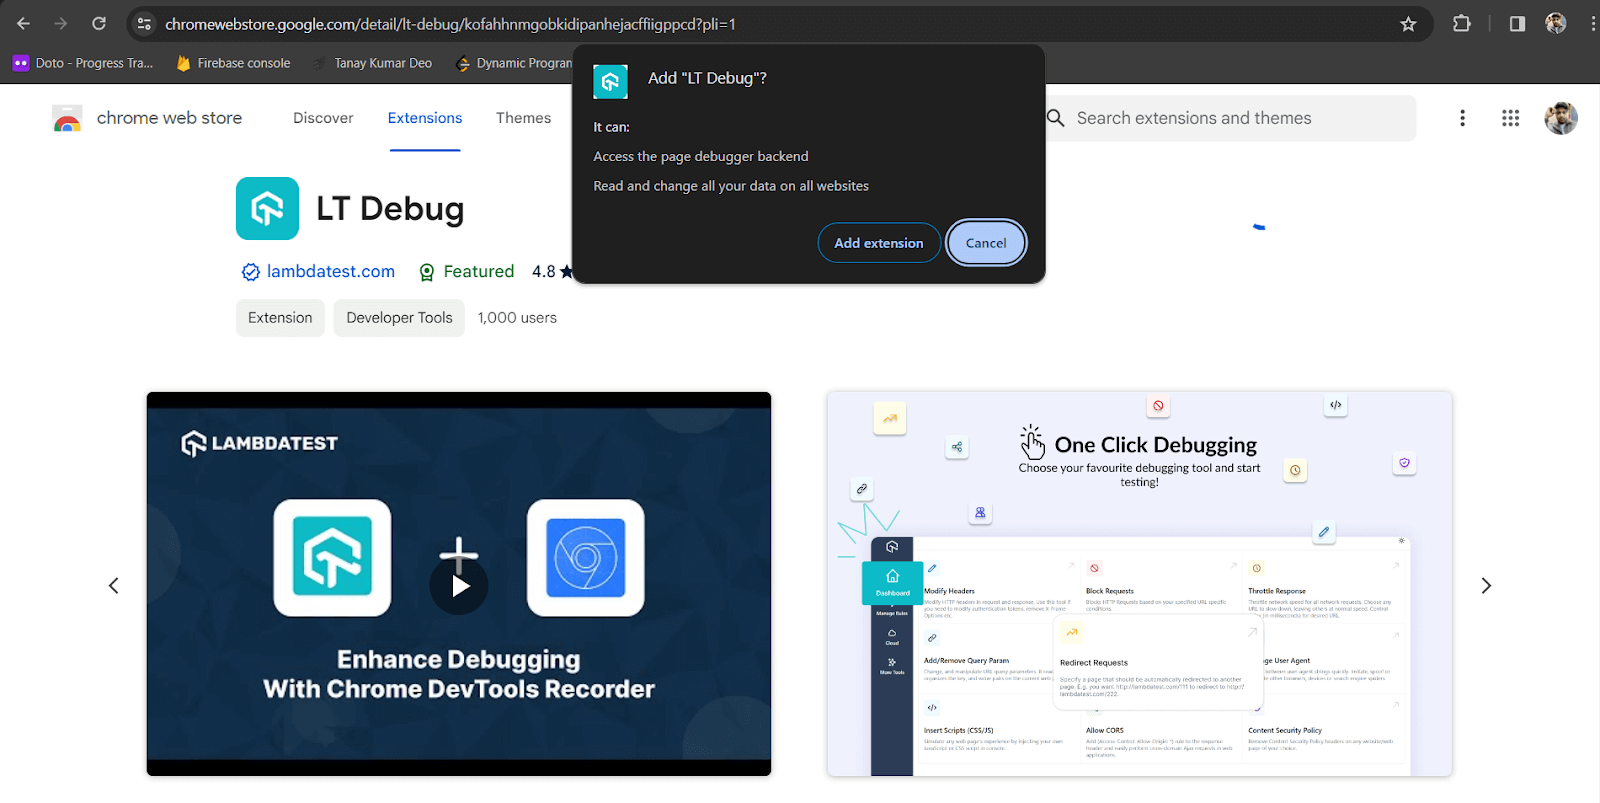
Step 3: Now press the Add to Chrome button on the top right. A pop-up will appear asking if you want to add “LT Debug” to the browser. Tap on Add extension.
Step 4: All done! Now, you can select the feature you want to use and start debugging.
Conclusion
So there you have it! This article provides a basic overview of how Chrome developer tools can be used to test and debug your web apps and how you can use developer tools to test your web apps with cloud based testing tools. We also discussed some common use cases where Chrome developer tools can greatly help the developers.
Frequently Asked Questions (FAQs)
How to open developer tools in Chrome?
To open the Chrome developer tools, developers may use three methods: a.) The easiest one is using keyboard shortcuts i.e. Ctrl + Shift + J in Windows and cmd + Option + J in Mac. b.)Open the browser menu by clicking on the three dots in the upper right corner, scroll down to the “More tools” option, and select the “Developer tools” option. c.) Right-click on the web page to debug and click on the “Inspect” option.
How to check API calls in Chrome developer tools?
The network panel in Chrome DevTools is mainly used to detect any upload or download request made by the webpage using the network. We can log and analyze all network activity in the log section. To check API requests only, we can filter out network requests of the category Fetch/XHR to check API requests.
How to check cookies in Chrome developer tools?
The application panel in Chrome developer tools is used to check and edit the cookies and other local databases stored by the website on our browser. To open the application panel, click on the Application tab in the Chrome DevTools.
How to use Chrome developer tools?
Chrome developer tools offer various functionalities for web development. It can inspect and edit HTML/CSS, debug JavaScript, analyze network activity, including API calls, manage cookies and local storage, optimize performance, and assess security aspects. The tools also integrate Lighthouse for comprehensive web page audits. Staying updated with these features enhances web development efficiency and troubleshooting capabilities


Author’s Profile
Tanay Kumar Deo
Tanay kumar deo is a skilled software developer, Upcoming SDET at GlobalLogic (A Hitachi group company). With expertise in Android and web development, he is always eager to expand his skill set and take on new challenges. Whether developing software or sharing his knowledge with others, he is driven by a desire to make a positive impact on the world around him. In addition to his technical abilities, Tanay also possesses excellent blogging and writing skills, which allow him to effectively communicate his ideas and insights to a wider audience.
Blogs: 16
Got Questions? Drop them on LambdaTest Community. Visit now


