
k6 Testing Tutorial: A Complete Guide To Browser Testing With Grafana k6
Anshita Bhasin
Posted On: July 3, 2023
![]() 150275 Views
150275 Views
![]() 31 Min Read
31 Min Read
Load testing is a type of non-functional testing that checks the application’s performance under specific loads and conditions. It involves simulating multiple users accessing an application simultaneously or sending requests to the server concurrently.
Let’s understand with an example. Imagine an eCommerce website getting ready for a major sales event, such as Black Friday, where a substantial surge in user traffic and transactions is anticipated. The website aims to guarantee seamless operation during this high-load period, aiming to avoid any system crashes or performance-related complications.
Load testing plays a crucial role in this scenario. The eCommerce website can simulate the projected user load and evaluate its performance under these circumstances. The load testing procedure entails generating load scenarios replicating real user behavior during the sale event. These scenarios may include browsing product categories, adding items to the cart, applying discount codes, and completing the checkout process. By gradually increasing the number of concurrent users and transactions, the load testing process aims to reach the anticipated peak load during the sale event.
Therefore, when it comes to ensuring optimal performance and reliability of your web application, incorporating performance testing with k6 can be a game-changer. k6 is a performance testing tool designed for the modern web.
k6 is different from other performance tools (like JMeter) in that it offers a streamlined and intuitive command-line interface, making it easy to install, configure, and execute tests. You don’t need extensive training or complex setup procedures to start with k6.
With k6, you can see comprehensive and readable test output, which makes it easier for you to understand test results and identify performance bottlenecks.
This k6 testing tutorial covers the basics of performance testing and guides you through two essential tests: one conducted on the local environment and another on the cloud platform.
TABLE OF CONTENTS
- Why is Load Testing important?
- Features of k6
- k6 Installation
- Performing Load Testing on browsers using k6
- How to write your first k6 testing script?
- Executing reporting on a local machine
- How to perform k6 testing on the cloud?
- Performing k6 testing on CI/CD: GitHub Actions
- Bonus Tips
- Frequently Asked Questions (FAQs)
Why is Load Testing important?
Load testing plays a crucial role in ensuring the stability and performance of applications under real-world usage scenarios. It helps identify performance bottlenecks, uncover stability issues, and determine the system’s capacity to handle anticipated loads.
As mentioned earlier, experiencing issues like lags and crashes can significantly impact your overall revenue, especially during critical time frames like sales and festivals. Needless to say, bad customer experience will negatively impact your brand and business!
By conducting load testing, you gain confidence in your website’s ability to handle high loads and reduce the risk of crashes, slowdowns, and customer dissatisfaction during critical sales periods.
In addition to the example, below are a few more points explaining the importance of load testing:
- Determining Capacity Limits
- Identifying Performance Bottlenecks
- Reliability and Stability
- Performance Evaluation
- User Experience Optimization
Load testing helps determine the system’s capacity limits by pushing the application to its maximum load-bearing capacity. This information is crucial for capacity planning, ensuring that the application can handle expected user loads without compromising performance or stability.
Load testing helps identify performance bottlenecks, such as slow response times, high resource utilization, or scalability issues. By pinpointing these bottlenecks, appropriate optimizations and improvements can be implemented to enhance the overall performance of the system.
Load testing validates the reliability and stability of the application by subjecting it to realistic loads. By uncovering any issues related to stability, such as crashes or resource exhaustion, load testing enables necessary optimizations to ensure a stable and robust system.
Load testing allows for evaluating an application’s performance by simulating real-life user loads. It provides valuable insights into how the application responds under different levels of concurrent user activity.
Load testing helps optimize the user experience by ensuring that the application remains responsive and performs well, even when subjected to high user loads. It helps identify areas where performance improvements can be made to enhance user satisfaction and retention.
Features of k6
Grafana k6 (previously known as Load Impact) is a modern open-source load testing tool written in GO, using which you can easily assess the performance and scalability of the applications by simulating real-life user traffic.
k6 uses JavaScript as its scripting language, which makes it highly accessible to developers and testers familiar with JavaScript. It provides a straightforward and flexible scripting interface for defining test scenarios and simulating user behavior.
Below are some of the main features of k6.
- Testing Capabilities
- Supports both Browser and API Load Testing
- Metrics and Results
- Test Execution
- Community and Support
k6 is optimized for running high-load tests such as spike tests, stress tests, and soak tests. It helps assess the reliability and performance of APIs, microservices, and websites under different load conditions.
Apart from API load testing, you can also perform browser-based performance testing using k6’s browser feature. This allows for catching issues specific to browsers and identifying performance bottlenecks related to client-side rendering and interactions. You can also integrate k6 with cloud-based digital experience testing platforms like LambdaTest to perform automated testing and get the flexibility to run your test on different OS and browser (Chromium) versions.
Visit our support documentation to get started with k6 testing with LambdaTest.
You can go through the below video on the k6 testing tutorial.
Subscribe to our LambdaTest YouTube Channel to get the latest updates on tutorials around Selenium testing, Cypress testing, and more.
k6 offers comprehensive metrics and results both during and after the execution of the test. It captures information such as response times, throughput, error rates, and latency, allowing you to analyze and interpret the performance of their application under different load scenarios.
k6 supports command-line execution and integration into existing Continuous Integration (CI) pipelines like GitHub Actions/Jenkins. This enables accelerated feedback, ensuring timely insights and improvements.
k6 has an active and growing community of users and contributors with 20.7k Stars and 1.1k Forks on GitHub. There is extensive documentation available, including guides, examples, and a knowledge base, to help users get started and troubleshoot any issues they may encounter.
 Note
NotePerform k6 testing on over 3000+ environments. Try LambdaTest Today!
k6 Installation
k6 installation is very easy compared to other tools available in the market. With just a single command, the installation process is completed, eliminating the need to deal with multiple extensions. Now, let’s learn the process of k6 installation on different operating systems.
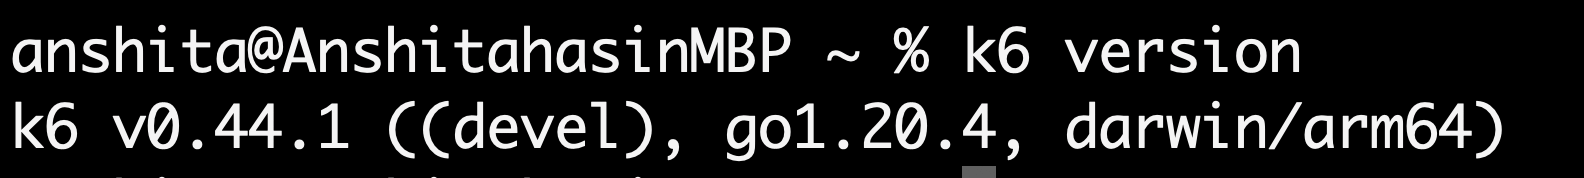
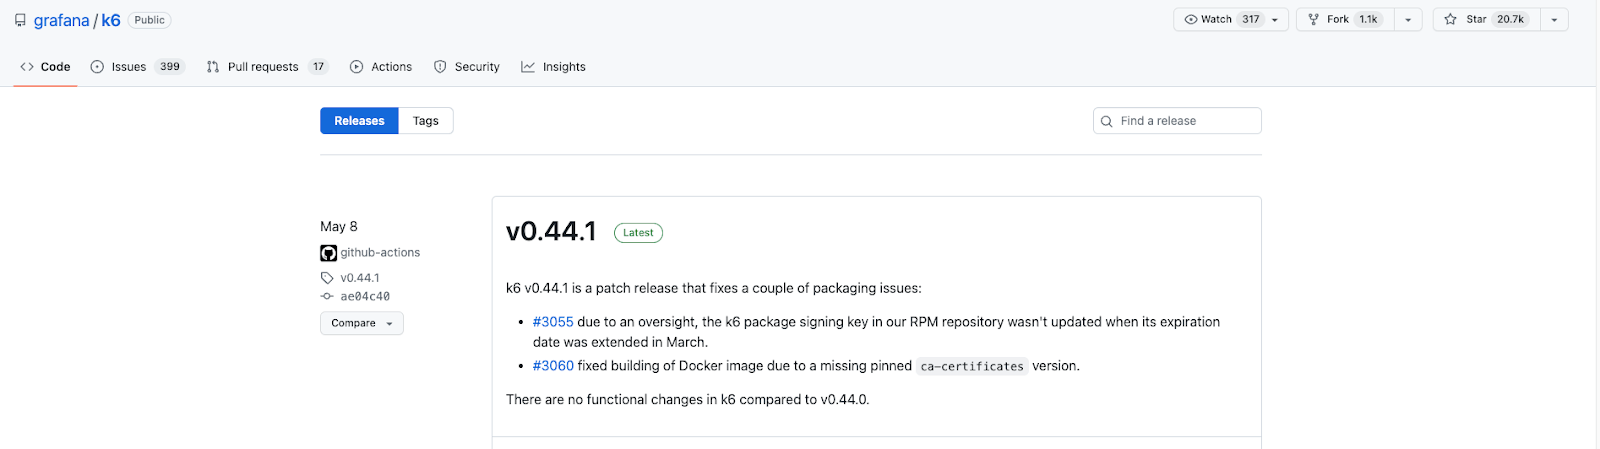
At the time of writing this k6 testing tutorial, the current version of k6 is v0.44.1.
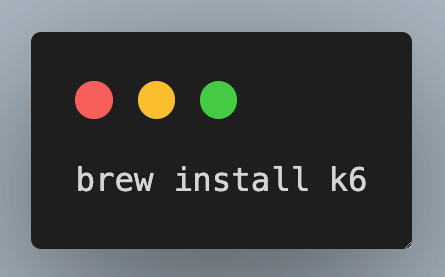
Mac
To install on Mac, use the below command.
Windows
To install on Windows, run the below command (if you are using Windows Package Manager).
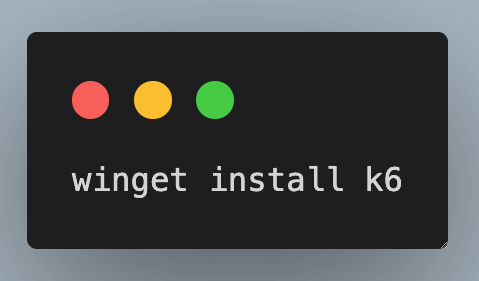
Or click on the link for the direct installation.
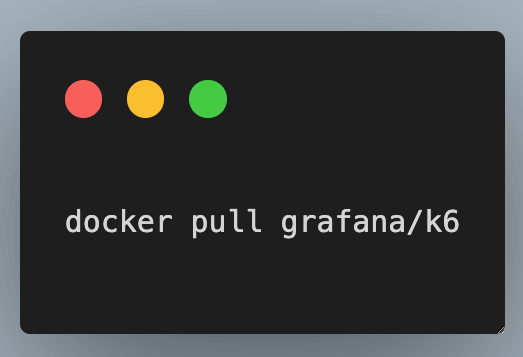
Installation using Docker
Once you have downloaded k6, run the command k6 version on the terminal/command prompt to verify the installation.
Below is the screenshot from the official k6 GitHub Repo where you can verify the latest version of k6.
You can also use k6 Test Builder (same as JMeter) for the graphical interface to generate a k6 testing script based on your input, but the current k6 testing tutorial is focussed on scriptable and code-based sections of k6.
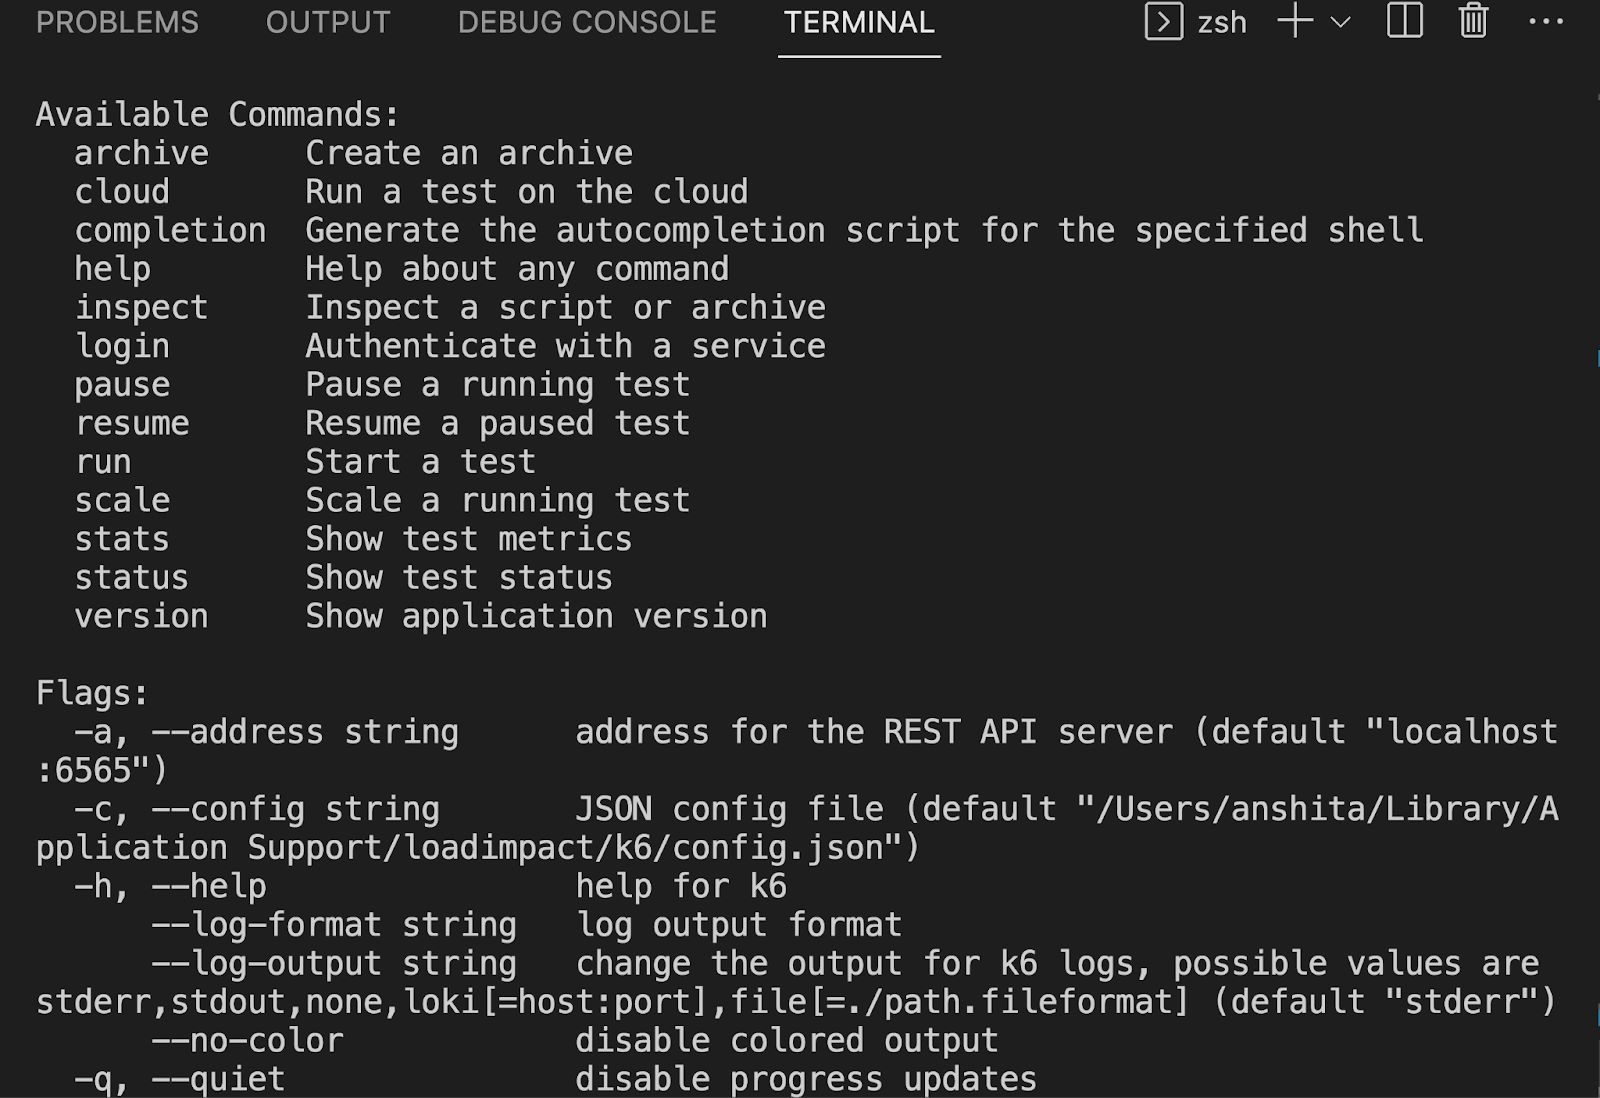
To know about all available k6 commands, enter the command k6--help in the terminal/command prompt.
Performing Load Testing on browsers using k6
Browser testing is a valuable approach to evaluate performance at the browser level and assess user experience. It allows you to discover issues that might remain unnoticed if you only conduct testing at the backend level.
In addition to the API load testing, k6 can also be effectively utilized for browser testing. This valuable approach enables the evaluation of performance at the browser level and provides insights into the user experience. By incorporating browser testing into your testing strategy, you can uncover potential issues that may go unnoticed if testing is solely conducted at the backend level.
Below are the key benefits of doing performance testing on browsers.
- Understanding Frontend Impact
- Measuring Page Load Time
- Ensuring Interactivity
- Identifying Slow-loading Elements
Browser testing aids in evaluating the responsiveness of the front end of your application by simulating numerous concurrent requests from APIs. It provides insights into how the user interface performs under high-load conditions.
Browser-level testing allows you to gather metrics specific to browsers, such as the Total Page Load Time, Time to Interaction (TTI), and Speed Index. This information helps you evaluate the speed at which your web pages are rendered and identify potential bottlenecks that impact user experience.
Additionally, browser testing can incorporate the evaluation of Core Web Vitals, a set of specific metrics defined by Google to measure key aspects of user experience. These metrics include Largest Contentful Paint (LCP), which measures how long it takes for the largest element of a page to load, First Input Delay (FID), which measures the responsiveness of a webpage on first user interactions, and Cumulative Layout Shift (CLS), which quantifies the visual stability of a page ensuring that elements don’t unexpectedly move or shift.
By integrating Core Web Vitals into your browser testing approach with k6, you can gain a deeper understanding of how these vital performance metrics impact user experience.
The purpose of browser testing is to confirm that all elements on the front end of your application function as intended, allowing for seamless user interaction with buttons, forms, dropdowns, and other interactive components.
Through browser testing, you can detect loading spinners or other elements that may take an excessive amount of time to disappear. By observing these insights, you can optimize the elements leading to improving the overall user experience. By taking proactive measures to address these issues, you can ensure a smoother and more enjoyable browsing experience for your users.
How to write your first k6 testing script?
By now, you must have understood why we should perform load testing on the browser. Now, it’s time to write our first k6 testing script.
Prerequisite: To use the k6 browser test, ensure you use version v0.43 and above.
Before version v0.43, there was a need to download the k6 extension for writing browser tests, but with the release of version 0.43, k6 has added an experimental module for xk6-browser, which means you can write browser tests without using external extensions.
At the time of writing this k6 testing tutorial, k6 browser is an experimental module that supports browser automation through the Chrome Devtools Protocol (CDP). By seamlessly integrating browser-level APIs, it facilitates smooth interaction with browsers and enables the collection of frontend performance metrics while performing k6 testing.
Now, let’s write a k6 testing script for the login flow, where we will perform the load testing with five virtual users and for ten iterations. In the test case, we will see both flows for the passed test case and failed test case so that when your test fails, you know what error you get in the command prompt.
Test Case
|
Implementation
Paste the below code in the IDE of your choice and save it as filename.js.
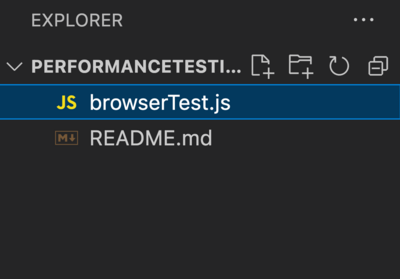
Example => browserTest.js

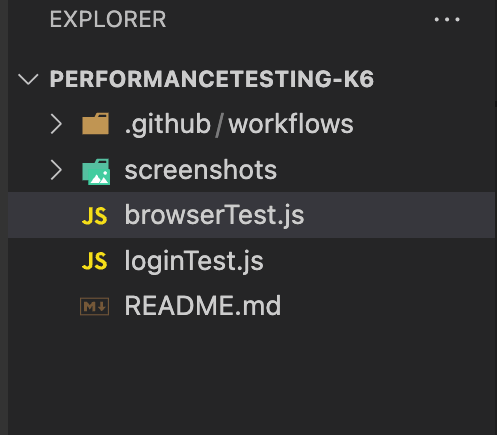
Folder Structure
In k6, the folder structure for a test script named browserTest.js typically follows a common convention. Here’s an example of a possible folder structure for the browserTest.js script:
Code Walkthrough
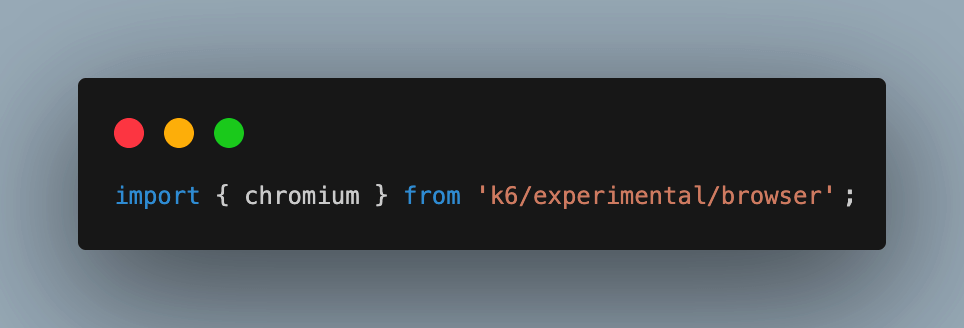
Step 1
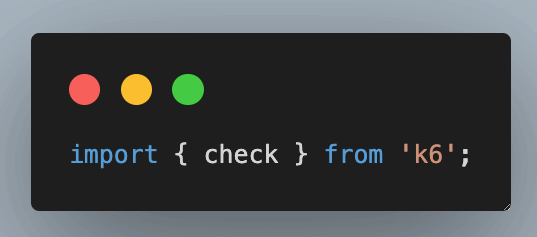
The first line imports the chromium object from the k6/experimental/browser module, which allows you to launch a Chromium browser for browser-based testing.
The second import is the check function, which is imported from the k6 module, and is used to perform assertions during the test execution.
Step 2
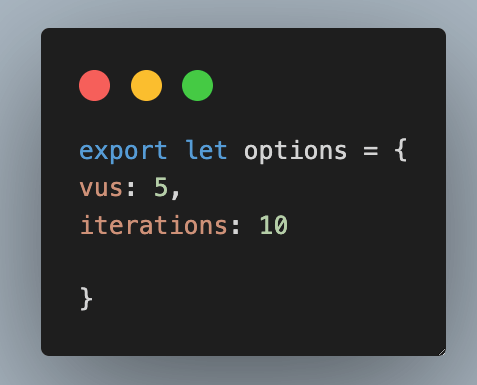
The options object is used to configure the execution of your k6 testing script. Let’s understand each property in detail.
vus
This property specifies the number of virtual users (VUs) that will be simulated during the test. In this case, it is set to 5, meaning that there will be 5 virtual users executing the test concurrently. Each virtual user will simulate a separate user interacting with the target system, i.e., LambdaTest eCommerce playground in our case.
iterations
This property determines the number of iterations or times each virtual user will execute the test script. In the above example, it is set to 10, indicating that each virtual user will repeat the test script 10 times during the test execution.
Step 3
The test function is defined using the export default syntax, which serves as the main entry point for the test execution.
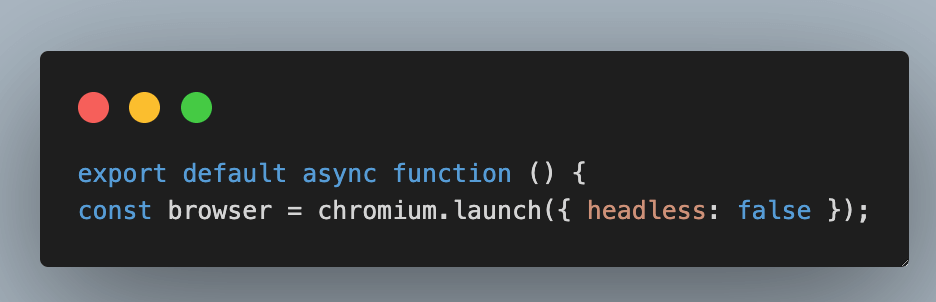
Step 4
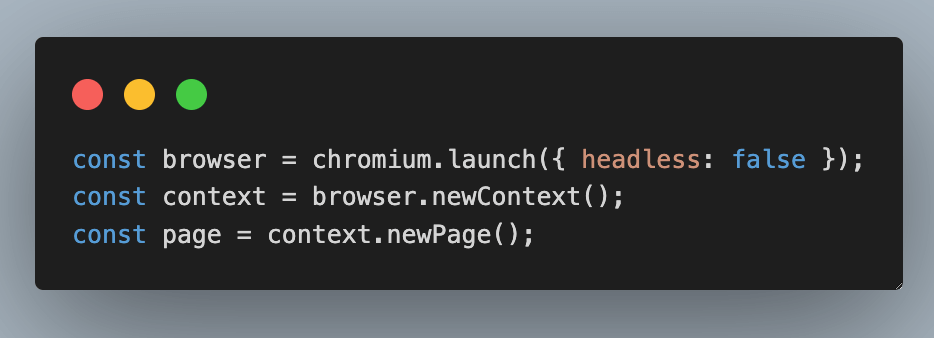
Within the test function, a new Chromium browser instance is launched using chromium.launch({ headless: false }). The headless: false option is used to open a browser in non-headless mode, i.e., you would be able to see the browser window during the test execution.
A new context and page are created within the browser using browser.newContext() and context.newPage() respectively.
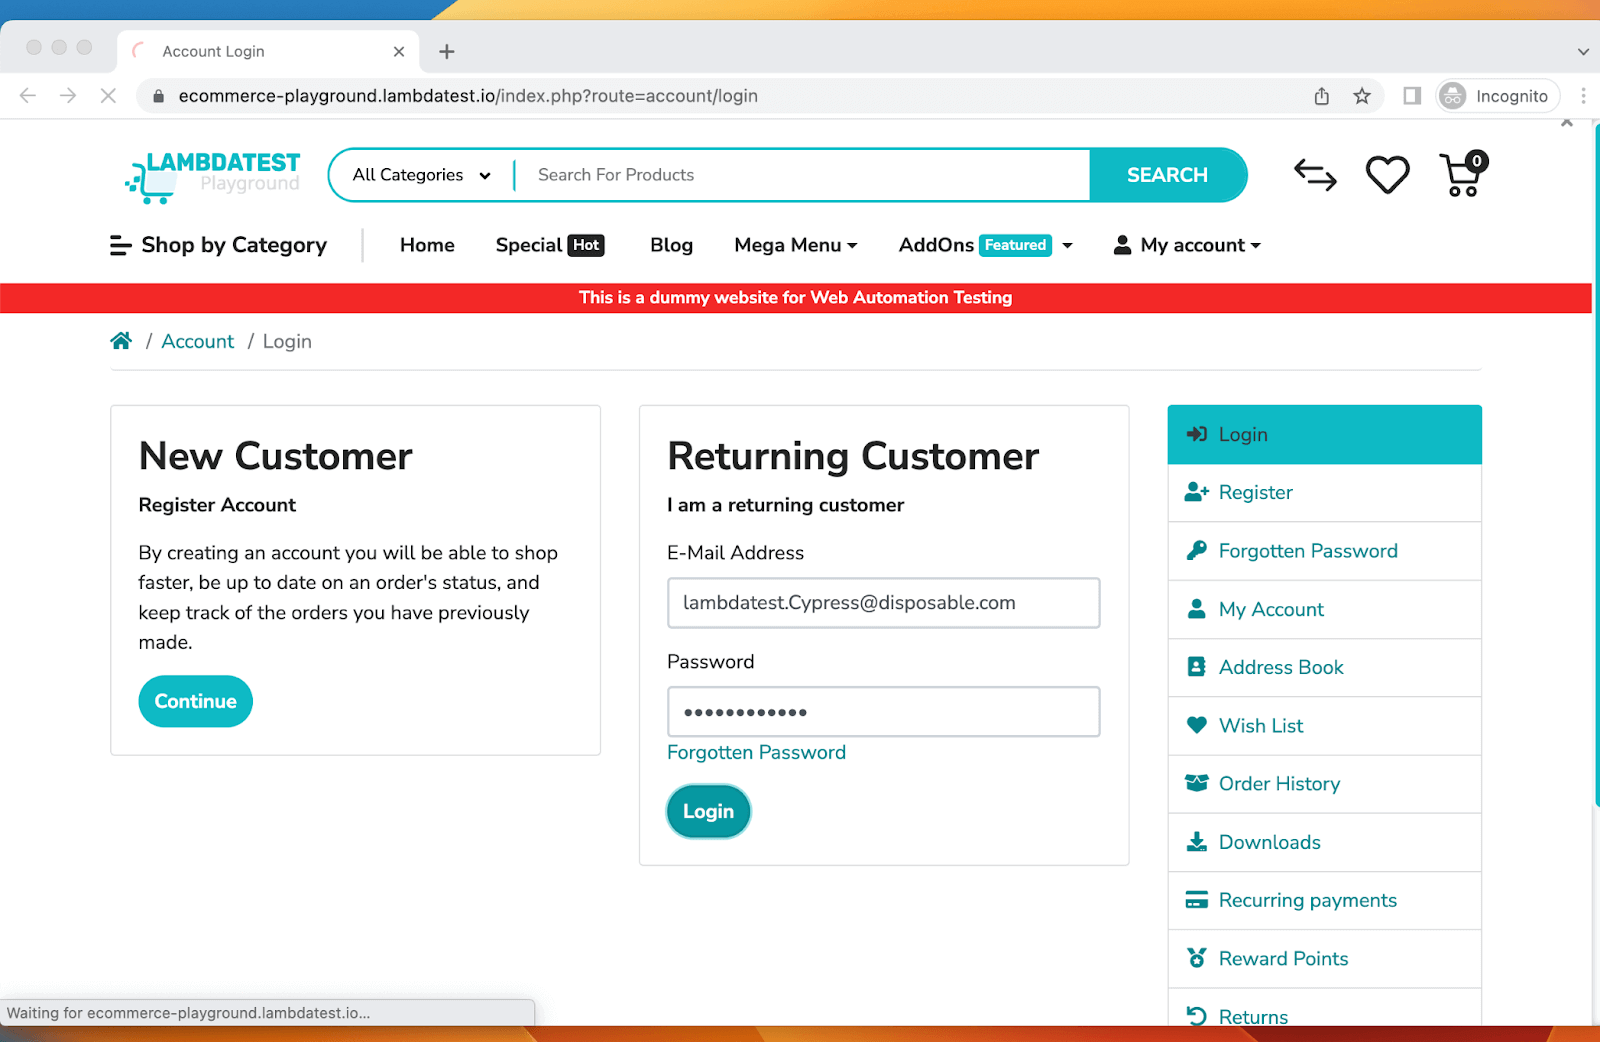
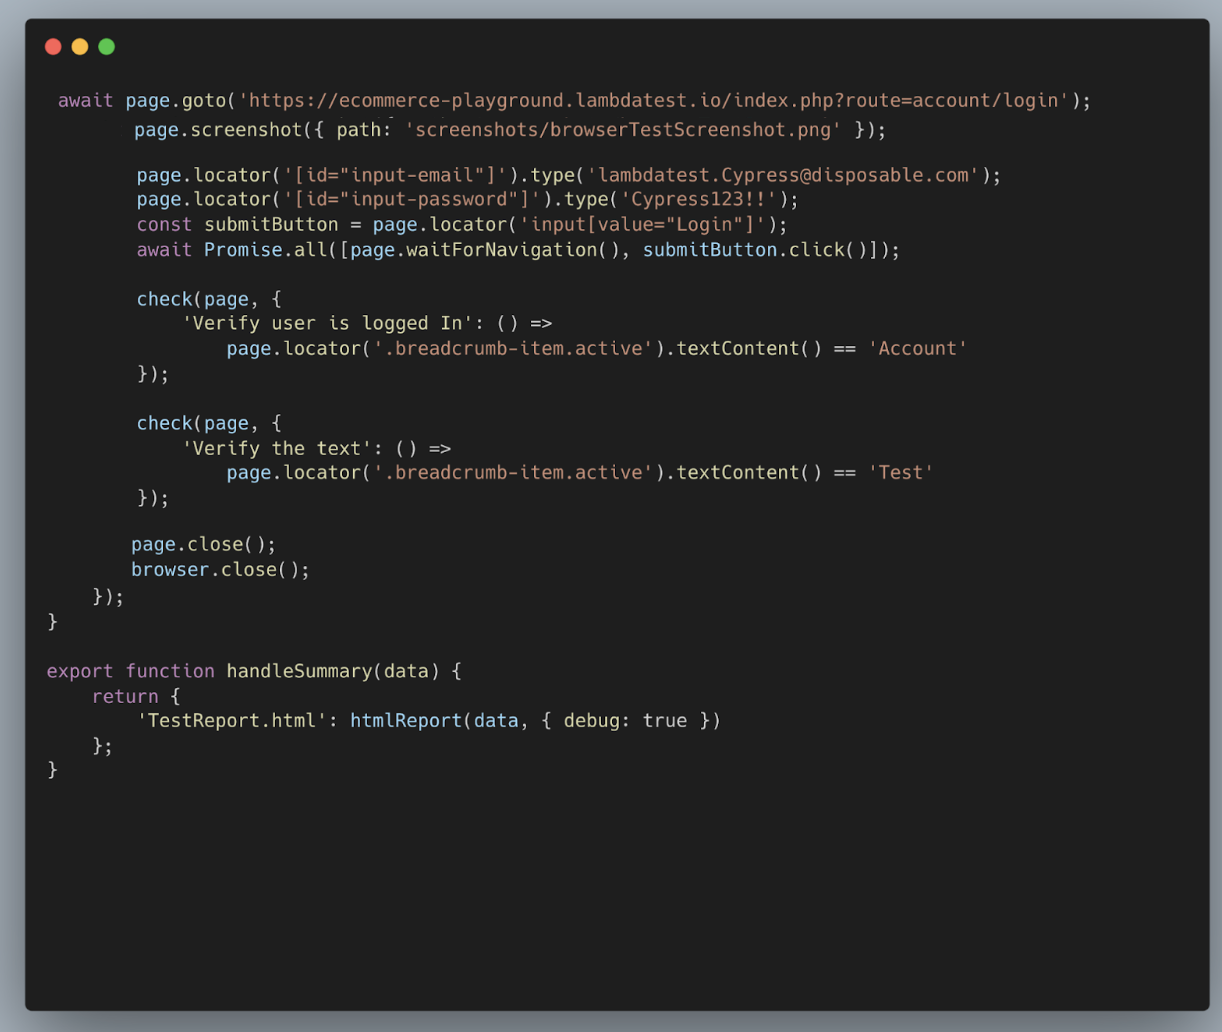
Step 5
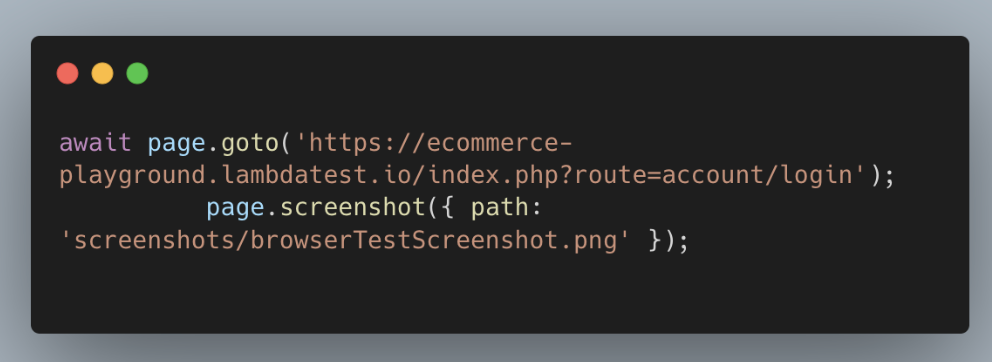
Using the await page.goto() function, the page is directed to the designated URL https://ecommerce-playground.lambdatest.io/index.php?route=account/login. Following that, the page.screenshot() command captures a screenshot of the page, which is then saved as screenshots/browserTestScreenshot.png.
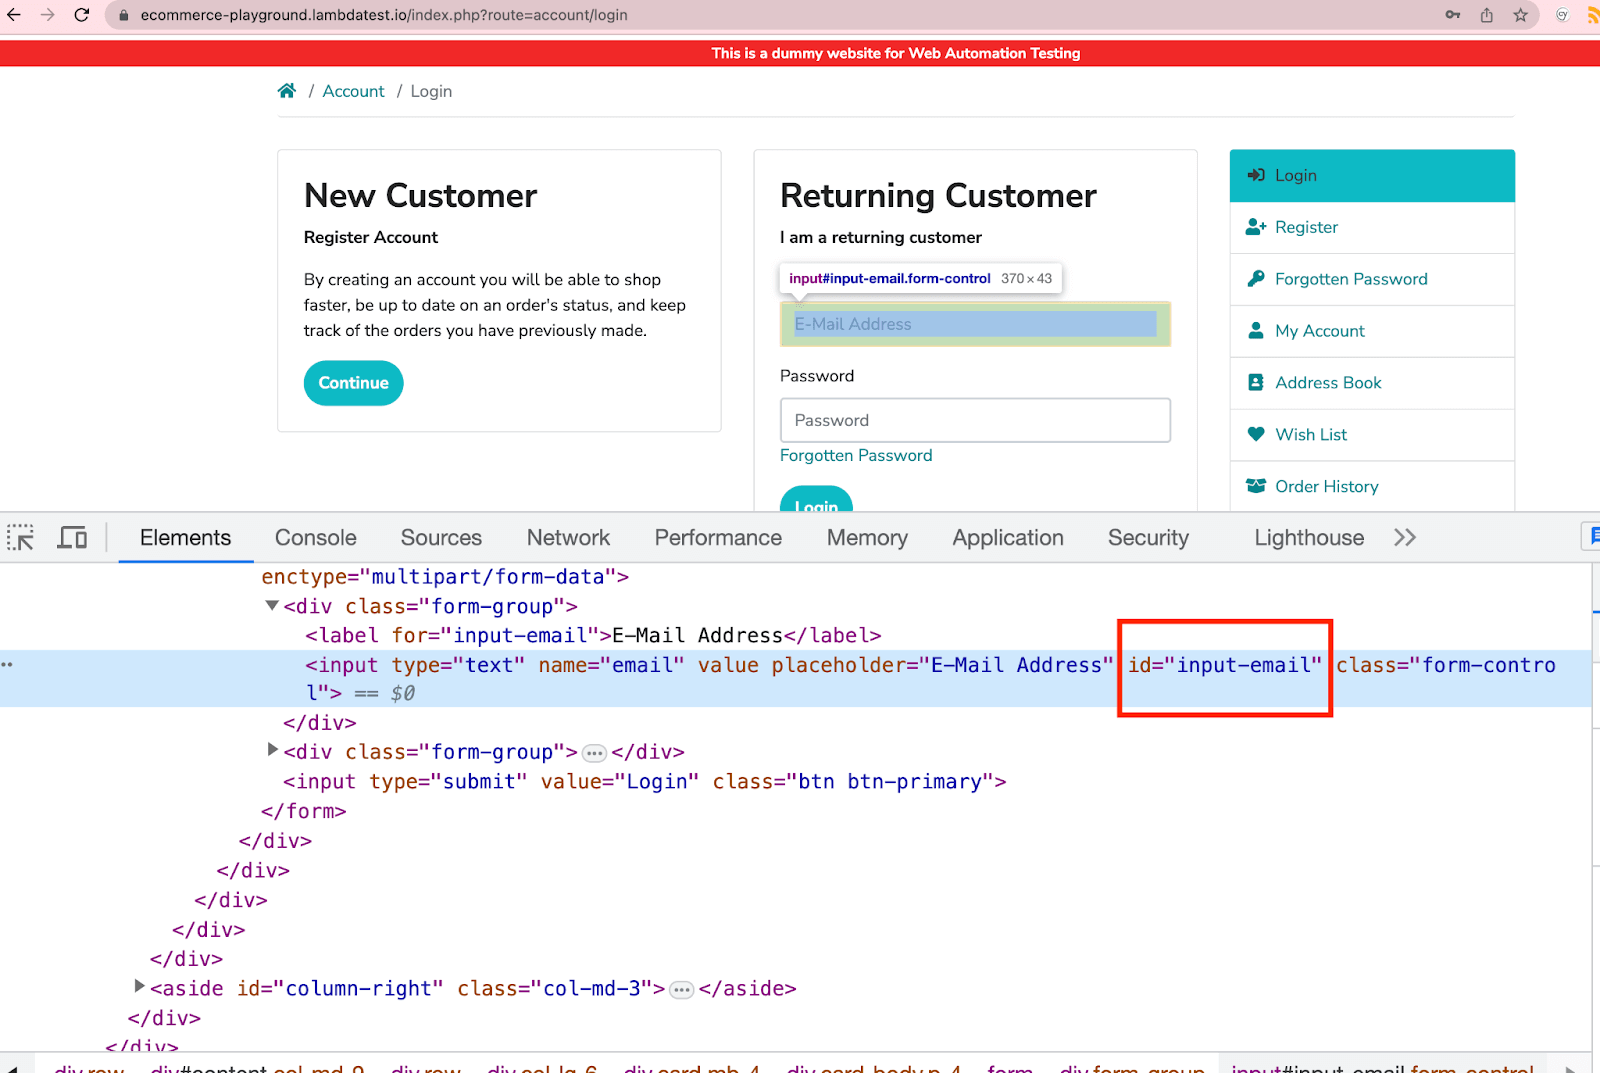
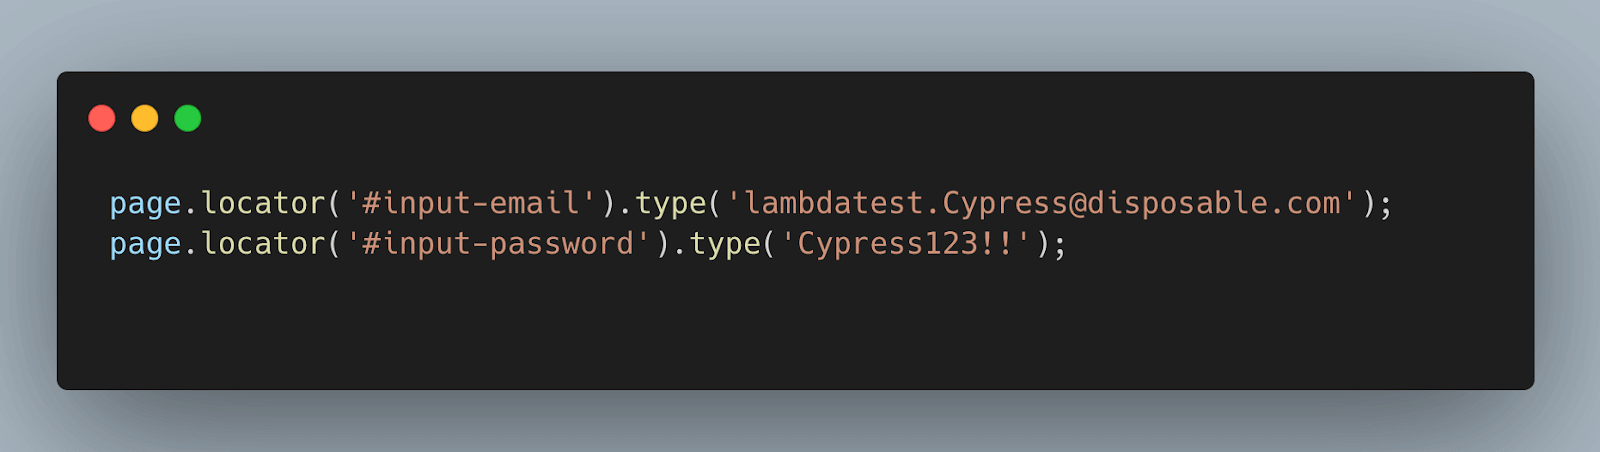
Step 6
The email and password fields are located using their respective locators (using Id – just like shown below) and populated with the provided values.
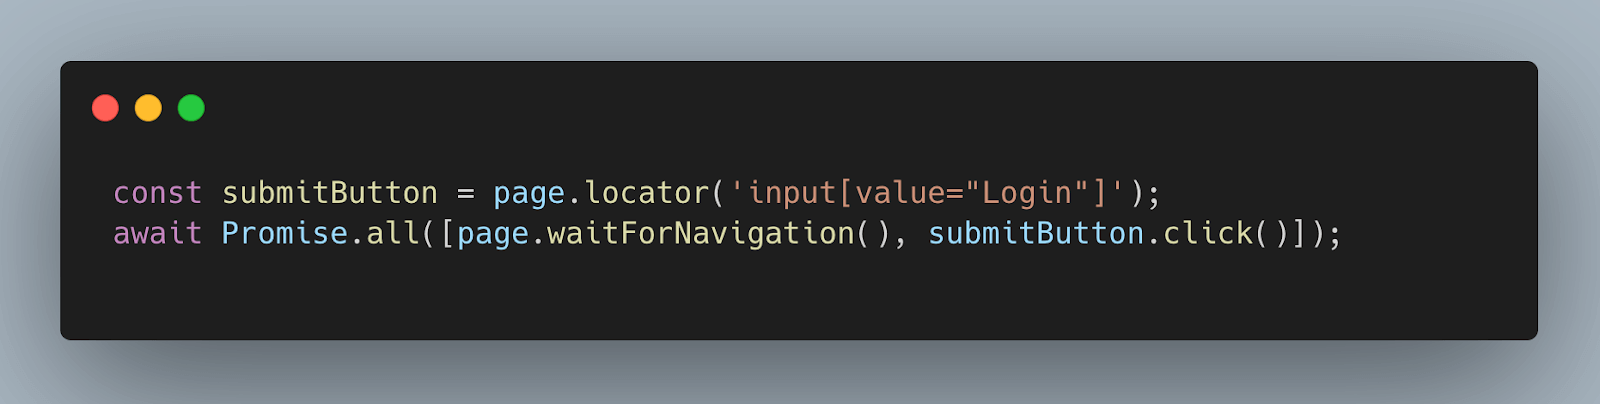
The login button is located and stored in the submitButton variable. The Promise.all() function is used to wait for both the page navigation and the submitButton click to complete.
Step 7
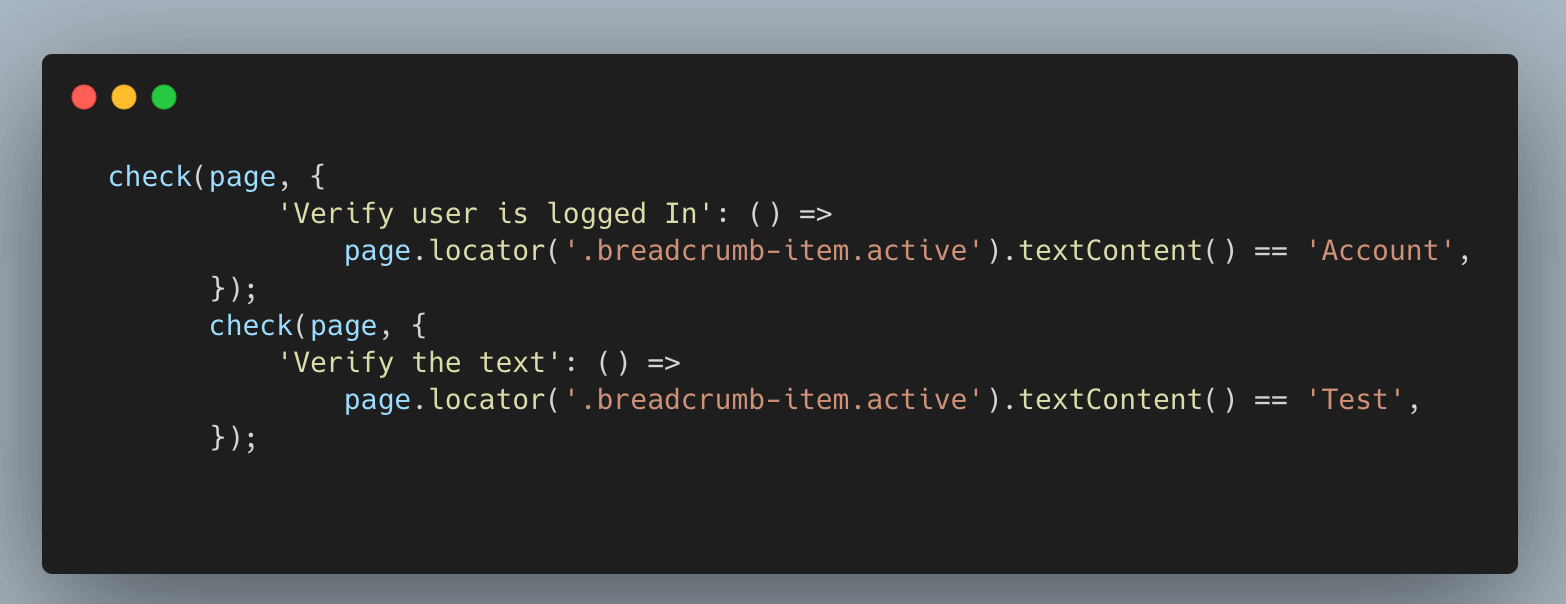
The code contains two check statements. The first one represents the happy scenario, where it checks for a matched element. The purpose of the second check statement is to intentionally test the negative scenario by deliberately providing an invalid value. This is done to showcase the expected behavior in the event of a test case failure.
The first check() function checks if the text content of the element with the class breadcrumb-item.active is equal to Account.
The second check() function is used to assert if the text content of the element with the class breadcrumb-item.active is equal to the Test.
It is important to note check doesn’t halt the execution in case of any test failure.
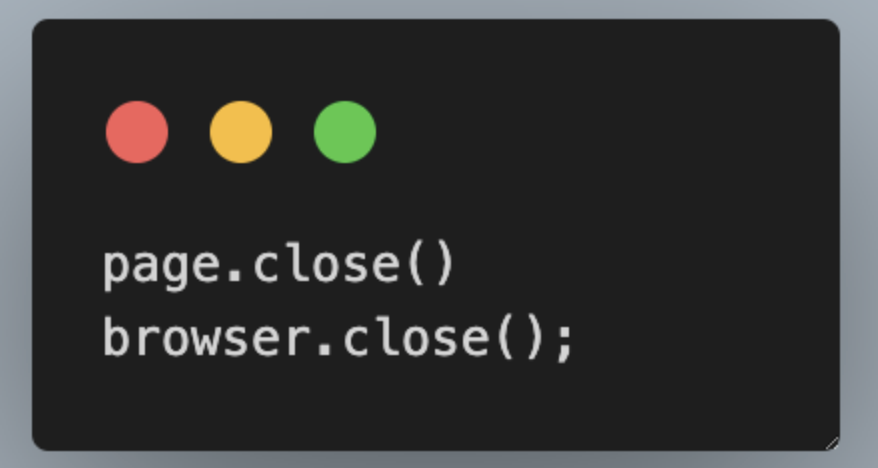
Step 8
The below code closes the page and browser, ensuring proper cleanup after the test execution.
Overall, the above code launches a Chromium browser, navigates to a login page, fills in the email and password fields, submits the form, and verifies that the user is successfully logged in.

Execution
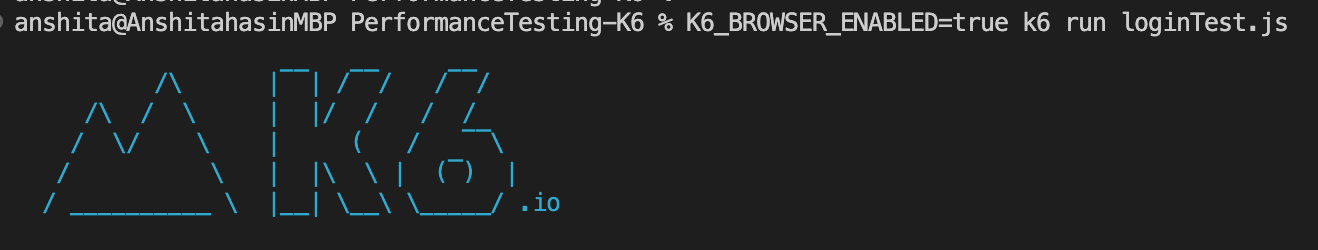
The above login test case will be executed for 5 virtual users and 10 iterations. To perform k6 testing, you need to be in the same directory as your test case. Just navigate to the terminal and execute the following command.
|
1 |
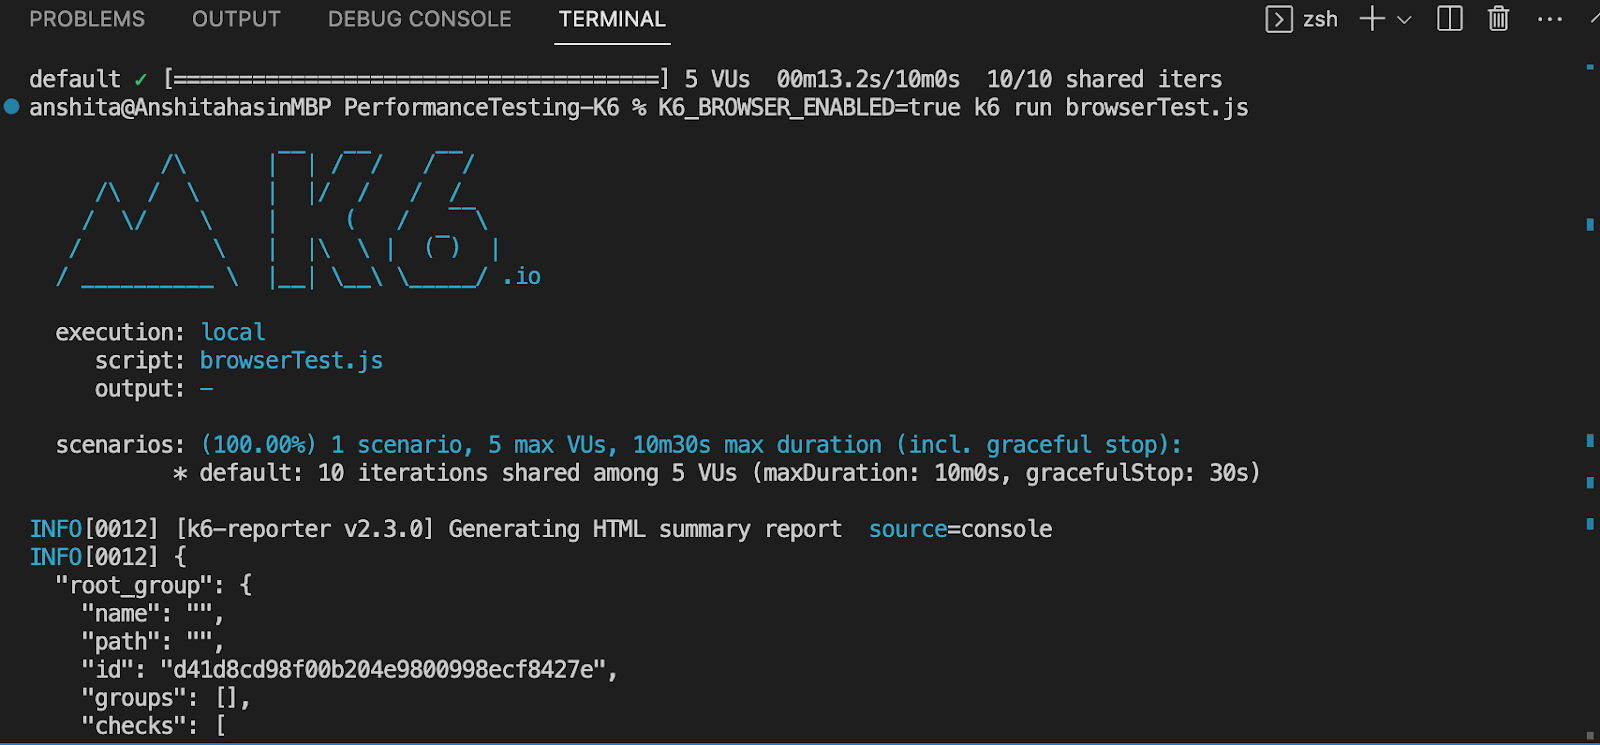
K6_BROWSER_ENABLED=true k6 run browserTest.js |
It is important to know the above configuration K6_BROWSER_ENABLED=true is only required for browser testing and not for API Testing. For API testing, you can run directly using k6 run testFile.js
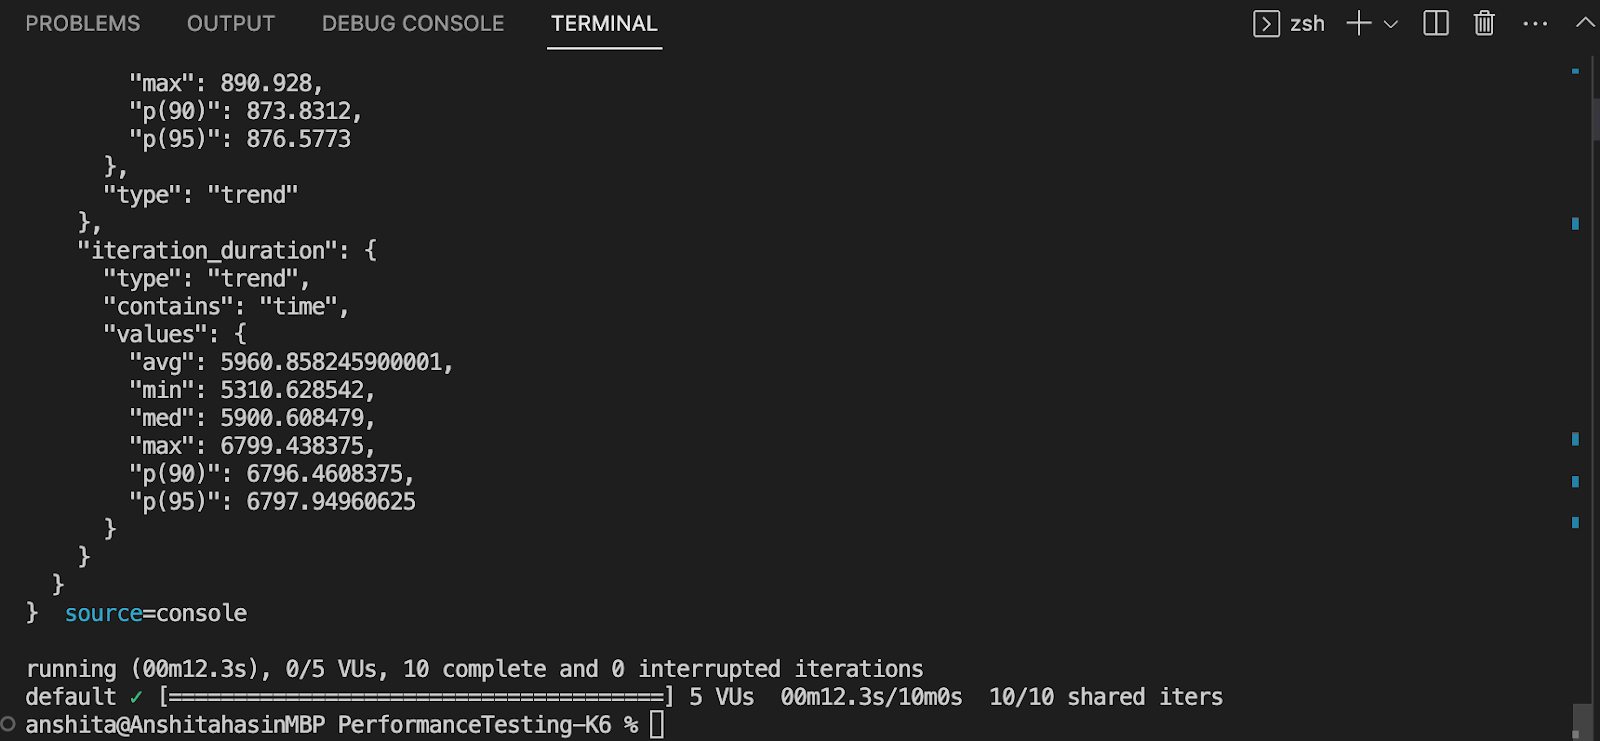
Terminal
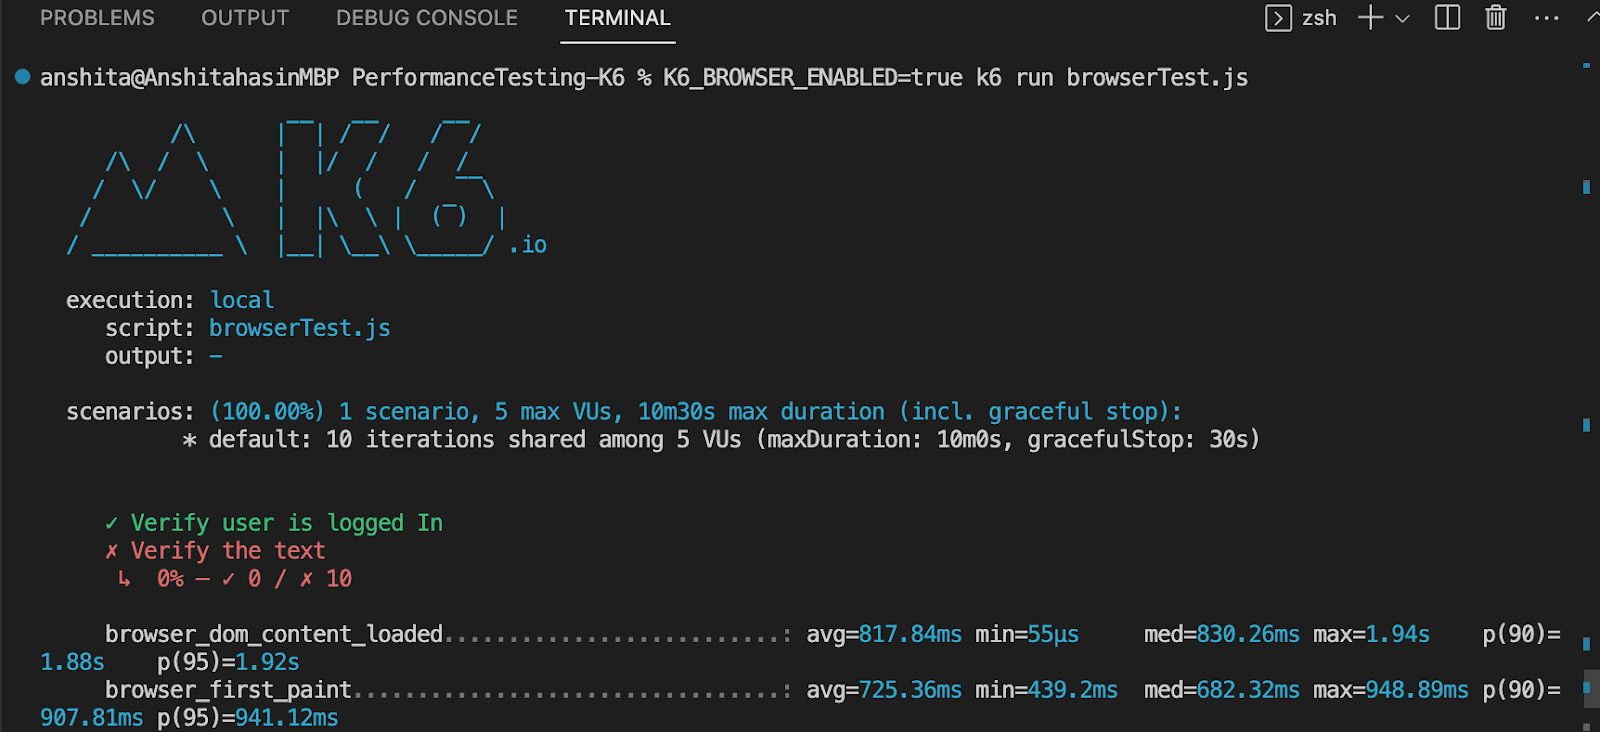
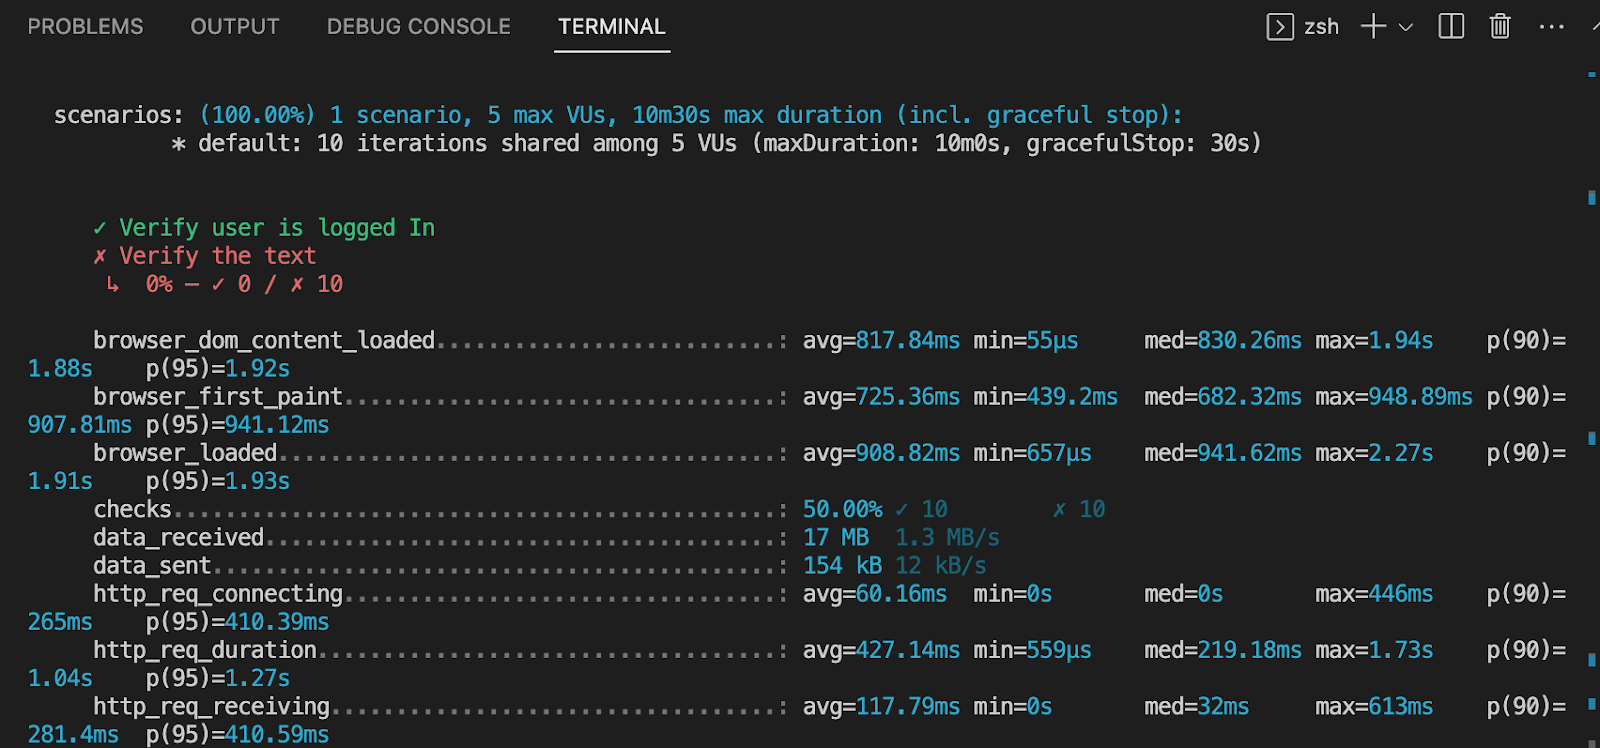
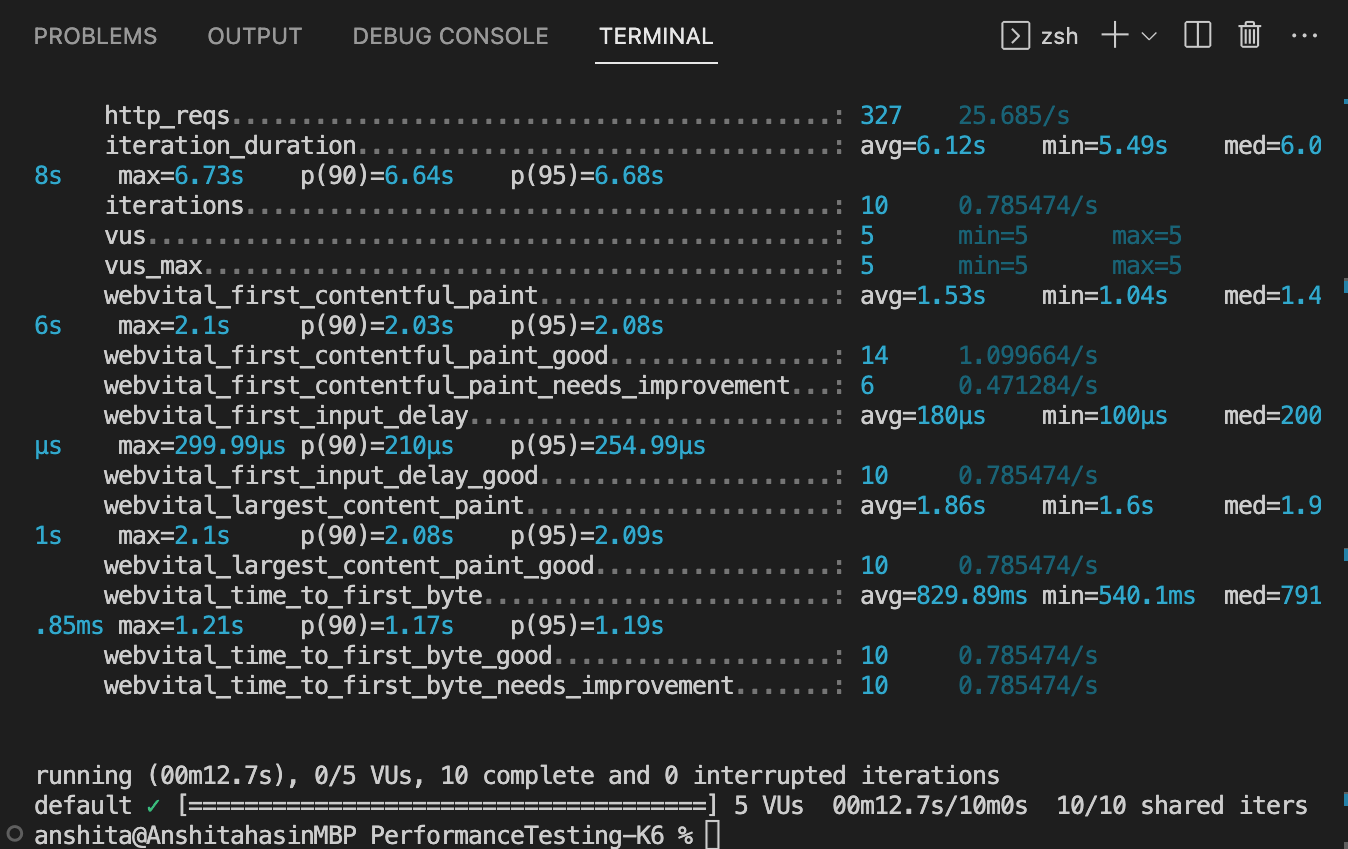
After running the command, you will see the browser launched and performing all the actions on the page, as mentioned in the test case.
Executing reporting on a local machine
Reporting is an essential aspect of testing as it provides a summary of the test results with a visual representation of test data, such as graphs and charts. It also serves as a means of communication and collaboration among team members.
You can share test reports with your team members or your management and discuss the performance issues, if there are any, based on the report. Adding reporting enhances your ability to analyze, communicate, and optimize the performance of your application.
In k6, you can get the HTML Report using k6 HTML Report Exporter v2, which generates a file containing the test summary data of the test after your test execution is completed.
Implementation
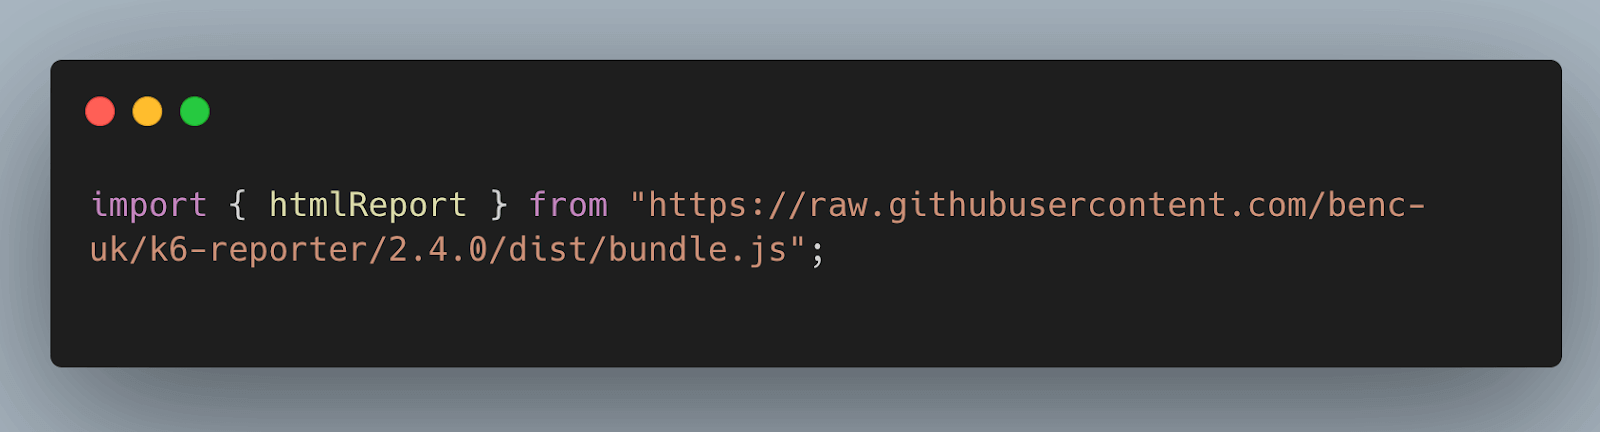
Step 1
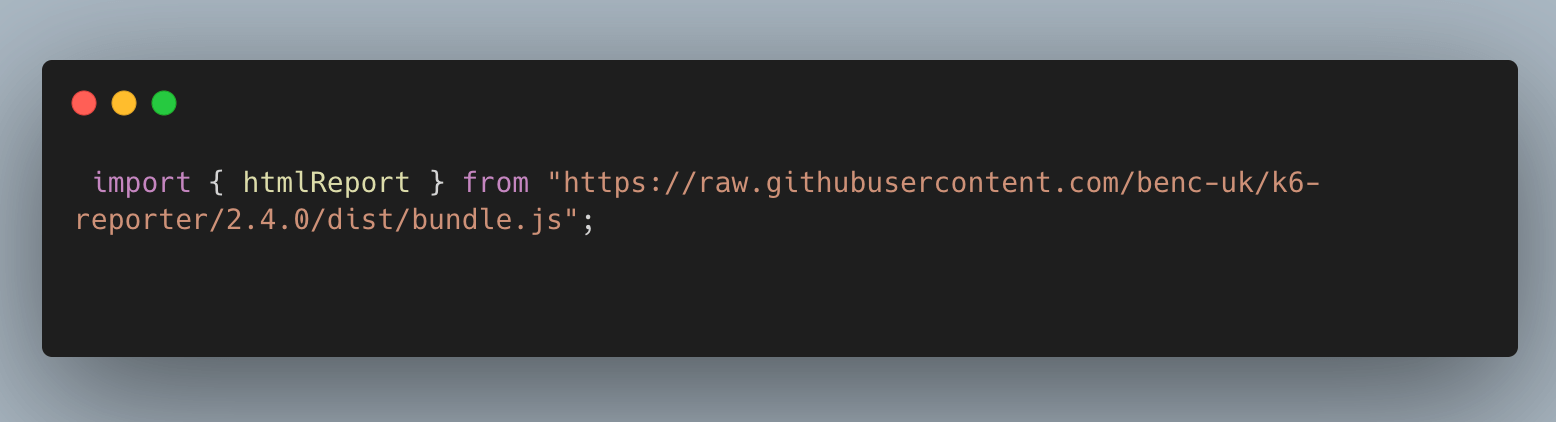
Import the htmlReport function from the bundled module hosted remotely on GitHub.
|
1 |
import { htmlReport } from "https://raw.githubusercontent.com/benc-uk/k6-reporter/main/dist/bundle.js"; |
To run it on a specific version, it is advisable to change main with the exact version number tag (e.g., 2.4.0) just like shown below in the screenshot.
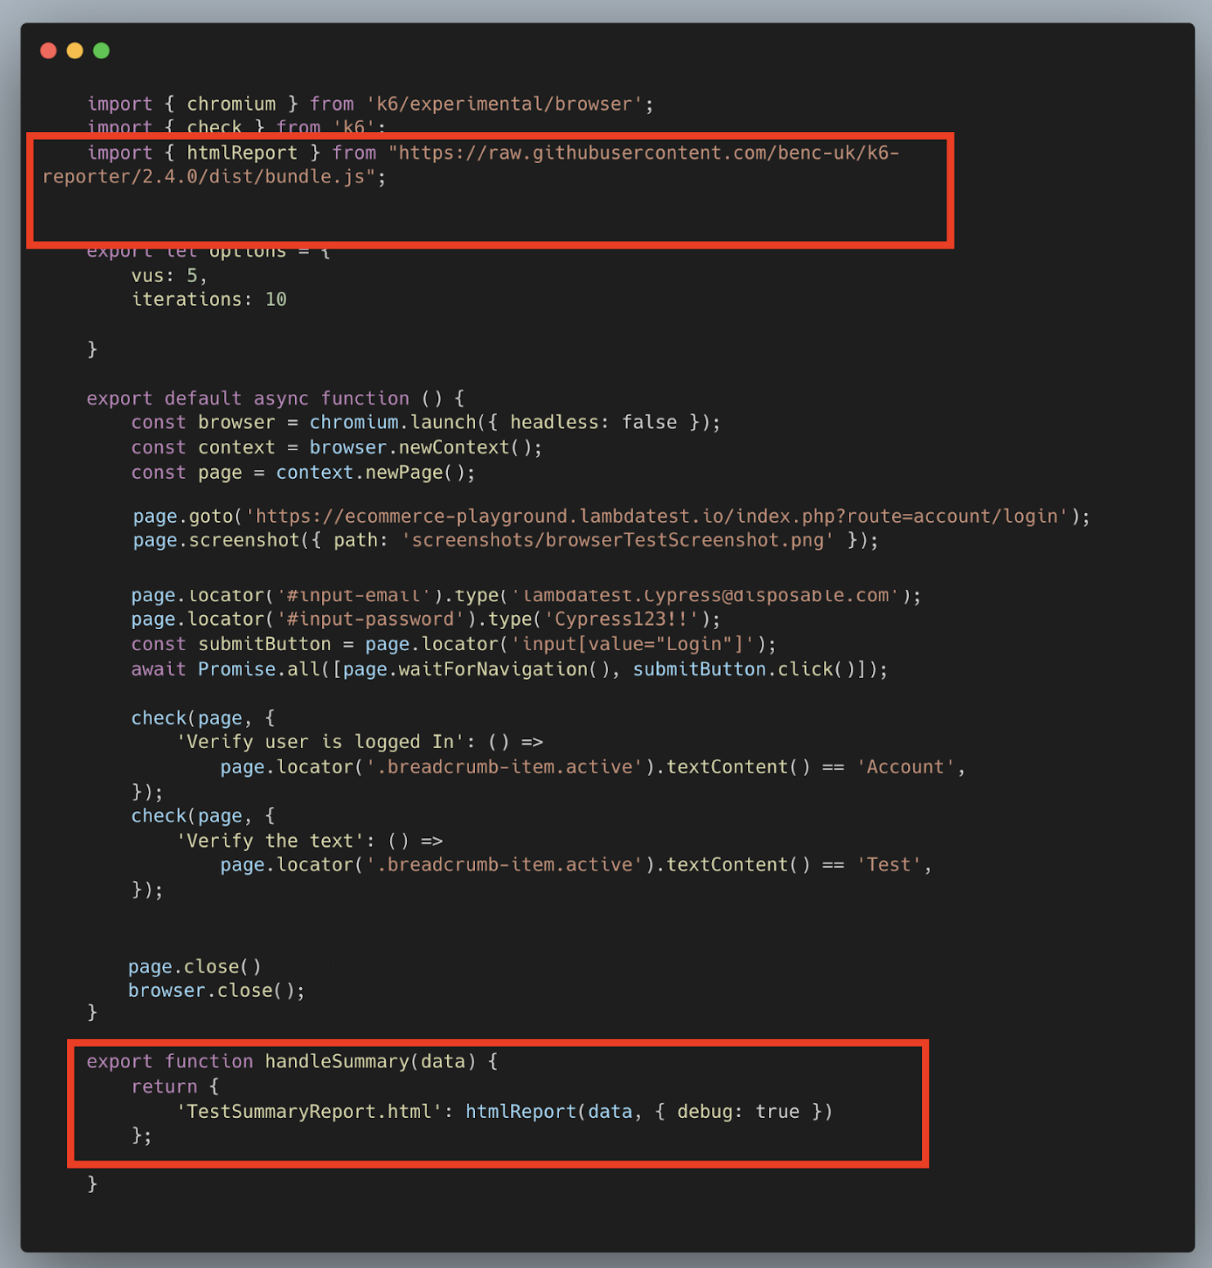
Step 2
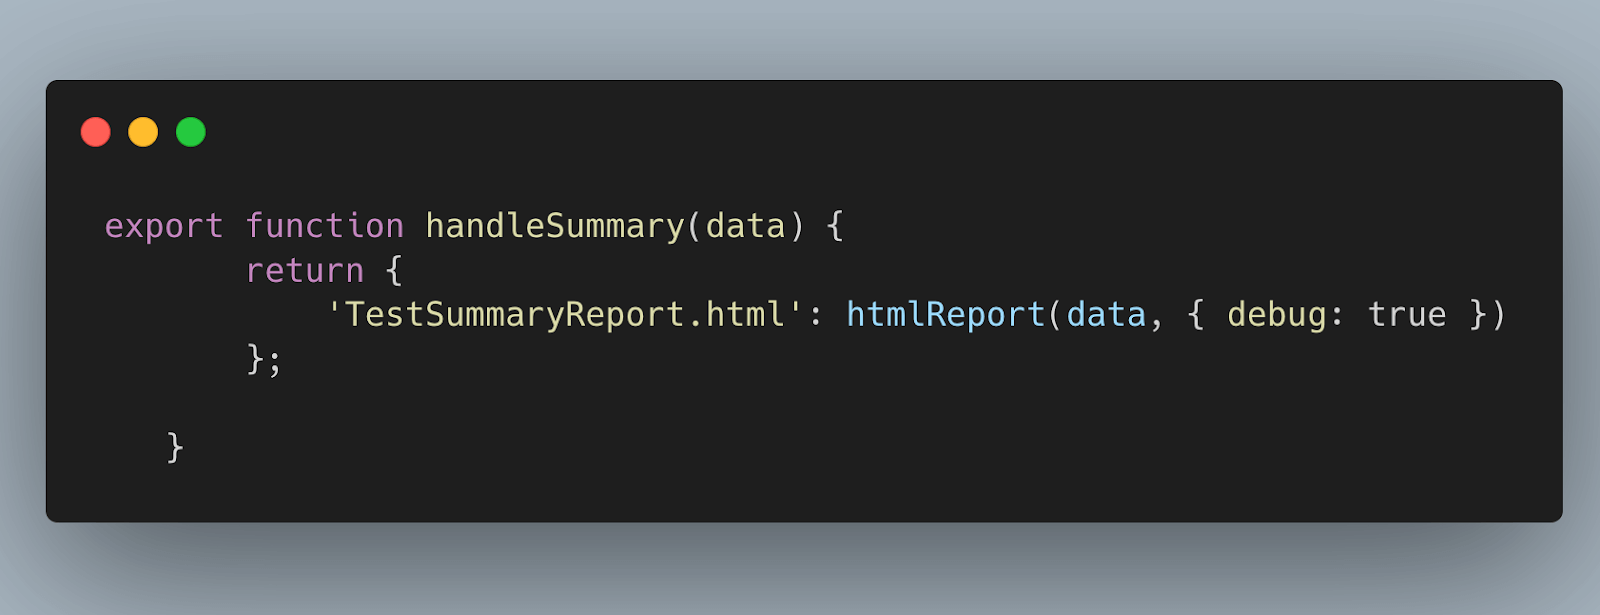
Add the below code just outside the default function and wrap it with the function handleSummary(data), which k6 calls at the end of any test, as follows:
|
1 2 3 4 |
export function handleSummary(data) { return { 'TestSummaryReport.html': htmlReport(data, { debug: true })}; } |
After importing the above code, your end to end test file would look like below
Code Walkthrough
Step 1
The below code imports the htmlReport function from the k6-reporter module hosted on GitHub. The module version specified in the URL is 2.4.0. (it might change in the future based on the version available at that time).
Step 2
The below code contains a handleSummary function that takes the data parameter. This function is used in k6 to generate a summary report at the end of the test run. Upon running k6 testing and its completion, the handleSummary function is invoked automatically.
Inside the handleSummary function, an object is returned with a key-value pair. The key ‘TestSummaryReport.html’ represents the filename that will be used for the generated HTML report.
The htmlReport function is invoked with two arguments: data and an options object {debug: true}. The data parameter contains the test data that will be used to generate the report. The debug: true option is passed to enable debugging mode in the report.
Execution
To execute the above code, go to the terminal and run the below command.
|
1 |
K6_BROWSER_ENABLED=true k6 run browserTest.js |
In this case, the execution command remains the same.
Once your test is executed completely (pass or fail), a report will be generated at the root level of your project with the name passed in the test script. In this case, the report would be saved by the name TestSummaryReport.html.
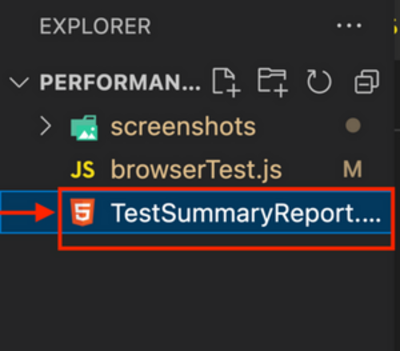
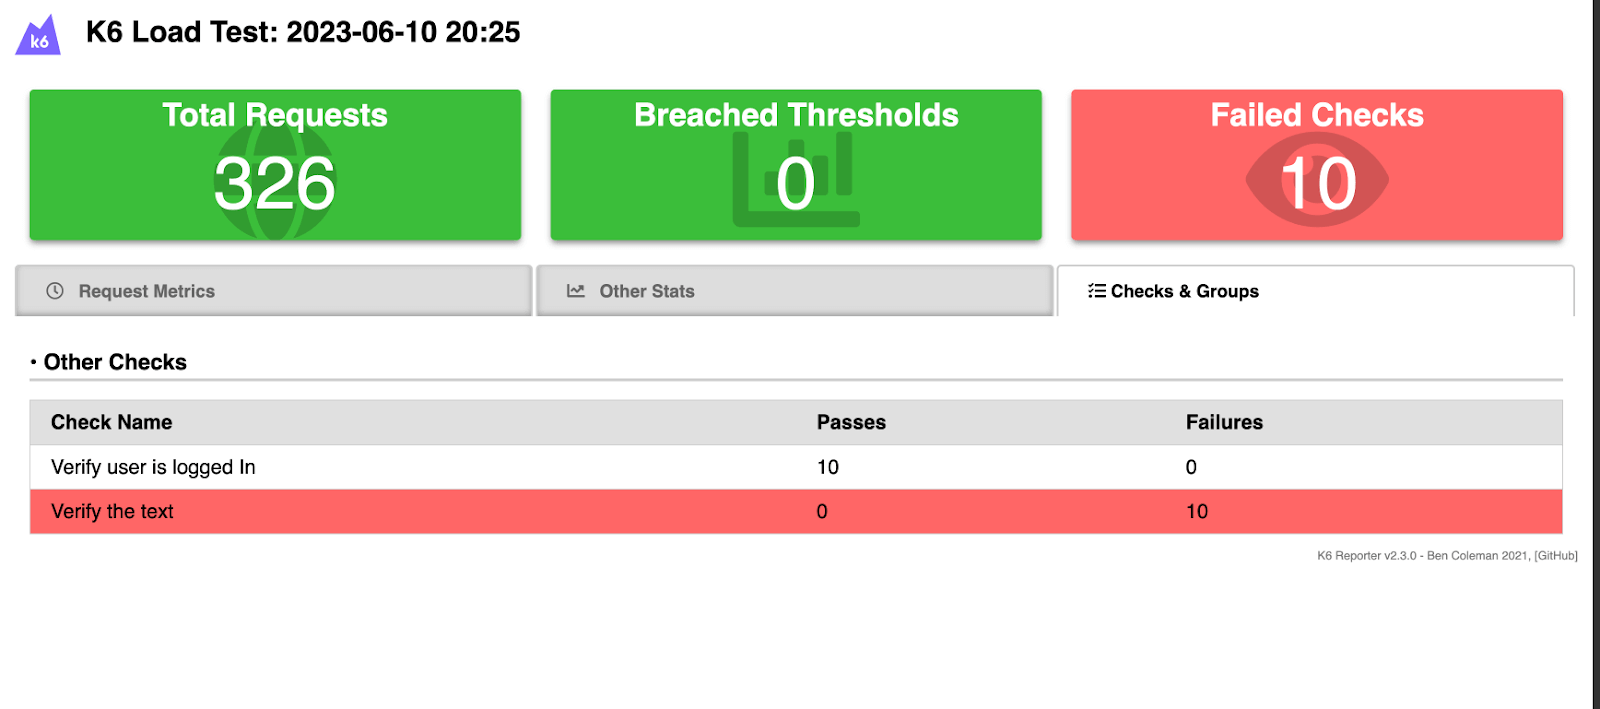
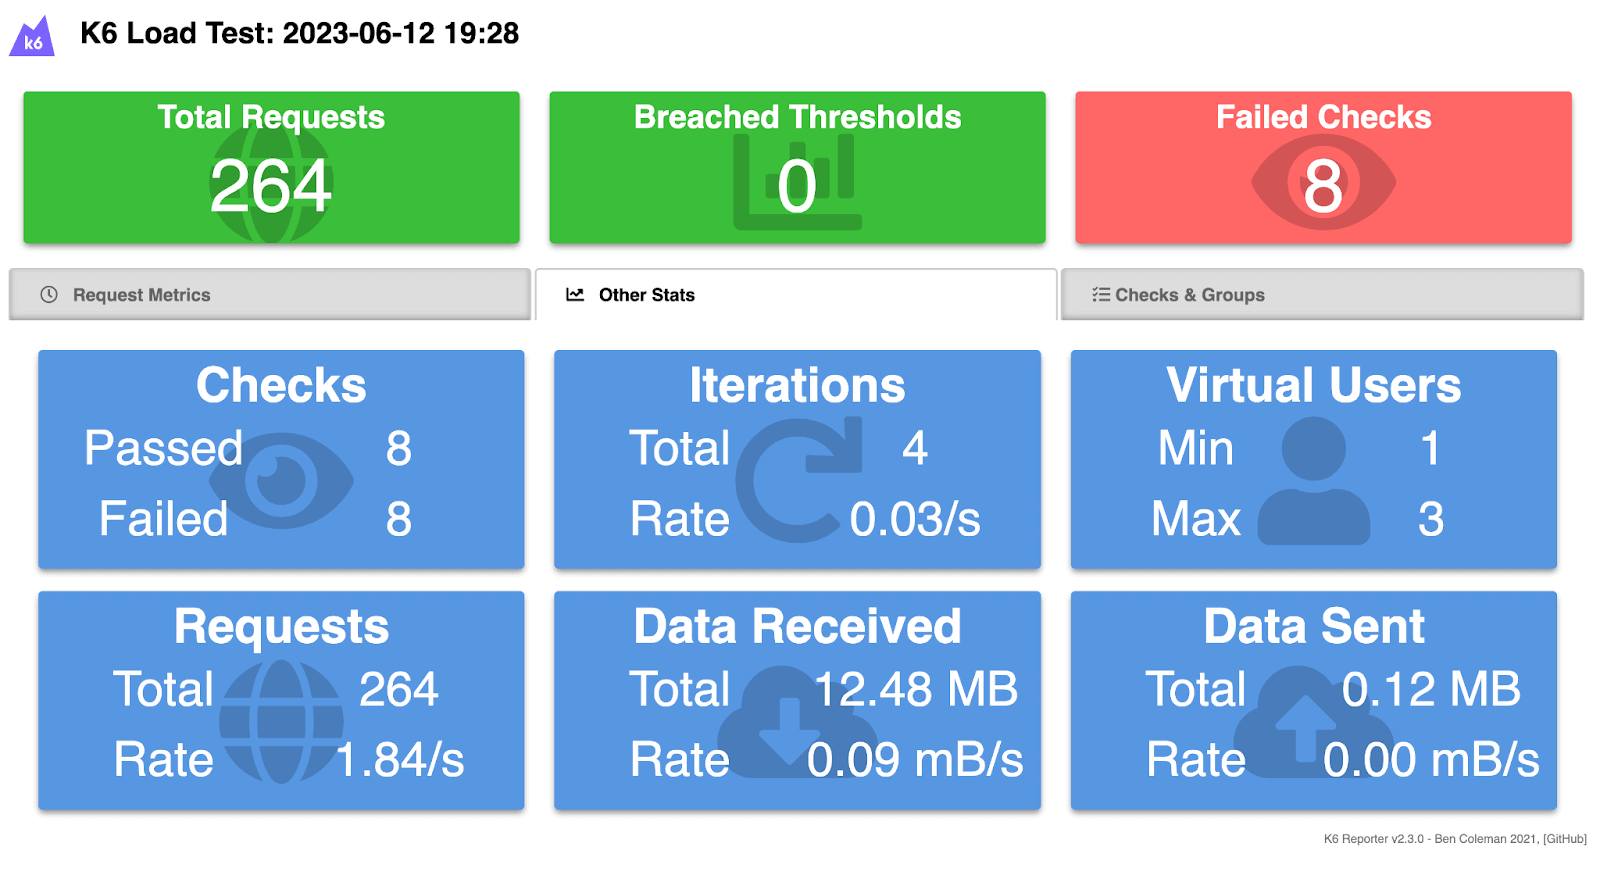
The report would look something like below. It has three tabs.
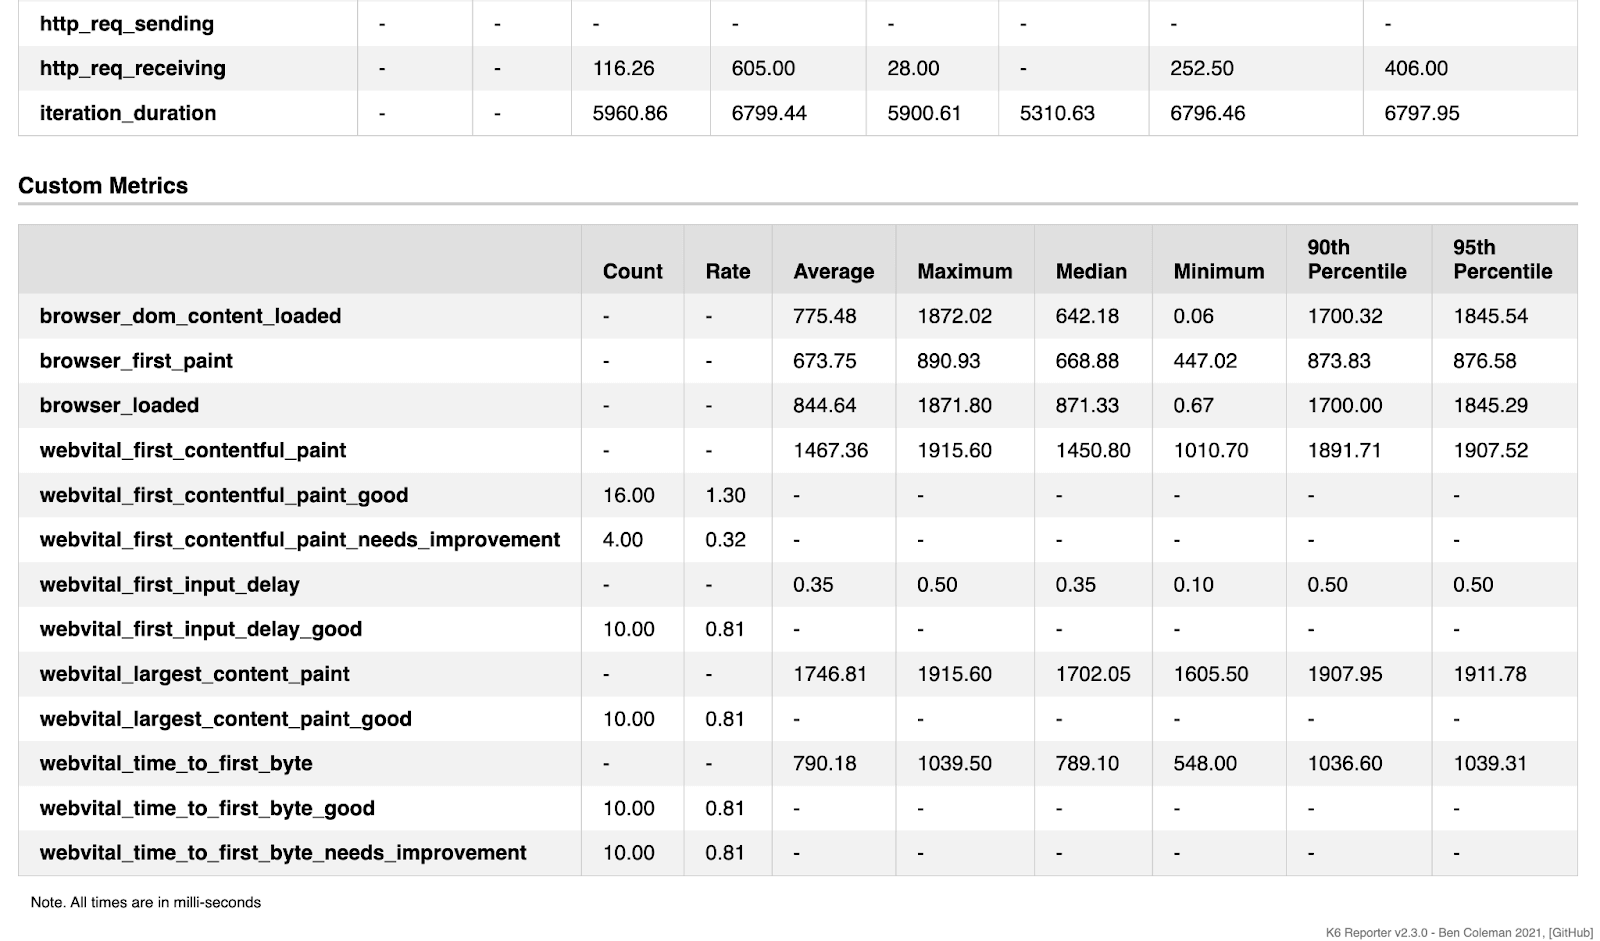
The first tab is Request Metrics, where you can view the HTTP requests and their 90 and 95 percentile.
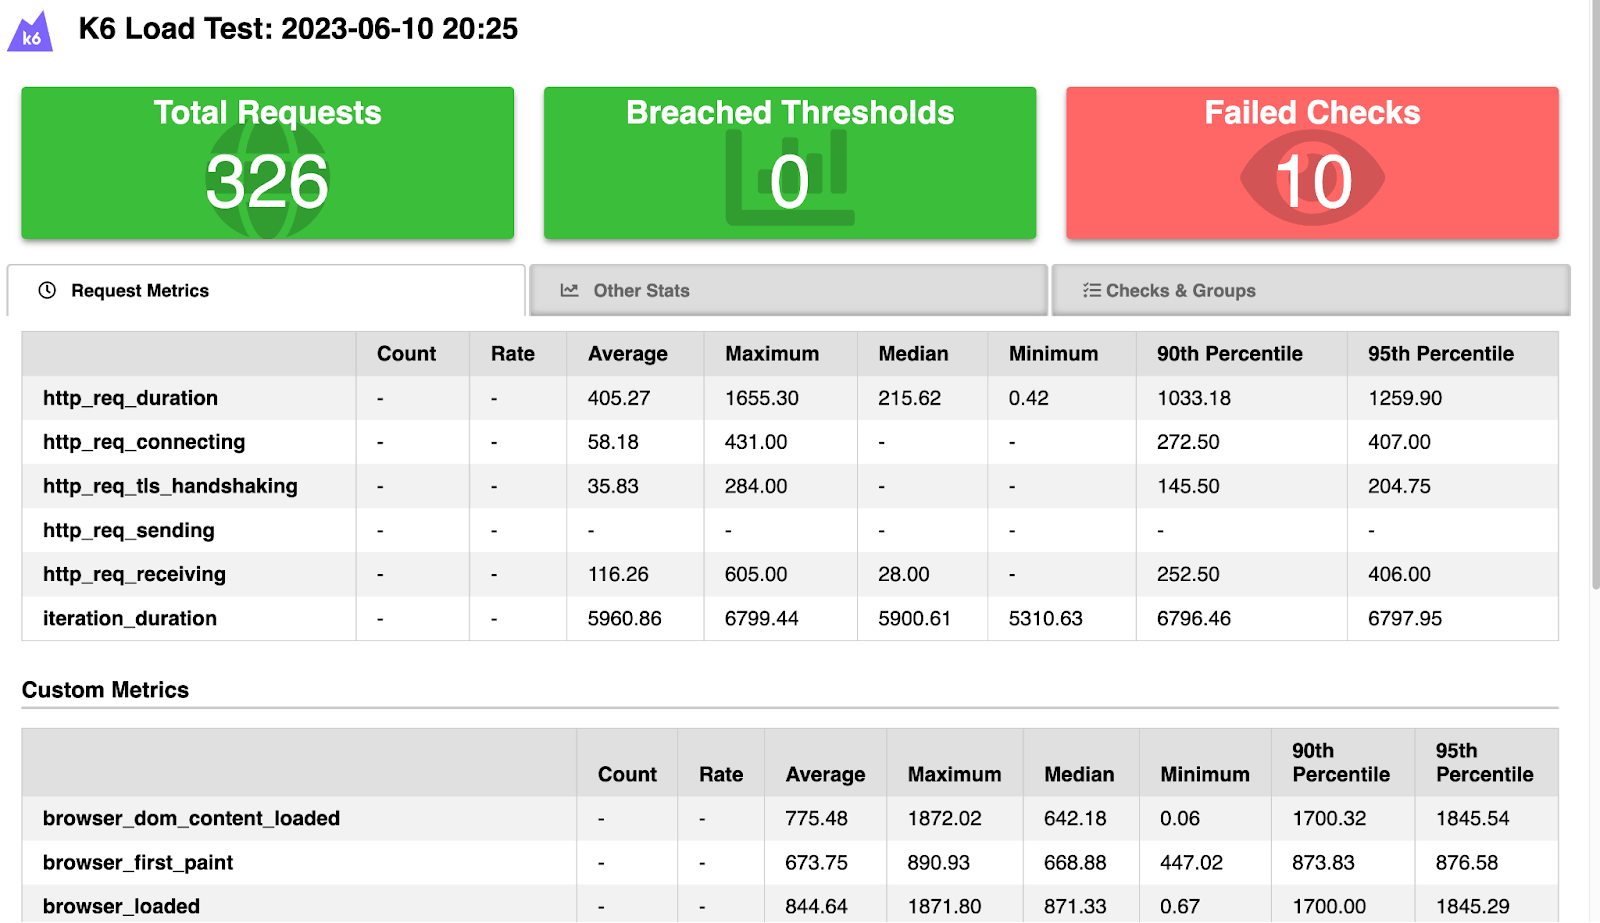
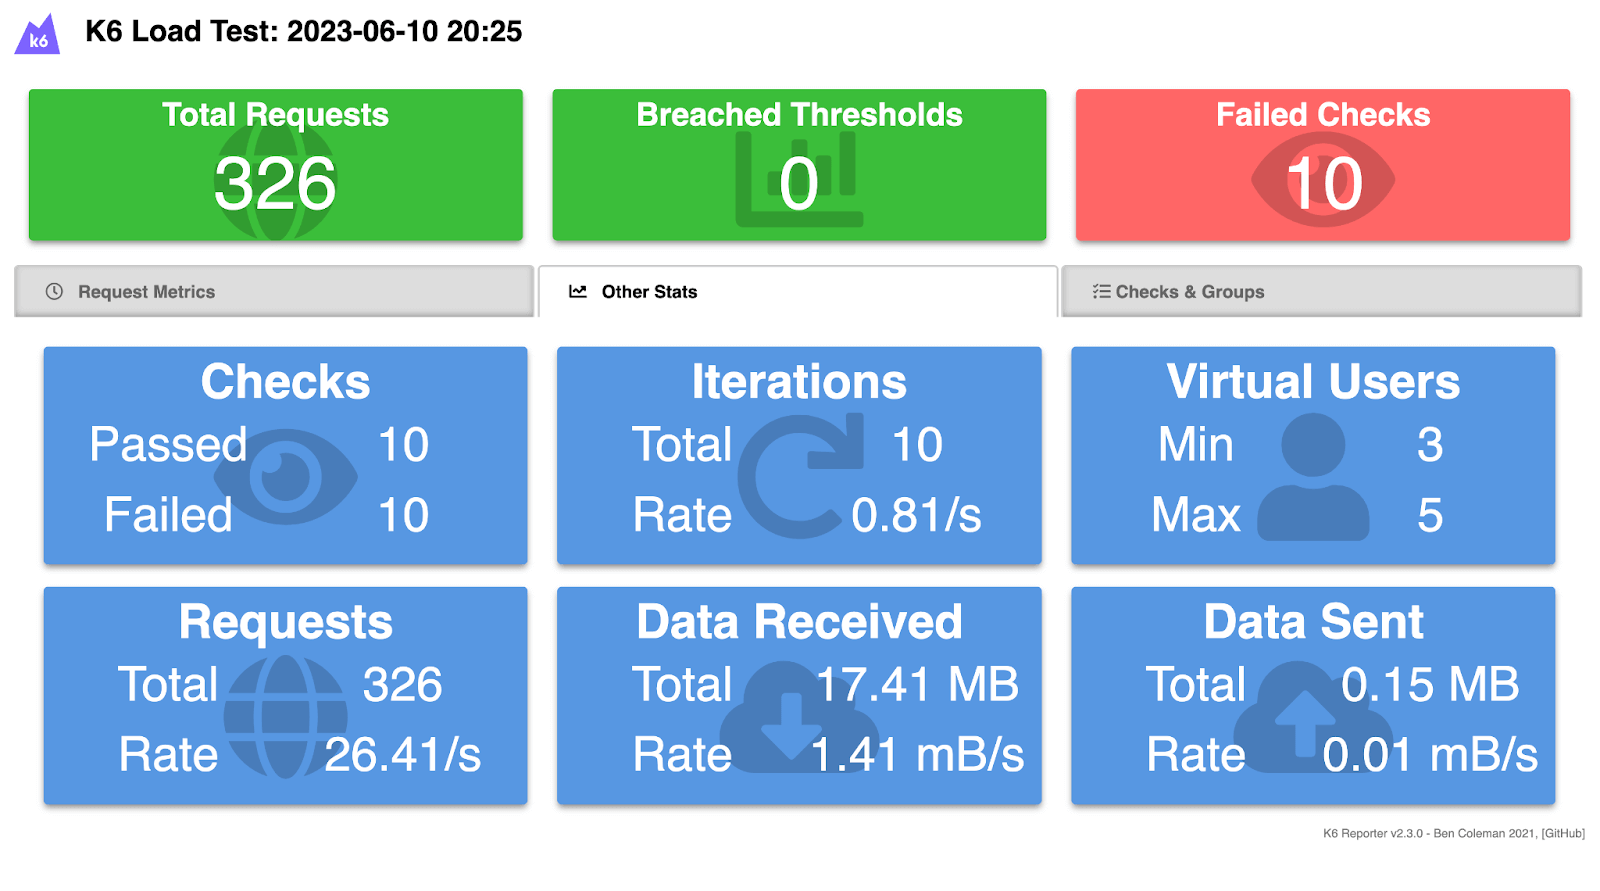
The second tab is Other Stats, which shows all the information with requests to how many iterations were made, how many virtual users were passed, and how many checks (or assertions) got executed.
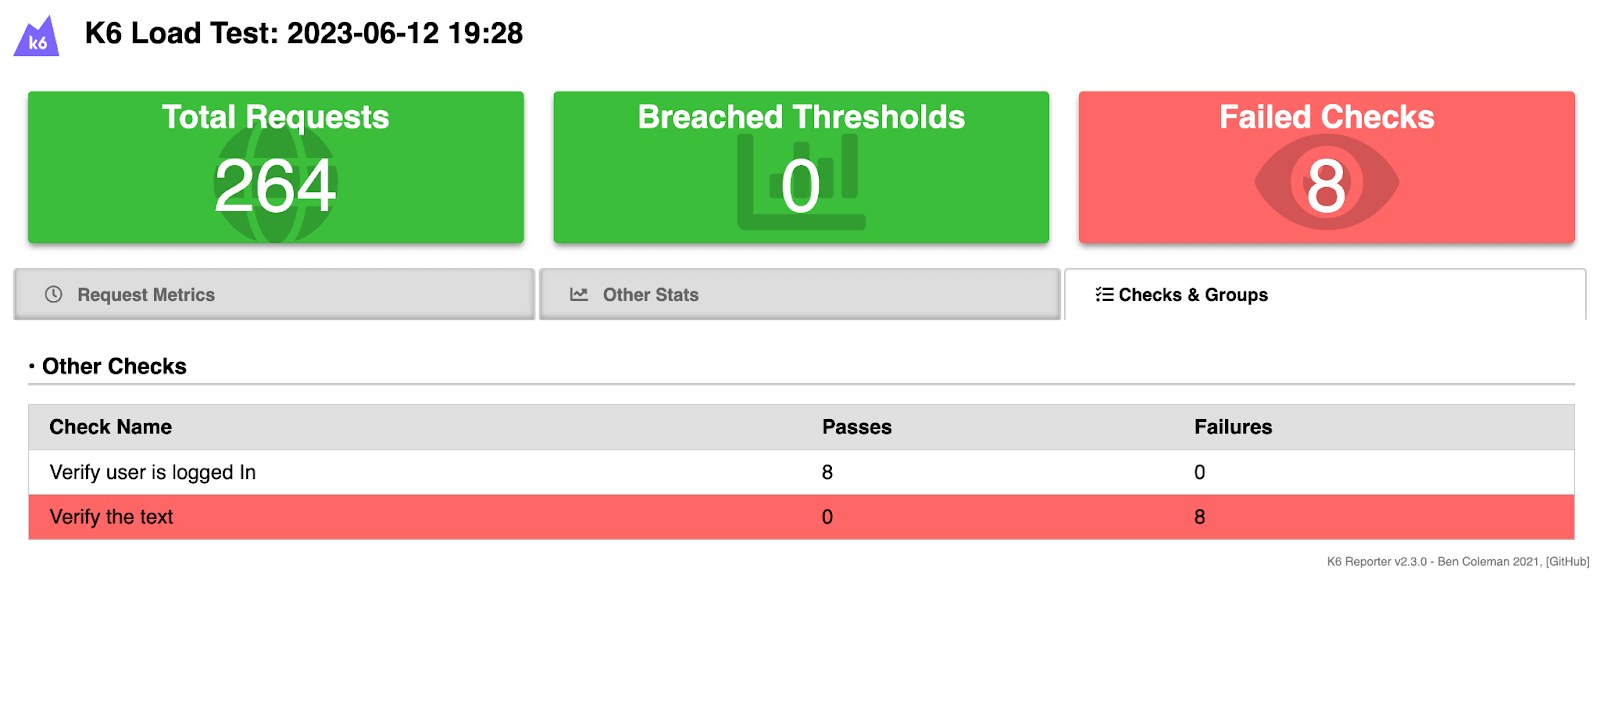
The last tab is Checks & Groups. It displays the information only related to checks/assertions present in the test. In the given example, there are two checks: one verifies if the user is logged in, and the other verifies the displayed text.
As mentioned previously, the shared example consists of both a passed and a failed case. Consequently, a total of 20 requests will be made to execute both checks, with 10 requests per check.
Below is the screenshot of the HTML Report displaying one check as passed and the other as failed.
How to perform k6 testing on the cloud?
While k6 offers an array of powerful features, performing k6 testing on a cloud-based digital experience testing platform like LambdaTest gives you the advantage of seamless browser and OS version management. You can easily examine every step of the test run with comprehensive logs.
As a tester, one of your key responsibilities is to ensure that your web application remains stable and functional even under heavy user loads across different browser and operating system versions. And this issue can be resolved by integrating k6 with a cloud platform where porting effort is minimal, and benefits are much more in the way that you get recordings and detailed logs of each test execution.
Let’s configure the test case and understand it with a real example.
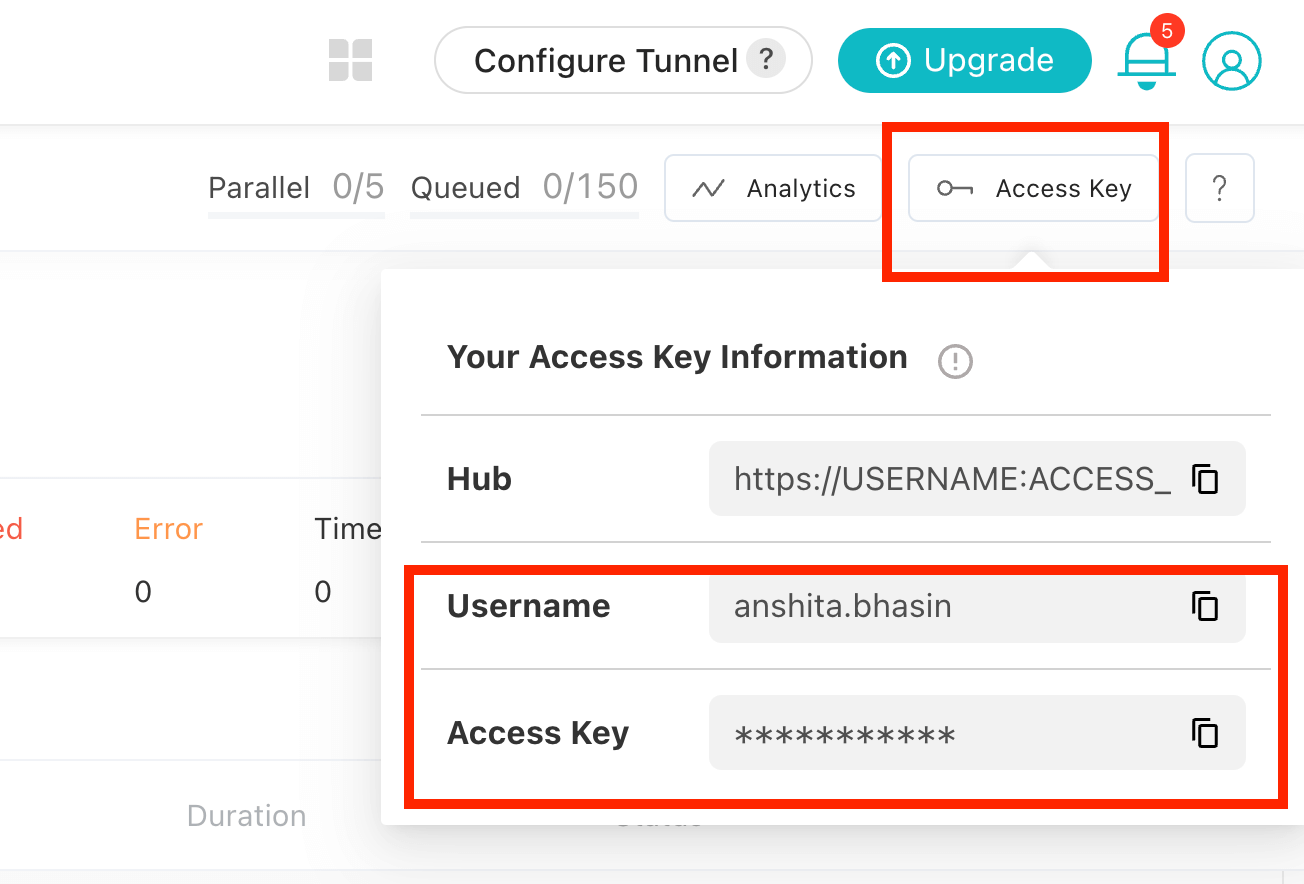
To perform k6 testing on LambdaTest, you need to set your LambdaTest username and access key in the environment variables. Click the Access Key button at the top-right of the Automation Dashboard to access it.
Windows
|
1 2 |
set LT_USERNAME=LT_USERNAME set LT_ACCESS_KEY=LT_ACCESS_KEY |
macOS/Linux
|
1 2 |
export LT_USERNAME=LT_USERNAME export LT_ACCESS_KEY=LT_ACCESS_KEY |
Now that you have obtained the username and access key, let’s proceed with writing the code. We will utilize the same example discussed in the previous section of this k6 testing tutorial.
Test Scenario
Conduct the load testing for login flow with 3 virtual users and 4 iterations. Perform the testing on Chrome (latest) on Windows 11 and macOS Ventura.
|
Implementation
Paste the below code in the IDE of your choice and save it as filename.js.
Example => loginTest.js
Code Walkthrough
As we proceed with the sample example, the base code remains unchanged. However, the modifications made involve adding the capabilities and connecting to the remote URL.
Please ensure that you have the credentials and configurations exported from LambdaTest to establish the remote connection and perform the desired tests.
Step 1
The test function is defined using the export default syntax, which serves as the main entry point for the test execution. The test function has an array called capabilities with two browser configurations (Chrome on different platforms – Windows 11 and macOS Ventura), just like shown below.
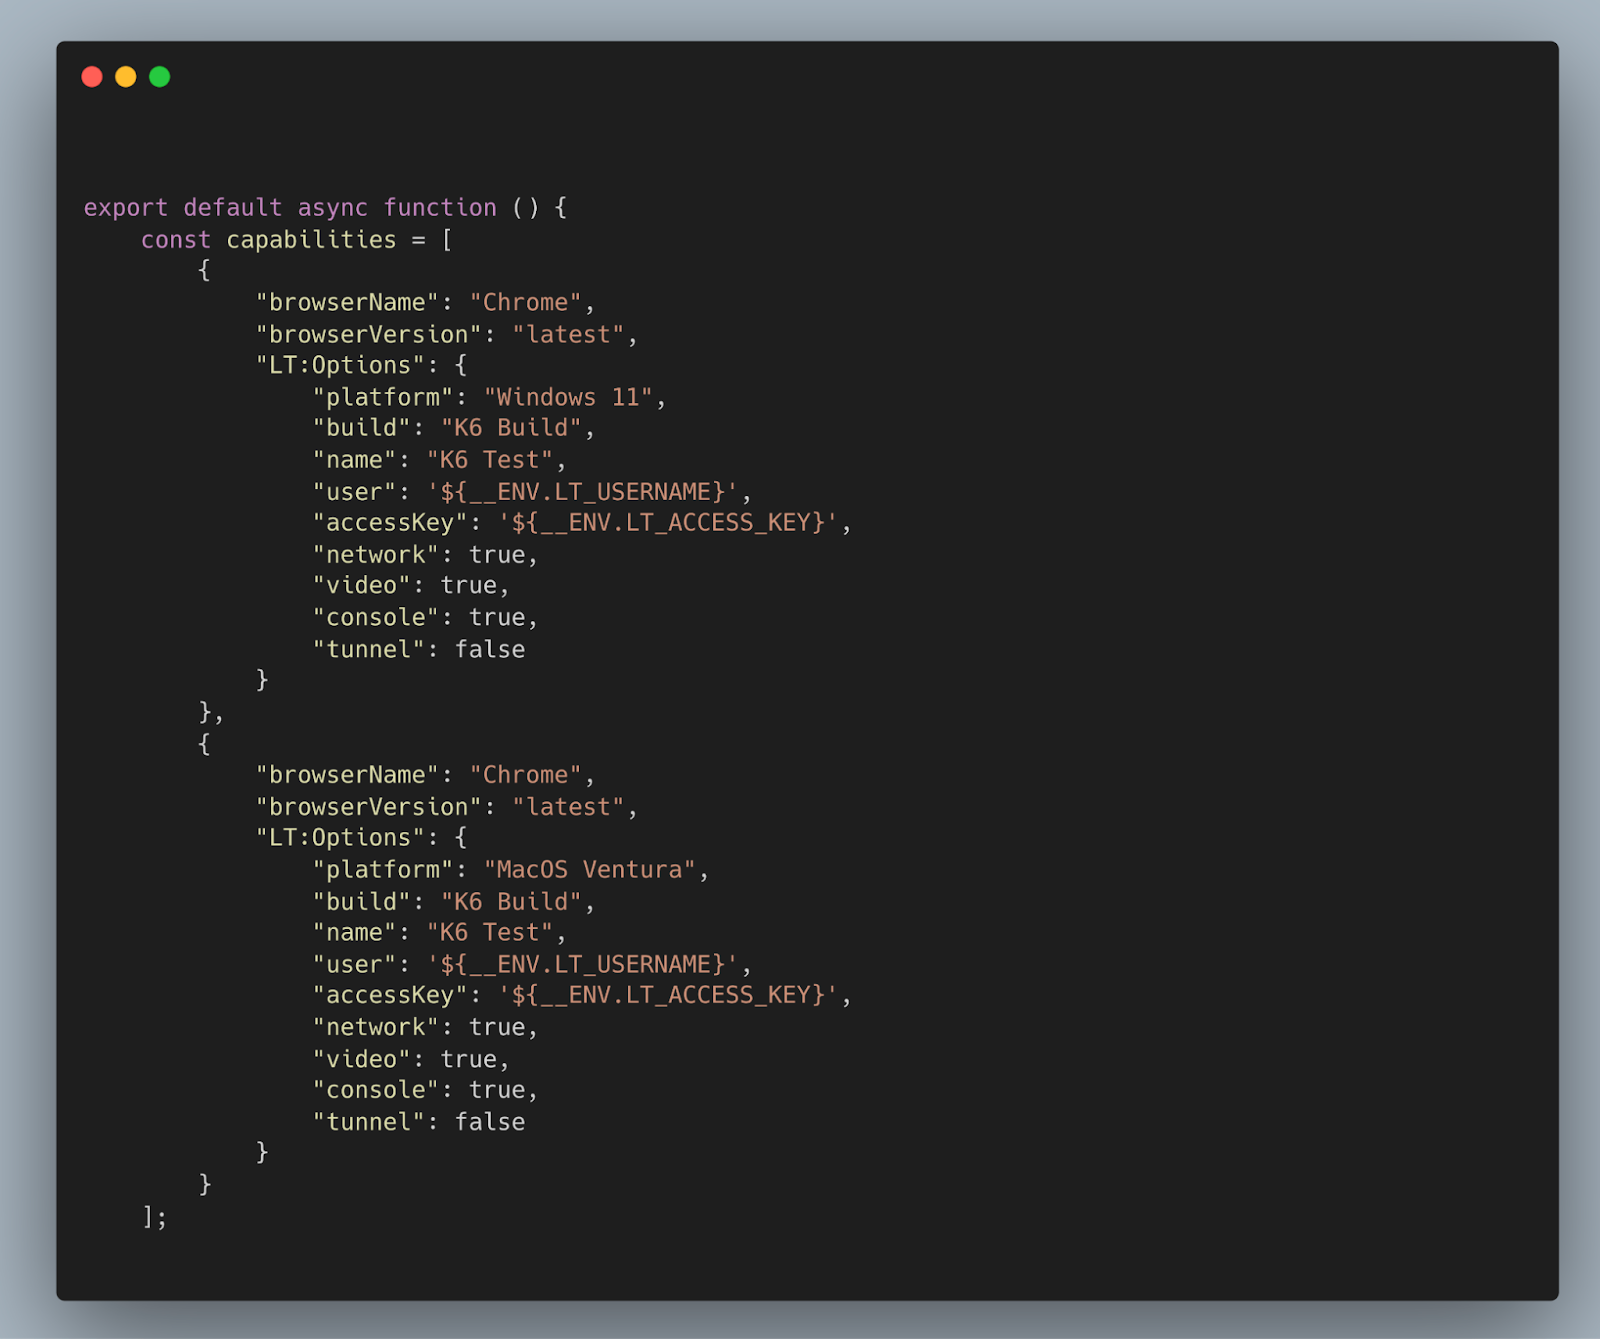
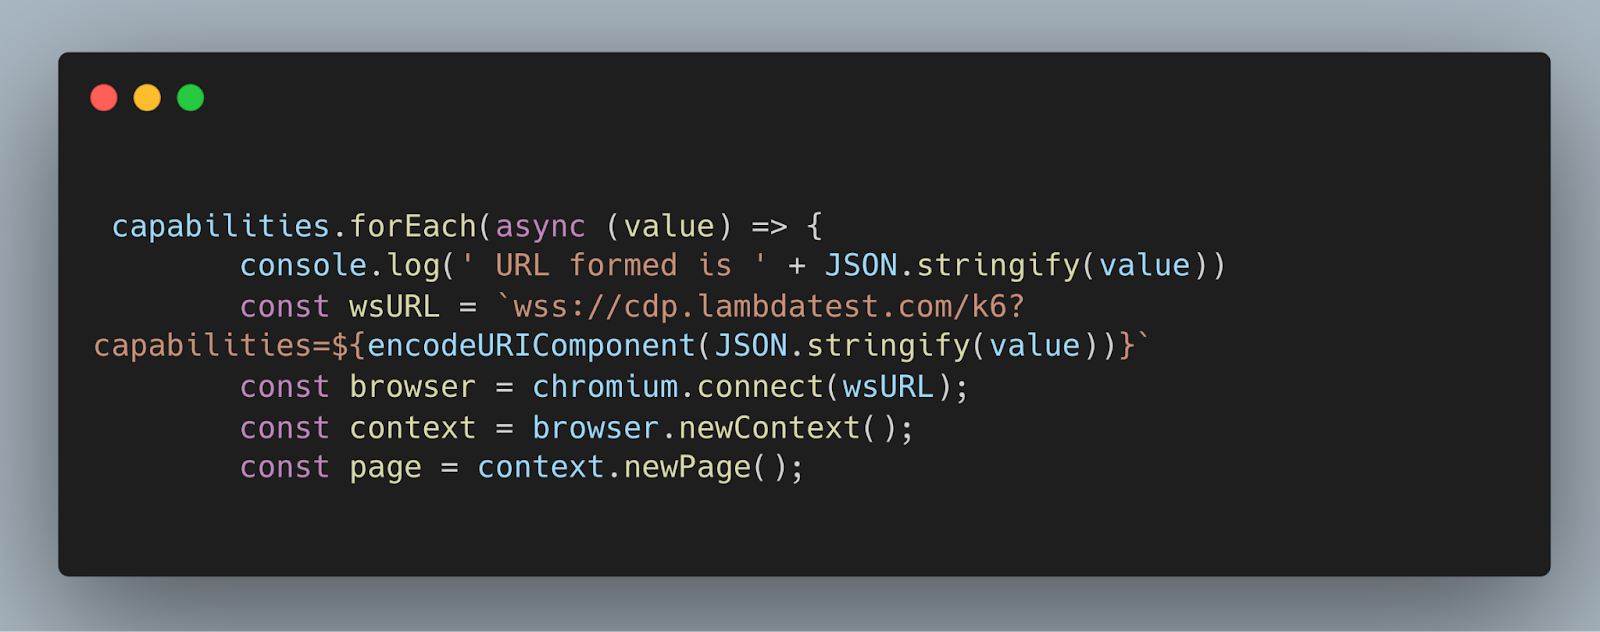
Iterate over the capabilities array using forEach and perform the following steps for each configuration:
Create a WebSocket URL (wsURL) for connecting to the LambdaTest k6 service. Connect to the remote browser using chromium.connect(wsURL) and create a new browser context and page.
Continuing with the existing functionality, we are now changing the execution platform from running on your local machine to LambdaTest. This shift enables the execution of tests on the LambdaTest platform, offering a seamless testing experience.
Execution
To execute the above code, go to the terminal and run the below command.
|
1 |
K6_BROWSER_ENABLED=true k6 run loginTest.js |
It is important to note in the case of k6 Reporter, the execution command remains the same. It’s only the code change you have to do.
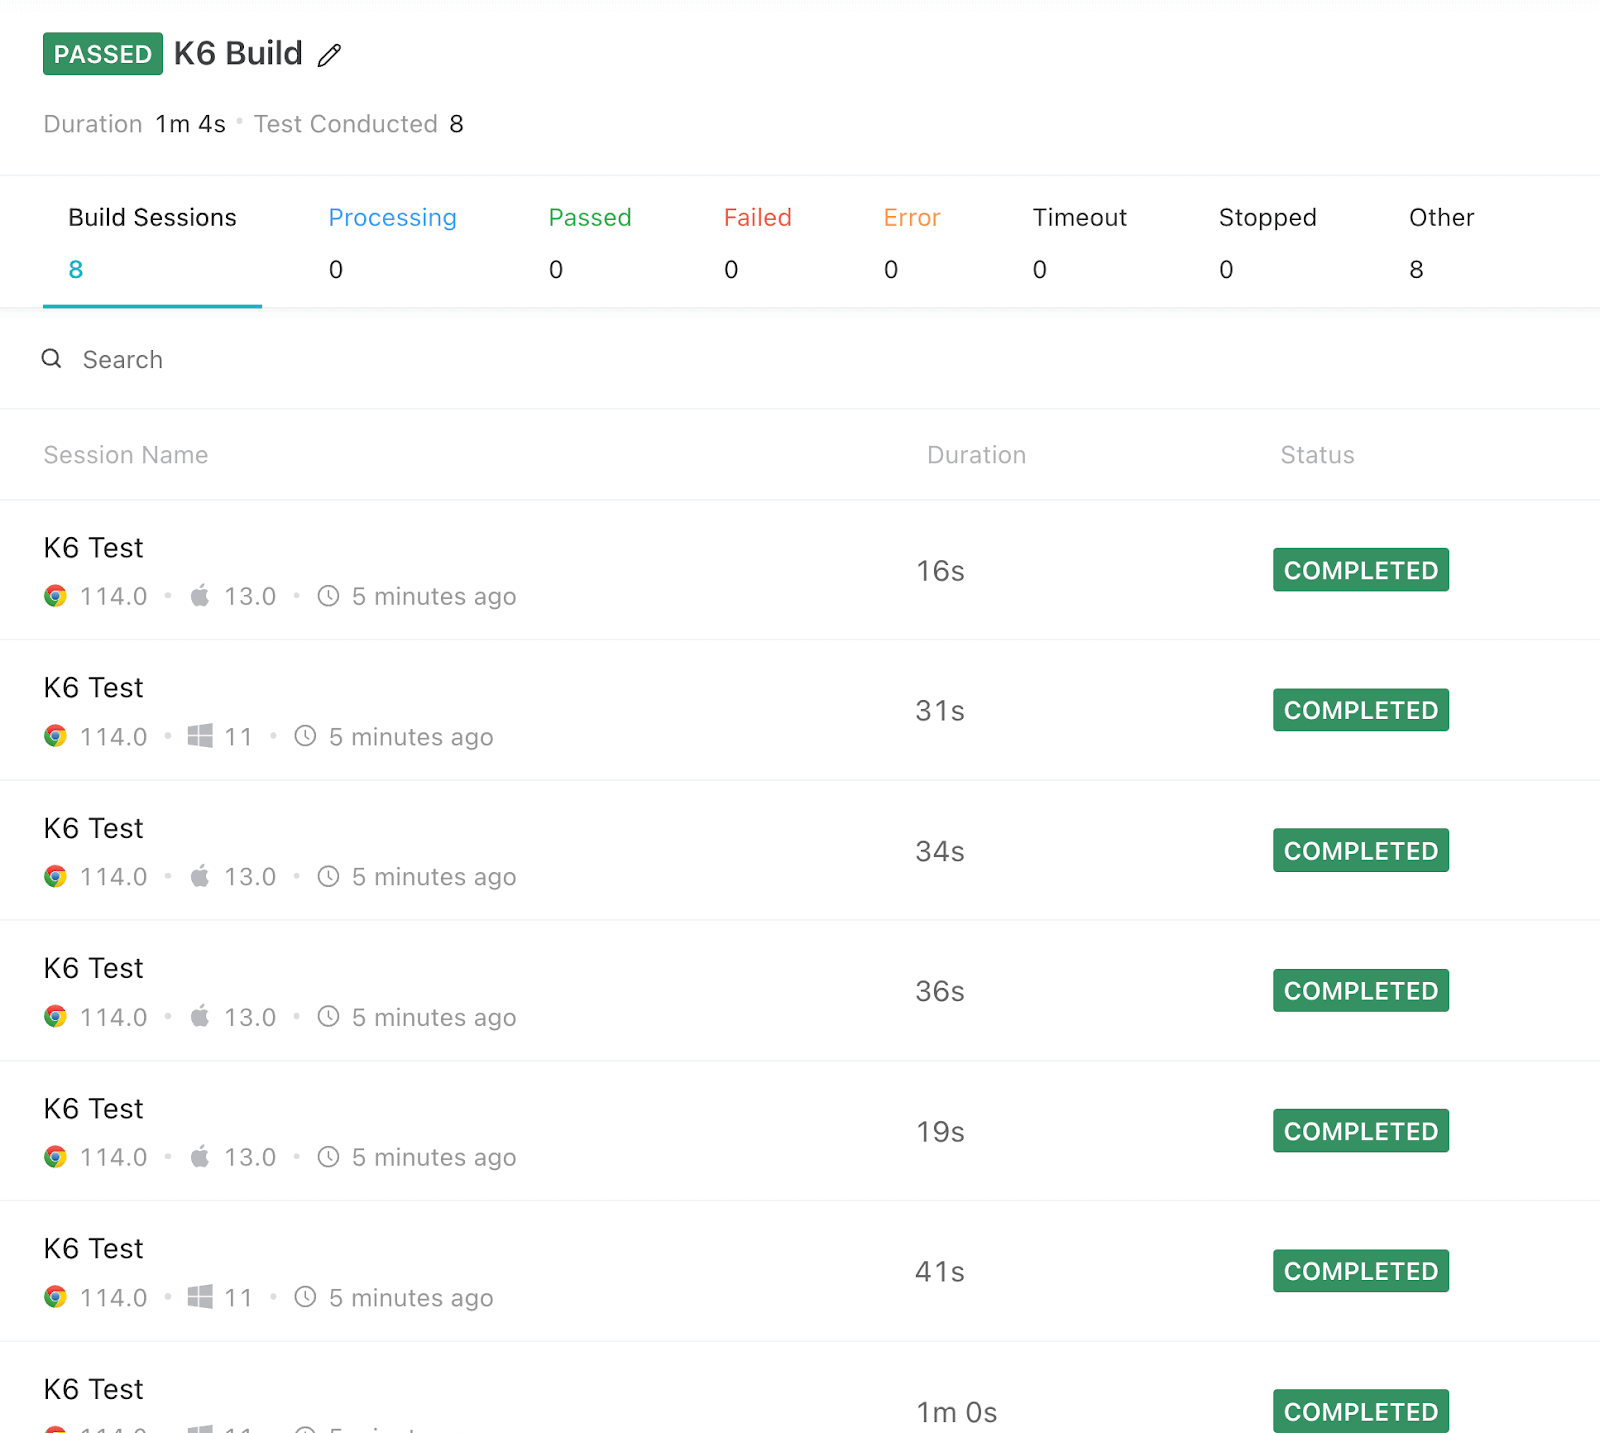
After running the command, you can view the test run on LambdaTest Dashboard (just like shown in the screenshot below).
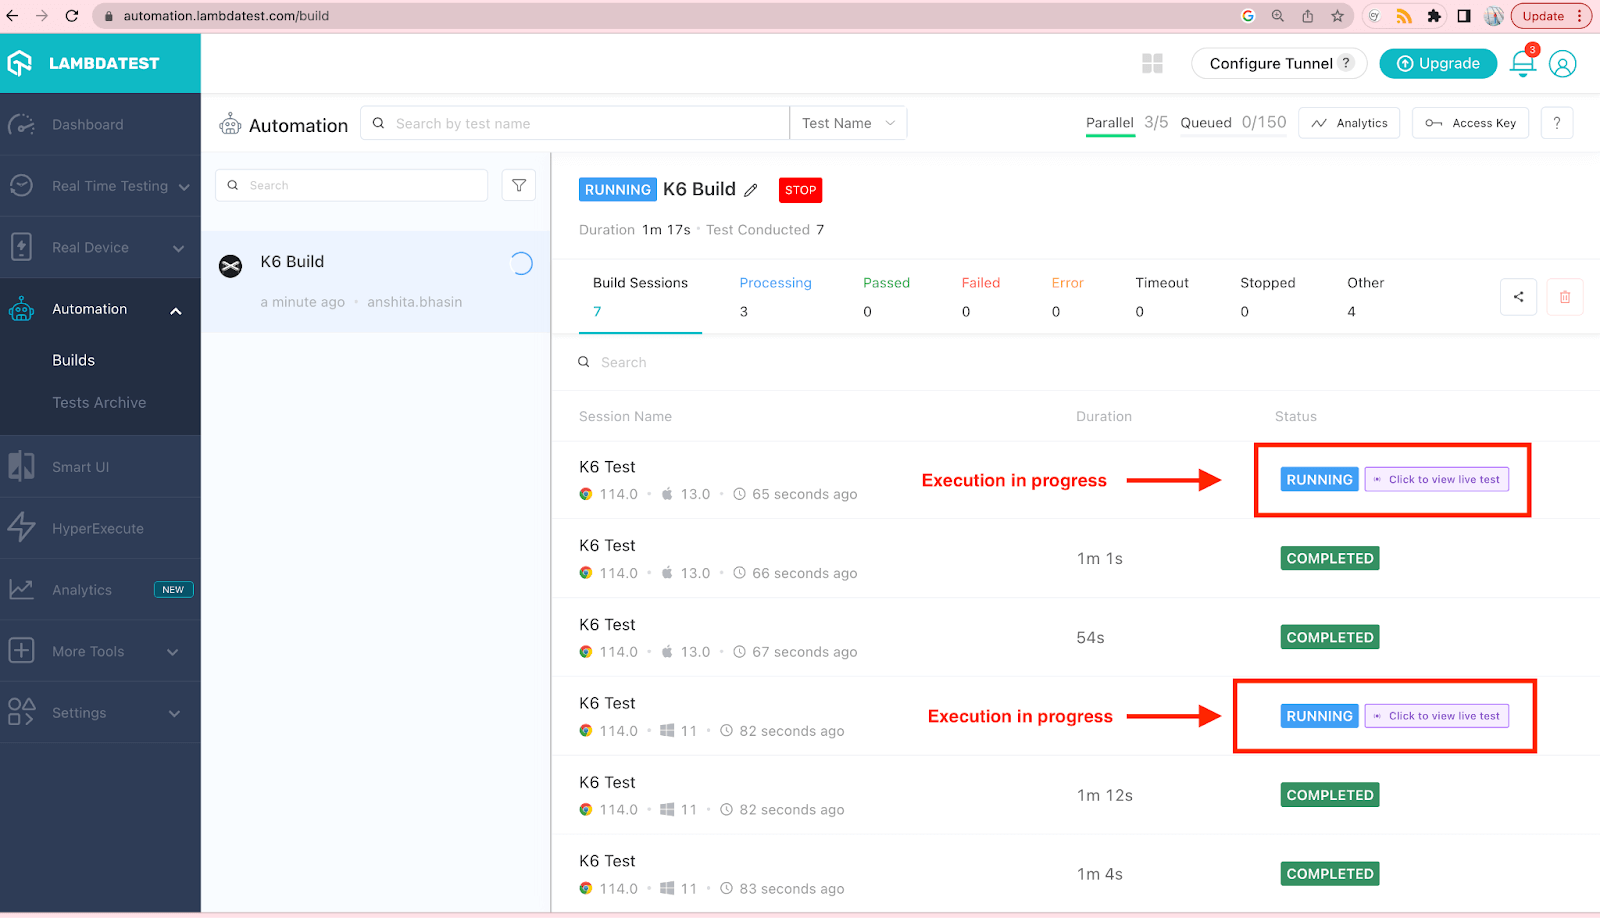
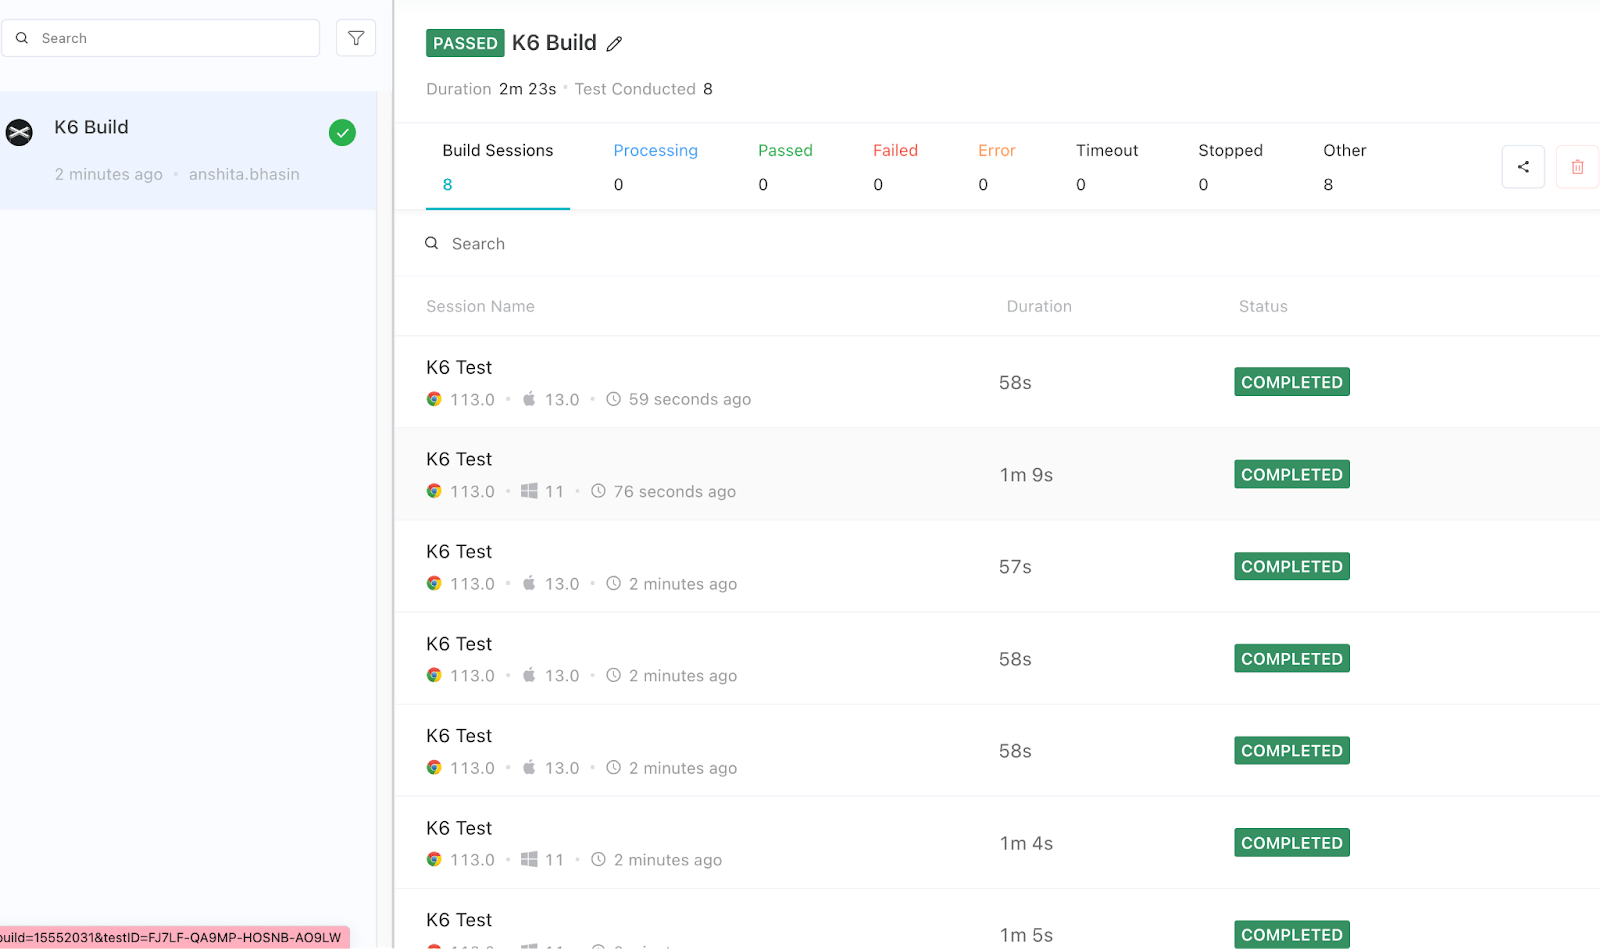
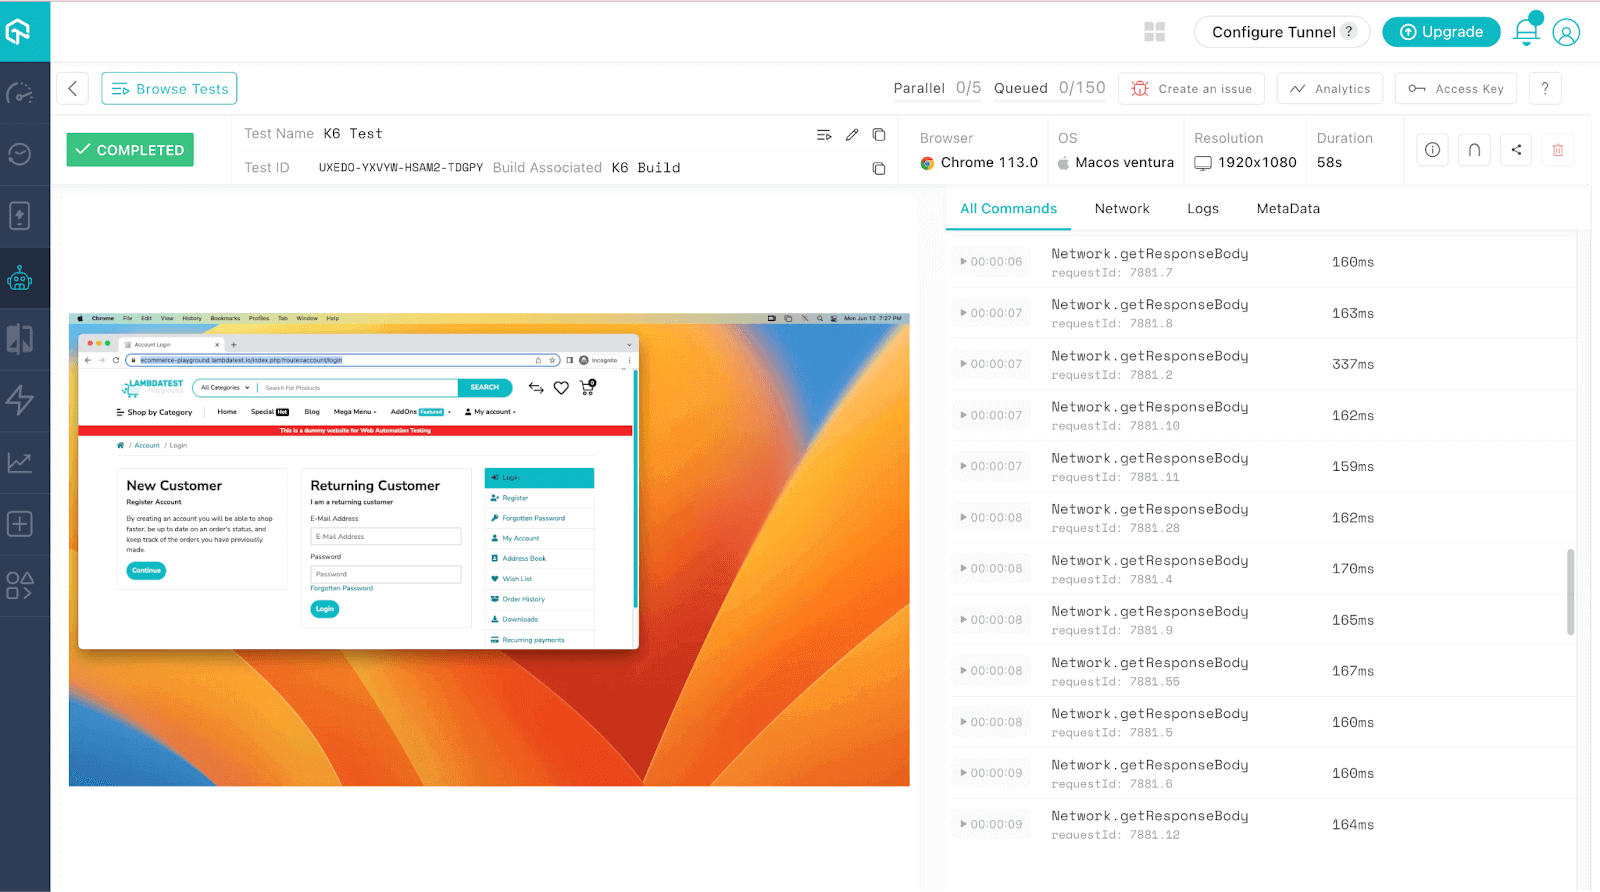
You can also view the logs by clicking the session name of the respective test, just like shown below.
Reporting
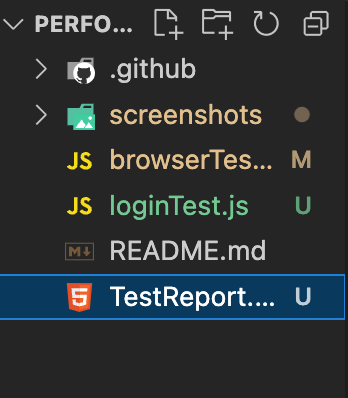
Once you perform k6 testing on a cloud platform, the generated report will be saved in your project’s folder with the specified name mentioned in the code. To locate the report, you need to check the folder and search for the name specified within the handleSummary() function.
In the given example, the report name specified is TestSummaryReport.html. Therefore, you should look for a file named TestSummaryReport.html within your project’s folder to find the generated report.
Next, open the report in your browser, and you will observe that the report appears similar to the example below, featuring three tabs. The first tab, named Request Metrics, allows you to examine all the HTTP requests that were made.
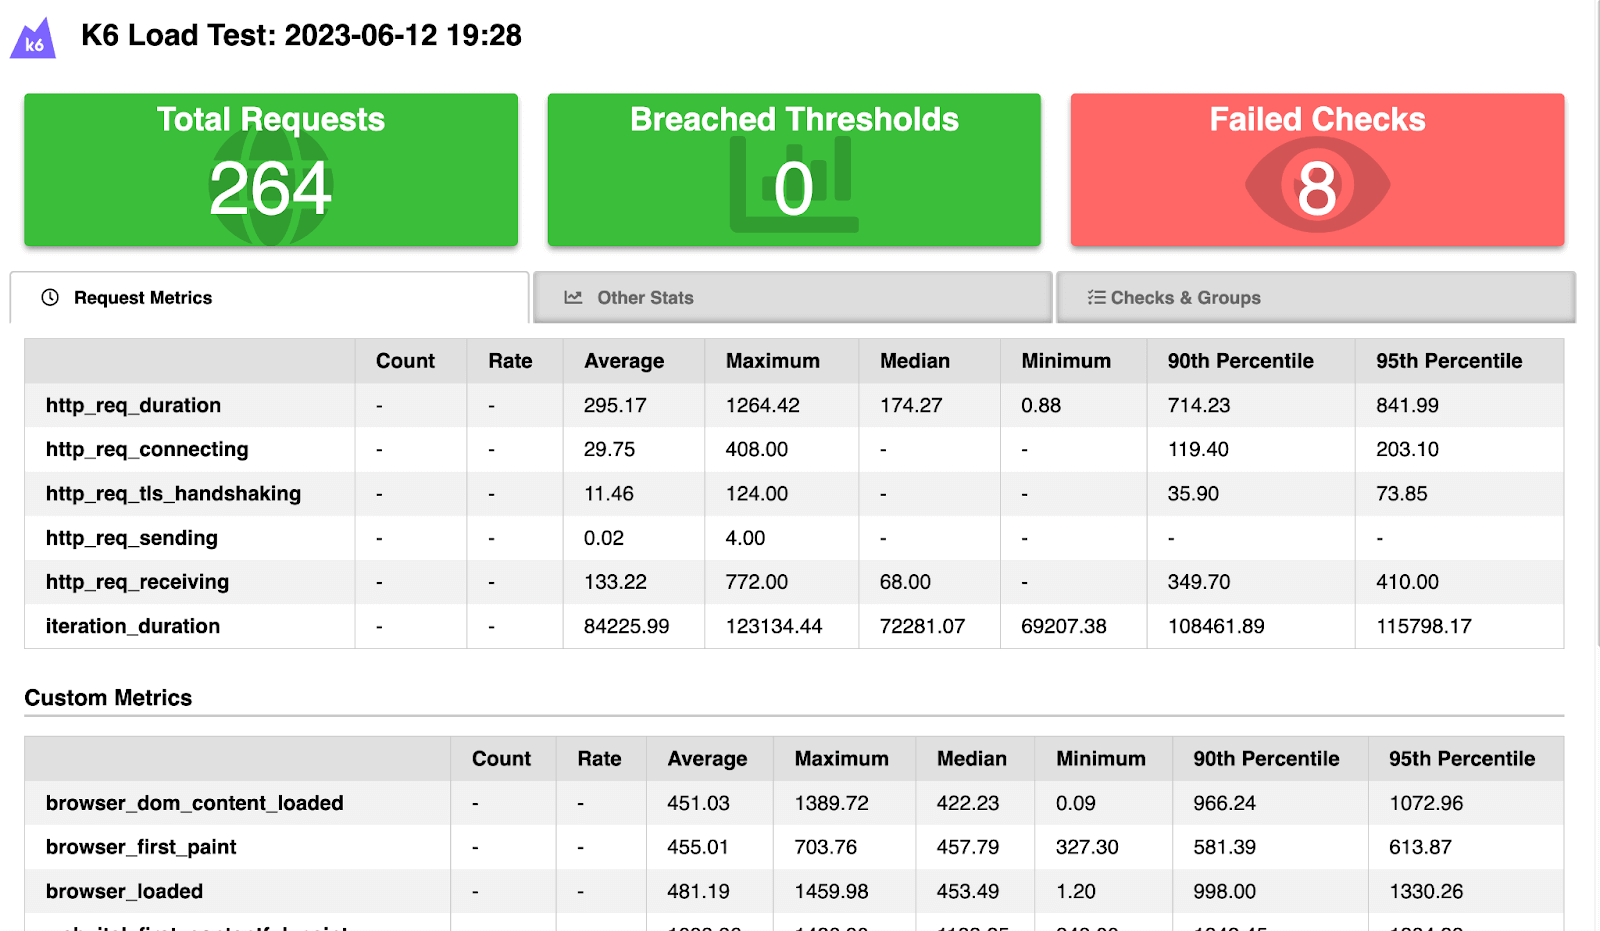
The second tab is labeled Other Stats and provides comprehensive information regarding the test execution. It displays details such as the number of iterations performed, the count of virtual users involved in the test, and the total number of checks or assertions executed. This tab offers a holistic view of the test’s overall performance and validation metrics.
In the screenshot below, you can observe that the total number of iterations is 4 and the count of virtual users is 3, which matches the count specified in the loginTest.js file.
The final tab, labeled Checks & Groups, presents information related to checks or assertions. In the screenshot below, you can observe that two checks are displayed that match the count of checks passed in the test. Of these checks, one has passed, while the other has failed.
The total count of checks is 8 because the code specifies an iteration of 4, executed on two different operating system and browser versions. Therefore, the count is calculated as 4*2, resulting in a total of 8 checks being performed.
As mentioned earlier in the test, there are two checks: one that has passed and another intentionally designed to fail. This deliberate failure allows us to examine the behavior and capture the details of a failed test case as well.
Performing k6 testing on CI/CD: GitHub Actions
The core principle of Continuous Integration (CI) and Continuous Delivery (CD) is to ensure that the integration of changes into your application does not introduce new bugs or disrupt existing functionalities. And to simplify this process of incorporating performance testing into your CI/CD pipelines. k6 provides seamless integration with various CI/CD tools such as Jenkins and GitHub Actions.
As part of this k6 testing tutorial, we will learn k6 integration with GitHub Actions. GitHub Actions is a Continuous Integration (build, test, merge) and Continuous Delivery (automatically released to the repository) (CI/CD) platform. It automates and executes various workflows, including building, testing, and merging code changes.
GitHub Actions utilizes workflows defined in .yml files placed under the .github/workflows directory in your GitHub Repository. These workflows define the automated processes triggered by specific events, such as creating a pull request or pushing code to a remote branch.
Some of the features of GitHub Actions are:
- Ease of setup. There is no installation required as it is on the cloud
- Support of multiple languages and frameworks
- Provides actions to every GitHub event
- It can be shared via GitHub Marketplace
Setup GitHub Actions
In the root of your project, create .github/workflows/build.yml (it has to be in the same sequence).
Follow the below steps to create it in your project.
Step 1
Go to your terminal and enter the command mkdir .github.
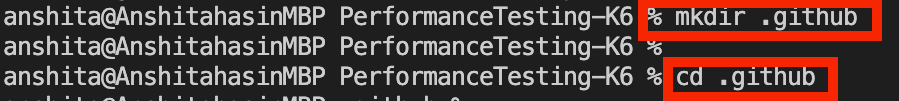
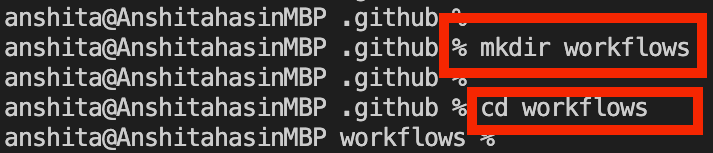
Step 2
Now, navigate to .github (using cd .github) and add workflows folder to it (using mkdir workflows), just like shown in the screenshot below.
Step 3
After creating .github/workflows, create a file (.yml format) using the command touch build.yml.
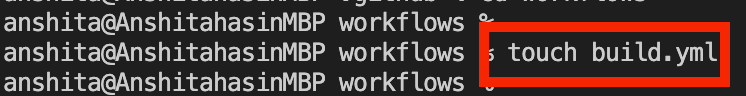
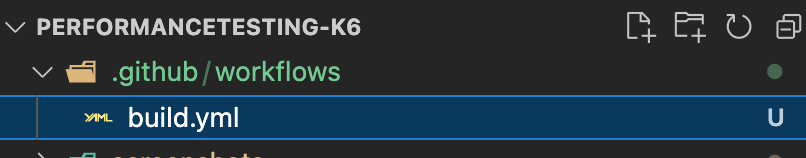
Now, the workflows folder with the file (Example – build.yml) would be visible within the .github directory, as shown below.
After creating a build.yml file, let’s add code to trigger the CI/CD on every code push in your Git Repository. Copy the below code to the .yml file (Example – build.yml)
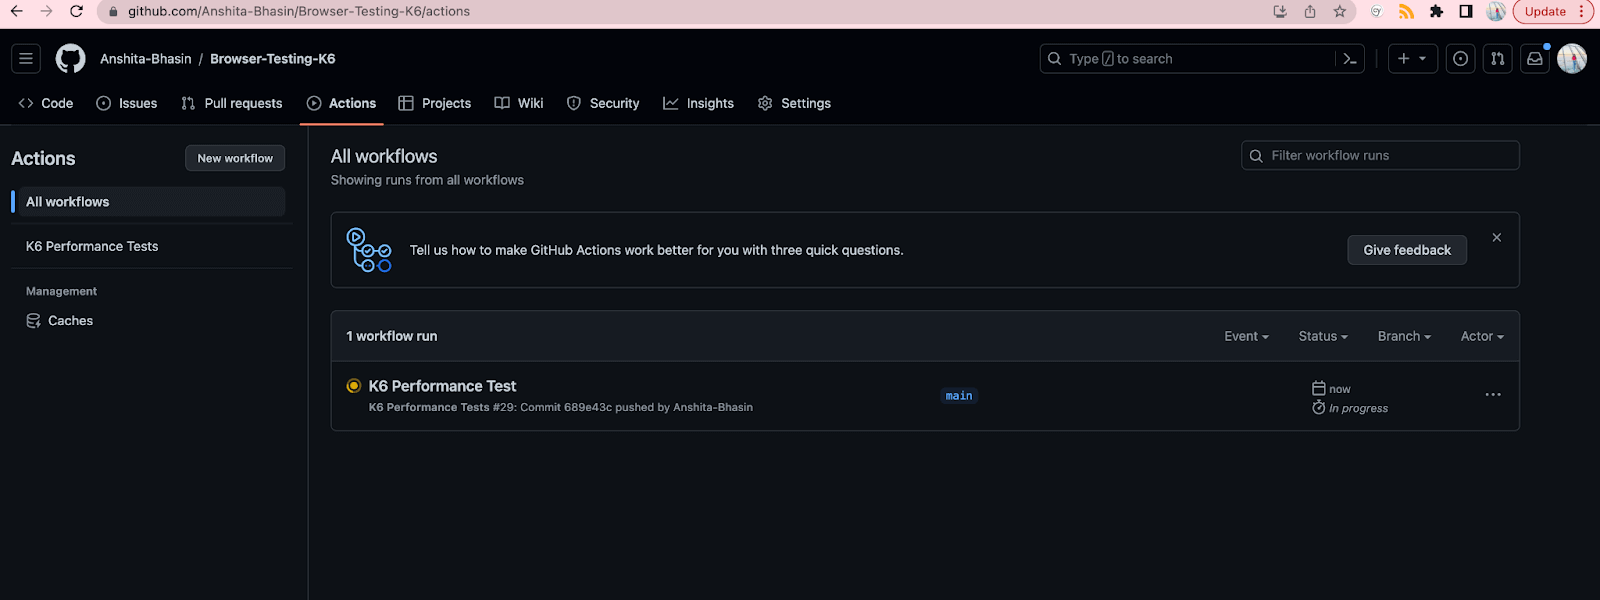
Now if you add this above workflow to your repo, and push your code on the main branch, you should be able to see a workflow under the Actions tab in your GitHub Repository.
Code Walkthrough
Step 1
The name of the workflow is k6 Performance Tests.
Step 2
As part of the given code, there is a trigger condition provided, which is push. So, whenever there is a code push to the remote branch, this workflow will be executed.
Step 3
The workflow defines a job named performance-tests that runs on the ubuntu-latest environment.
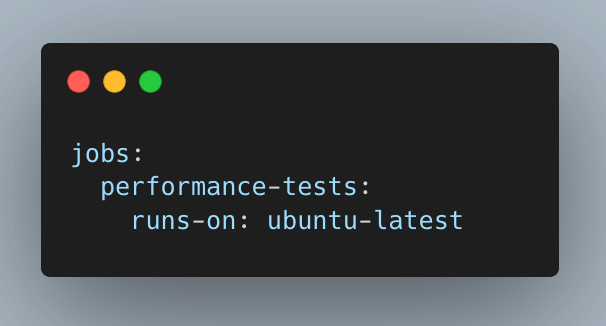
The K6_BROWSER_ENABLED environment variable is set to true.
Step 4
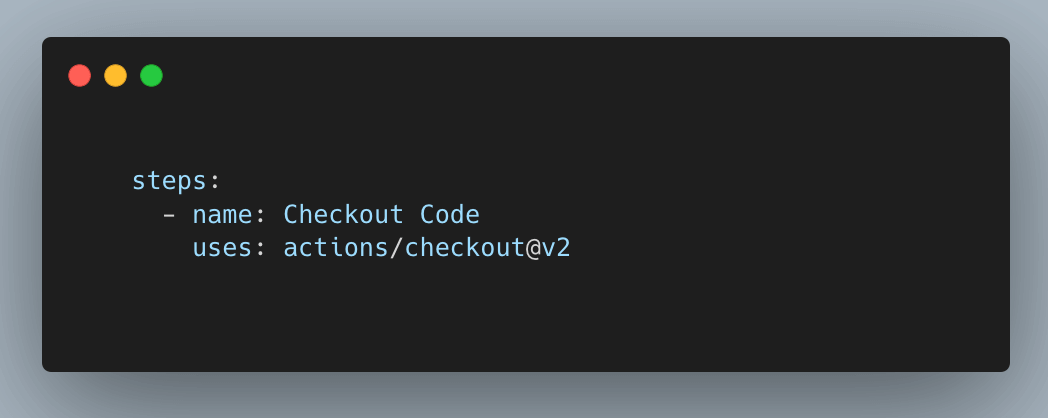
There are 5 steps added as part of the shared workflow .yml file.
- The first step would checkout the code from the GitHub repository using GitHub Actions actions/checkout@v2.
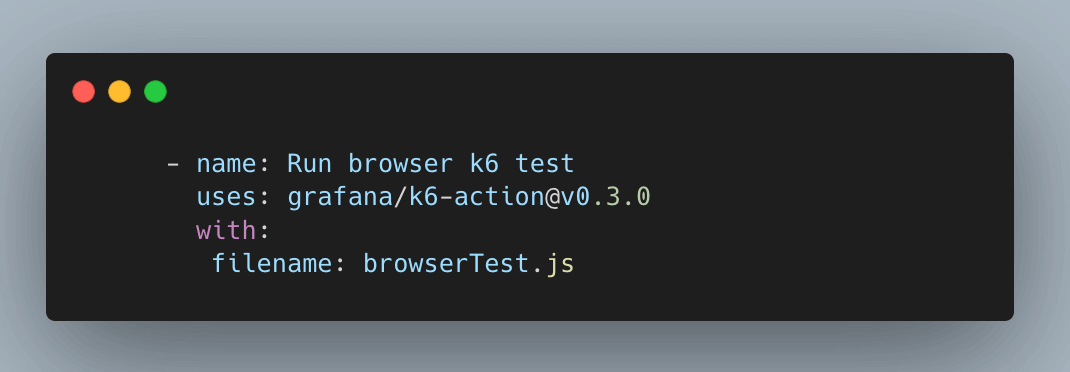
- The second step would run the k6 browserTest.js. k6 has official GitHub Actions for performing k6 testing, which is grafana/k6-action@v0.3.0.
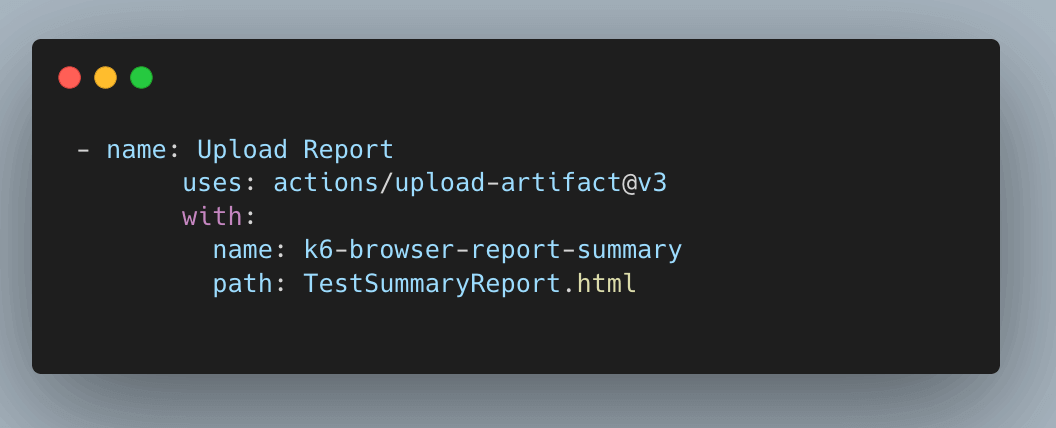
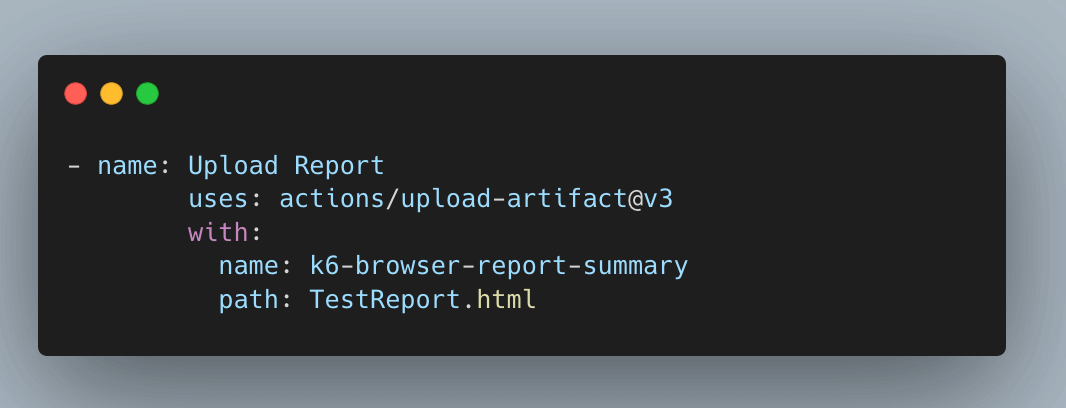
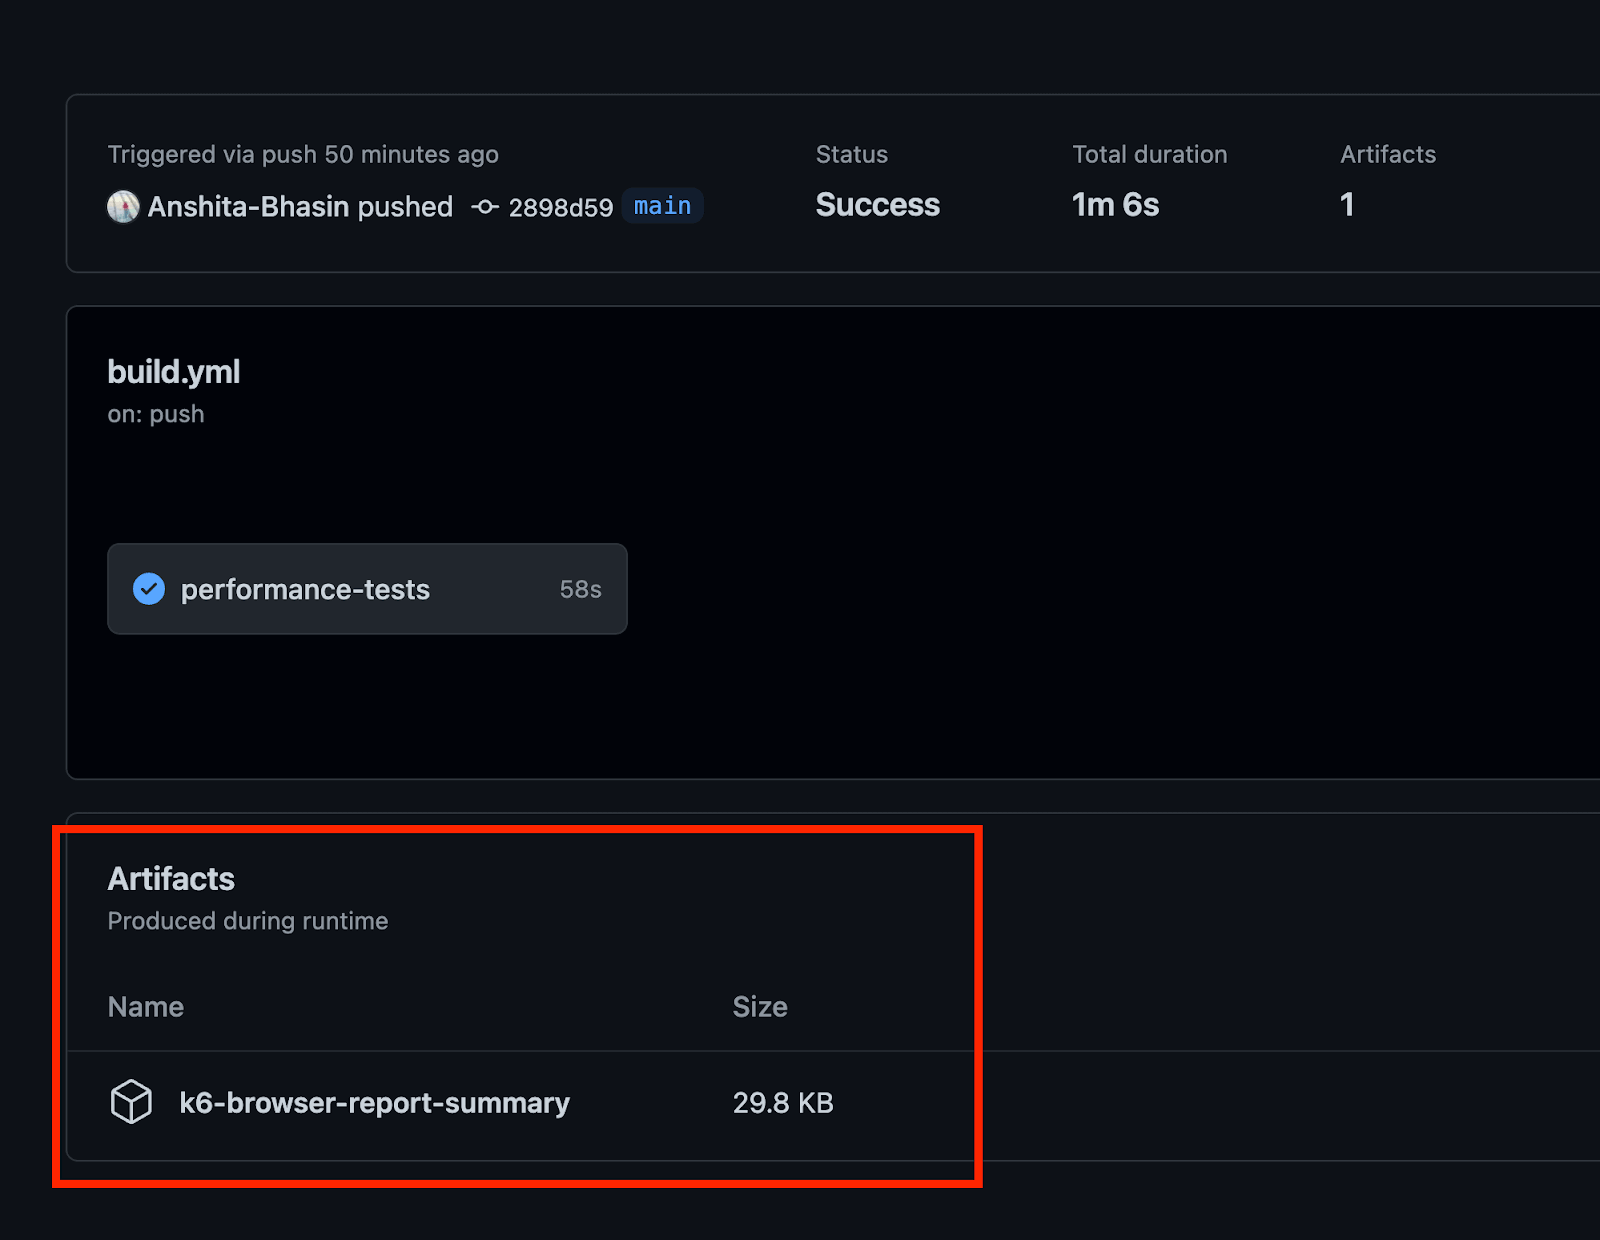
- The third step would upload a report as an artifact using the actions/upload-artifact. The report folder is named k6-browser-report-summary, and its path is specified as TestSummaryReport.html (the same as what we passed in browserTest.js).
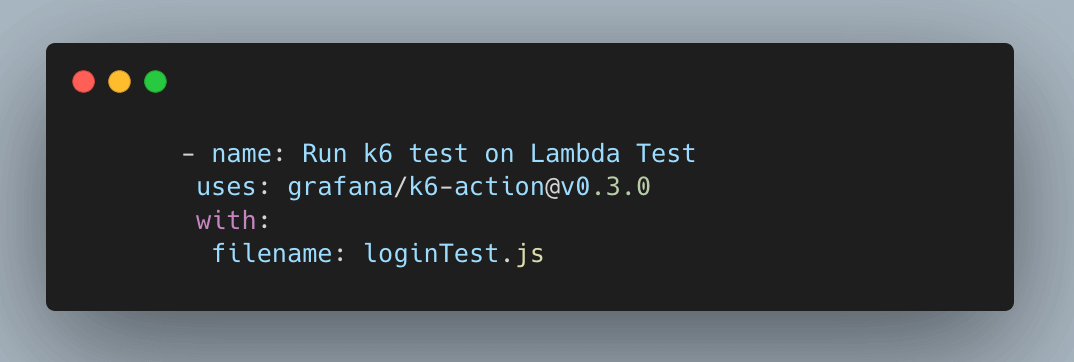
- The fourth step would run the k6 loginTest.js. k6 has official GitHub Actions for performing k6 testing, which is grafana/k6-action@v0.3.0.
- The fifth step would upload a report as an artifact using the actions/upload-artifact. The report folder is named k6-browser-report-summary, and its path is specified as TestReport.html (the same as what we passed in loginTest.js).
Steps 2 and 4 share the same structure, with the only difference being the filename specified. Similarly, steps 3 and 5 have a similar structure, with the only variation being the path specified. As a result, you will notice only one artifact because the report’s name, which is also the folder name, remains the same for both tests.
Implementation
As we proceed with the sample examples, the base code remains unchanged where we have 2 tests in our project just like shown below:
Implementation (Test Scenario – 1)
Implementation (Test Scenario – 2)
Execution
Using the above code, you can execute your test case on both GitHub Actions and the cloud platform. Within the context of CI/CD, two tests are performed: one is executed on GitHub, while the other is conducted on LambdaTest.
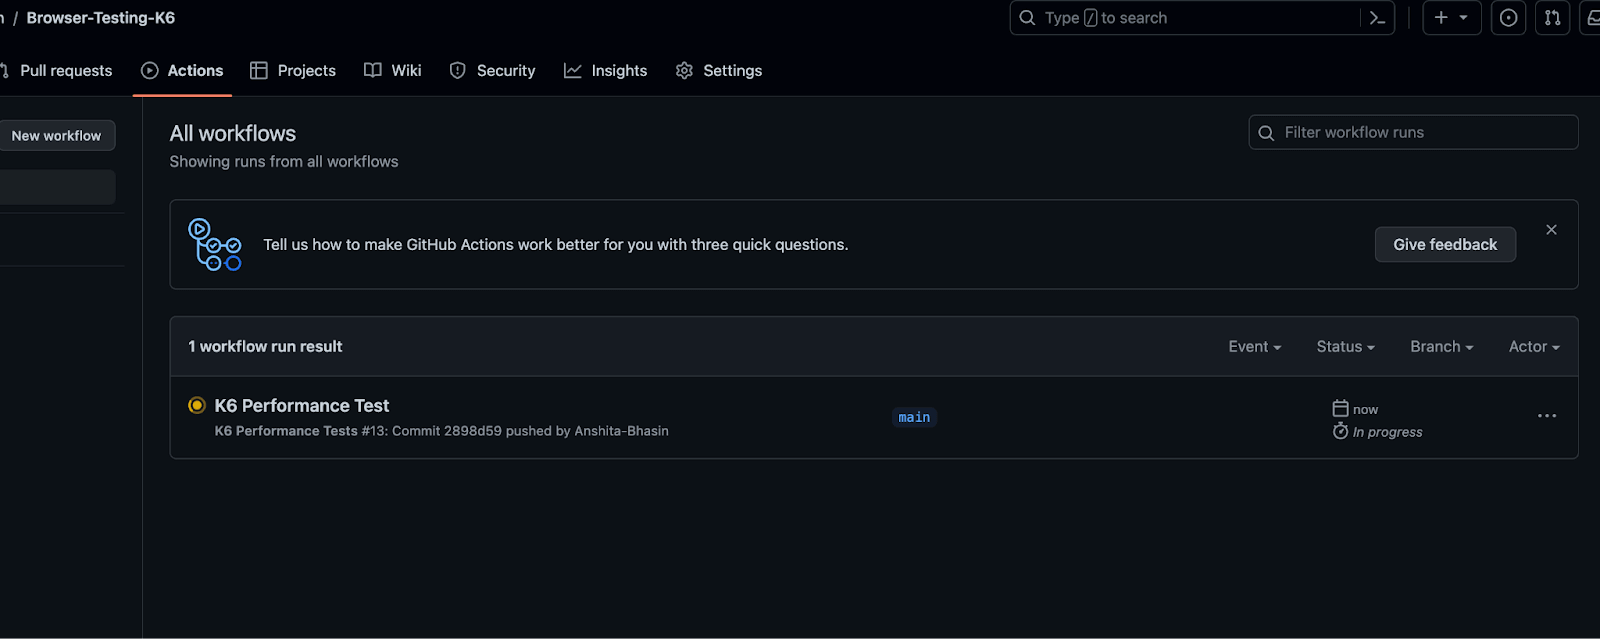
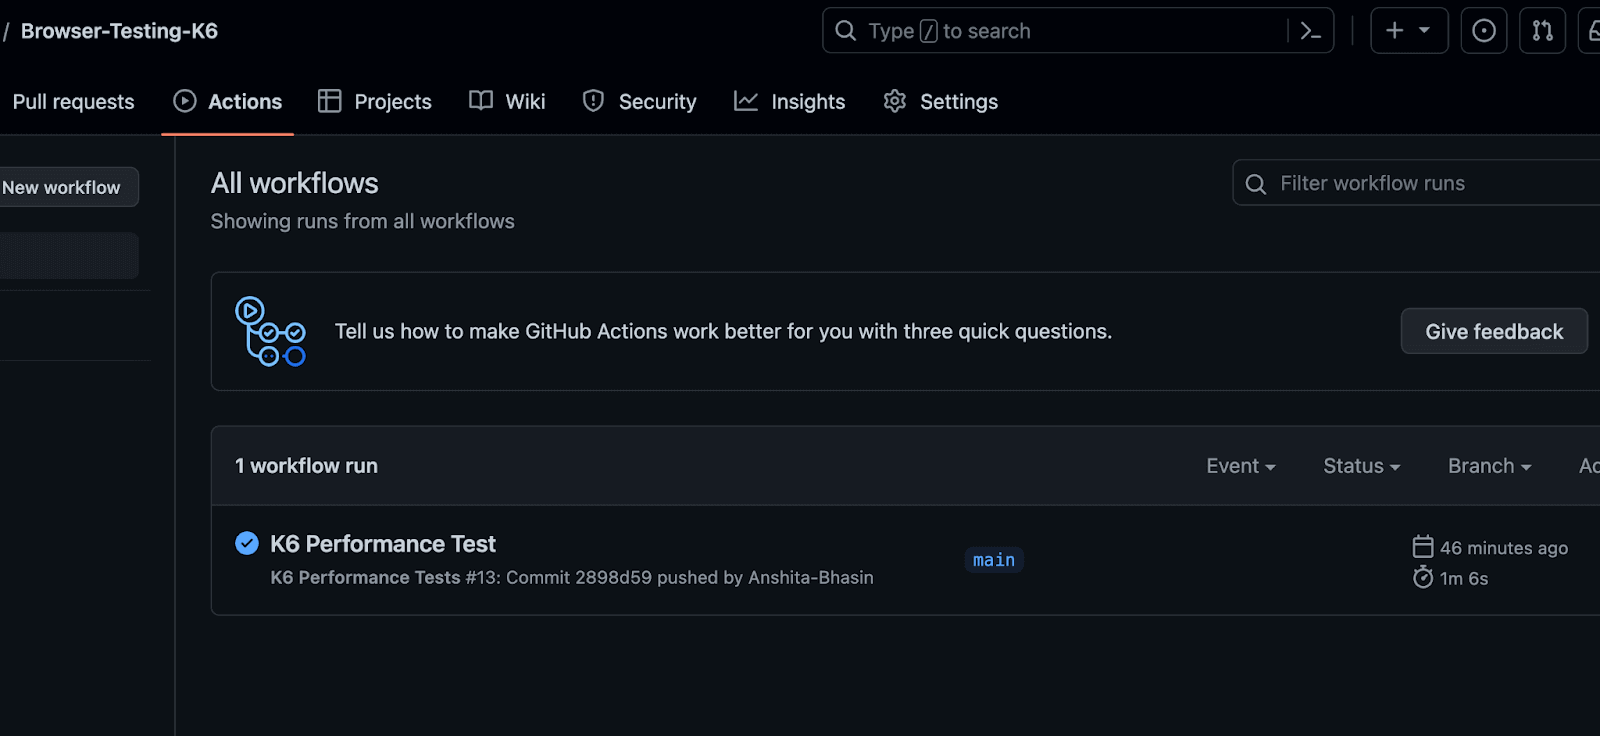
After the execution is completed, you will be able to see the passed workflow under the Actions tab, just like shown below in the execution screenshot.
Go to your GitHub Repository and navigate to the Actions tab (refer to the below screenshot). On the Actions tab, you will be able to see the build running ( like shown below). Click on it to view the logs.
If you click on the workflow run, you’ll see details such as the commit, the status, the time duration, and the report in zip format.
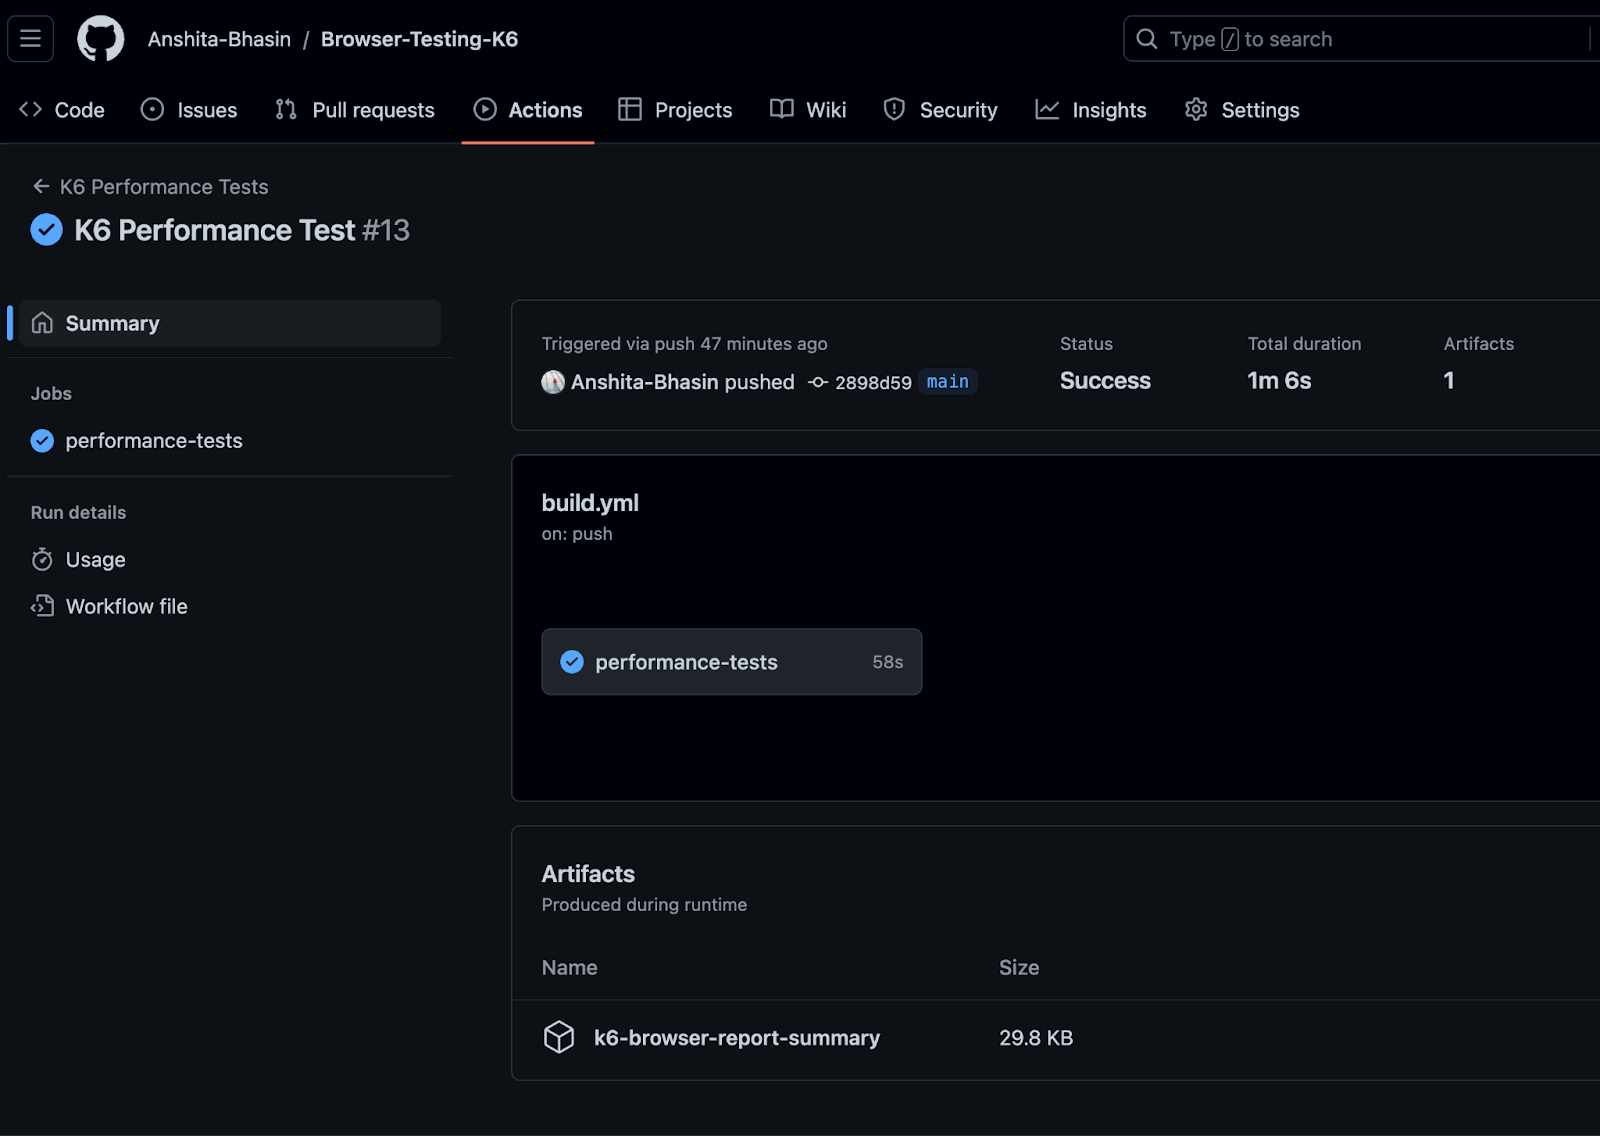
You can also view the logs about setting up the job and completing it by clicking the build.yml file.
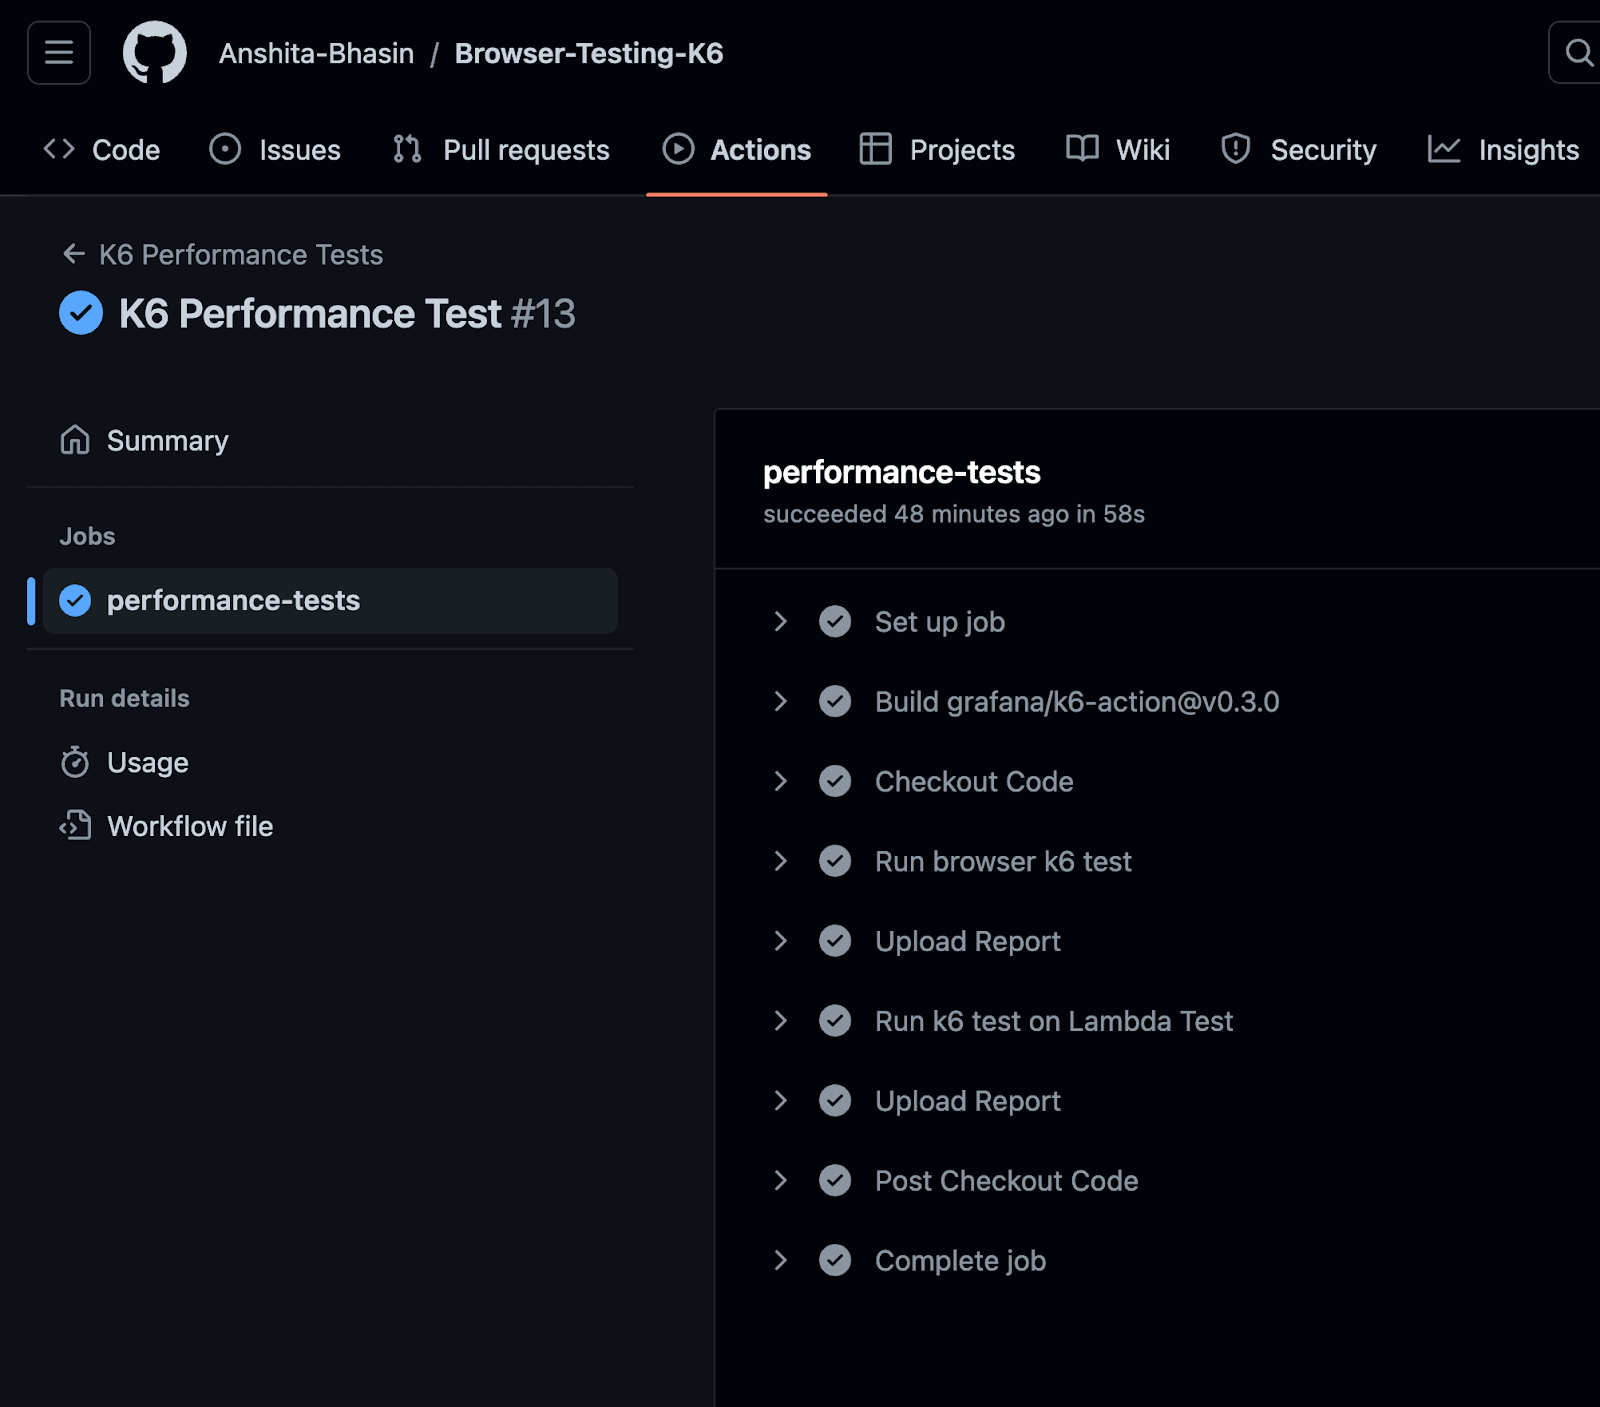
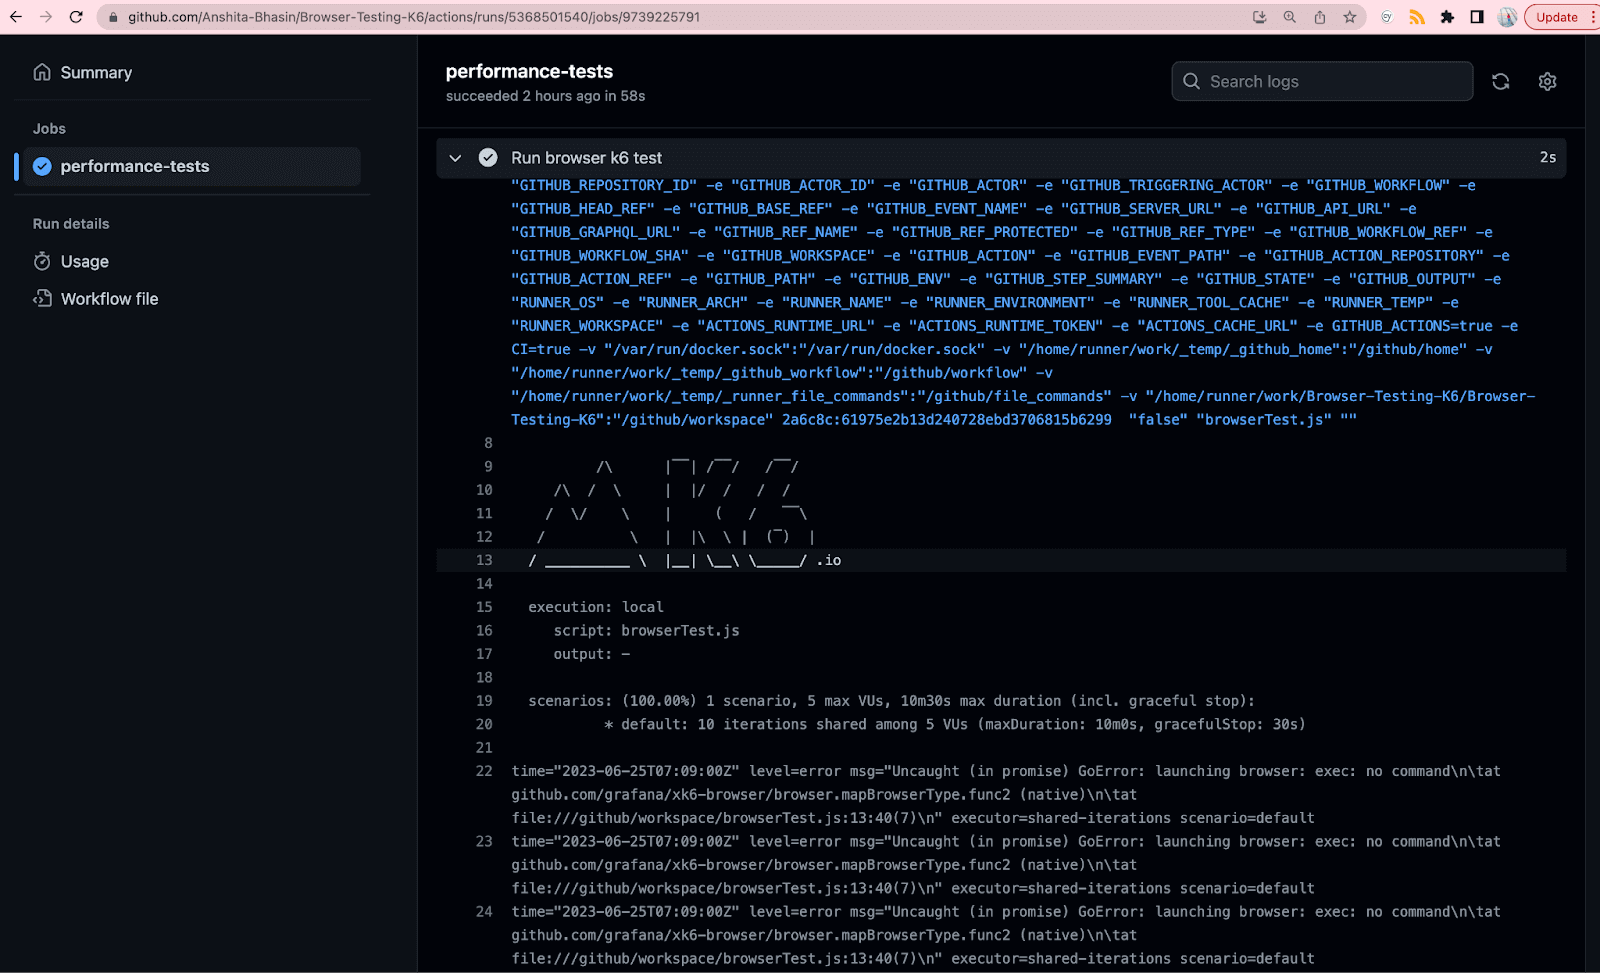
You can expand any of the steps and view the detailed log. Below is the detailed log of steps.
Run browser k6 test
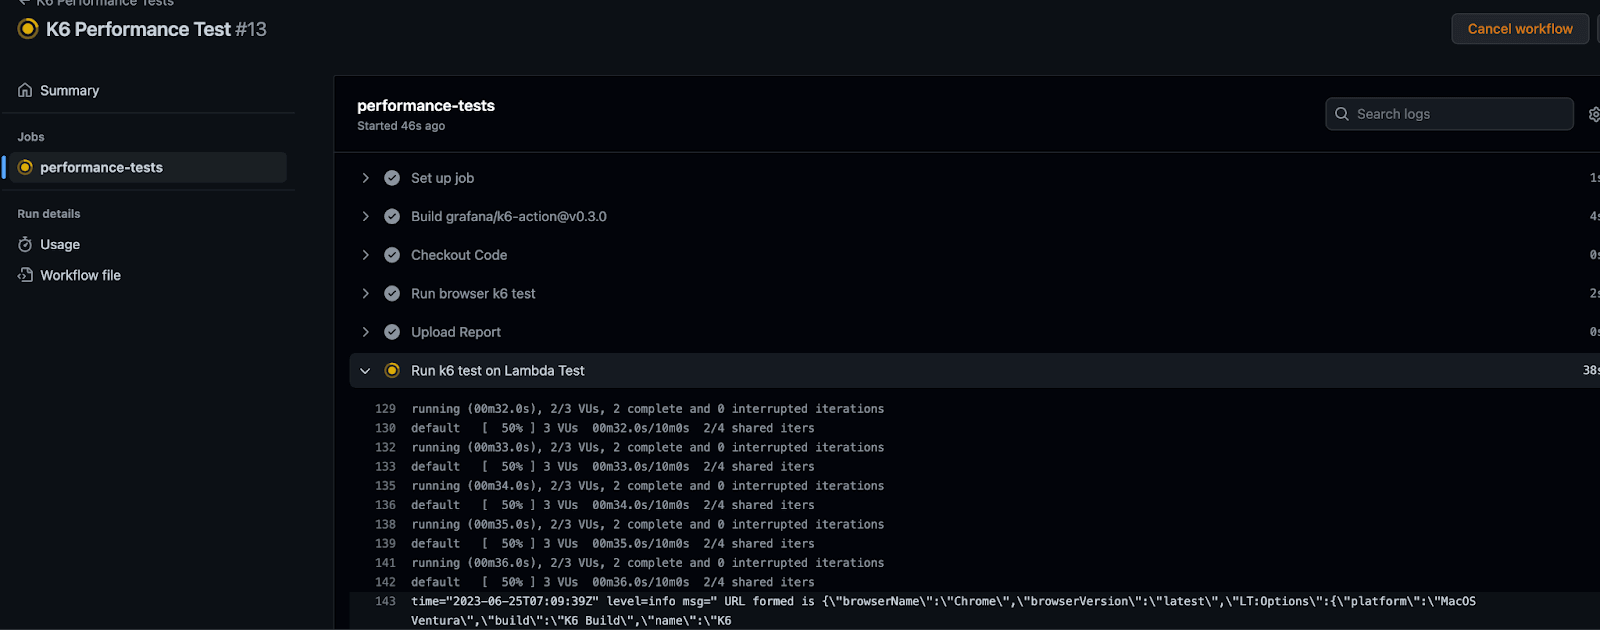
Perform k6 testing on LambdaTest
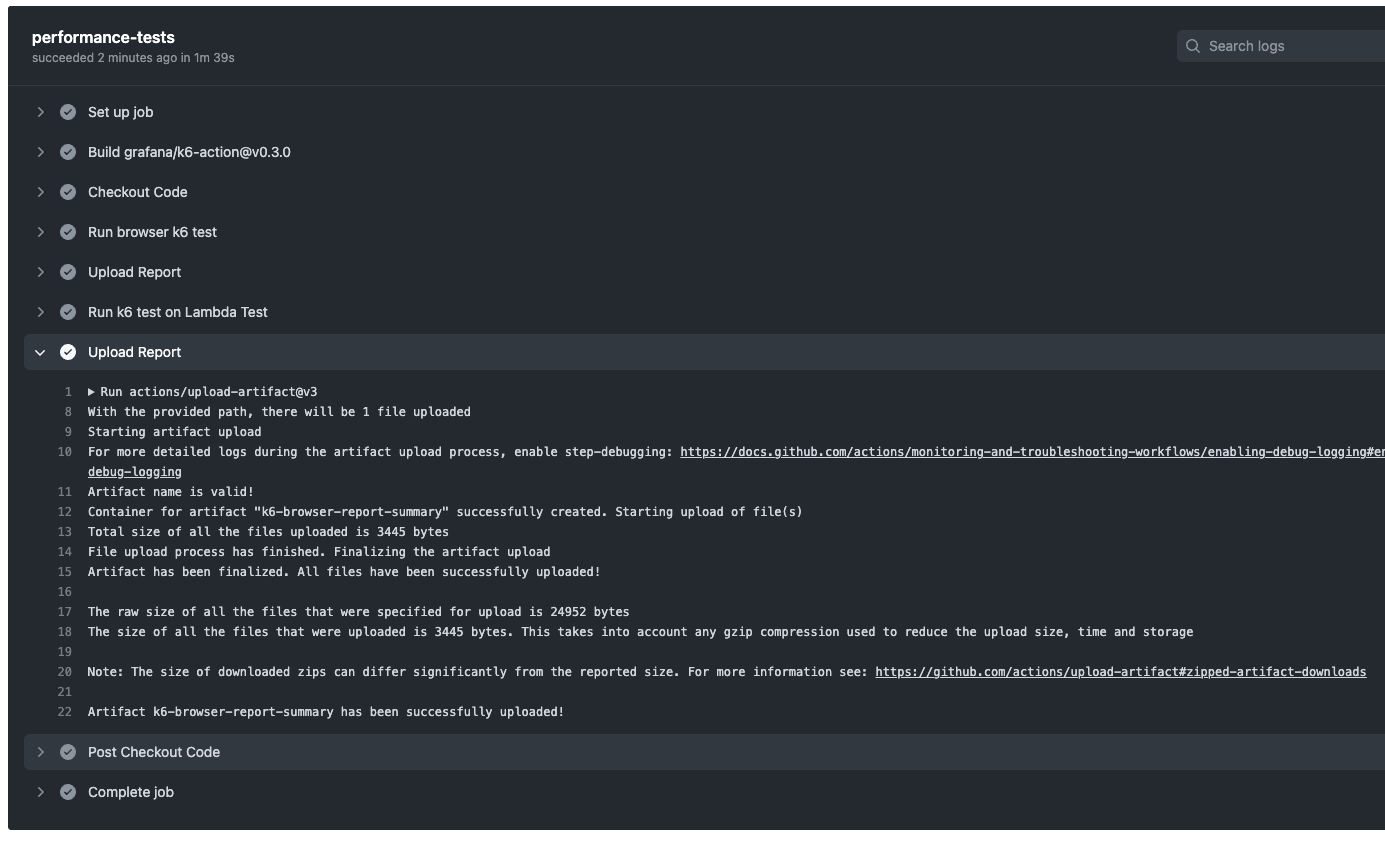
Upload Report: Detailed Logs
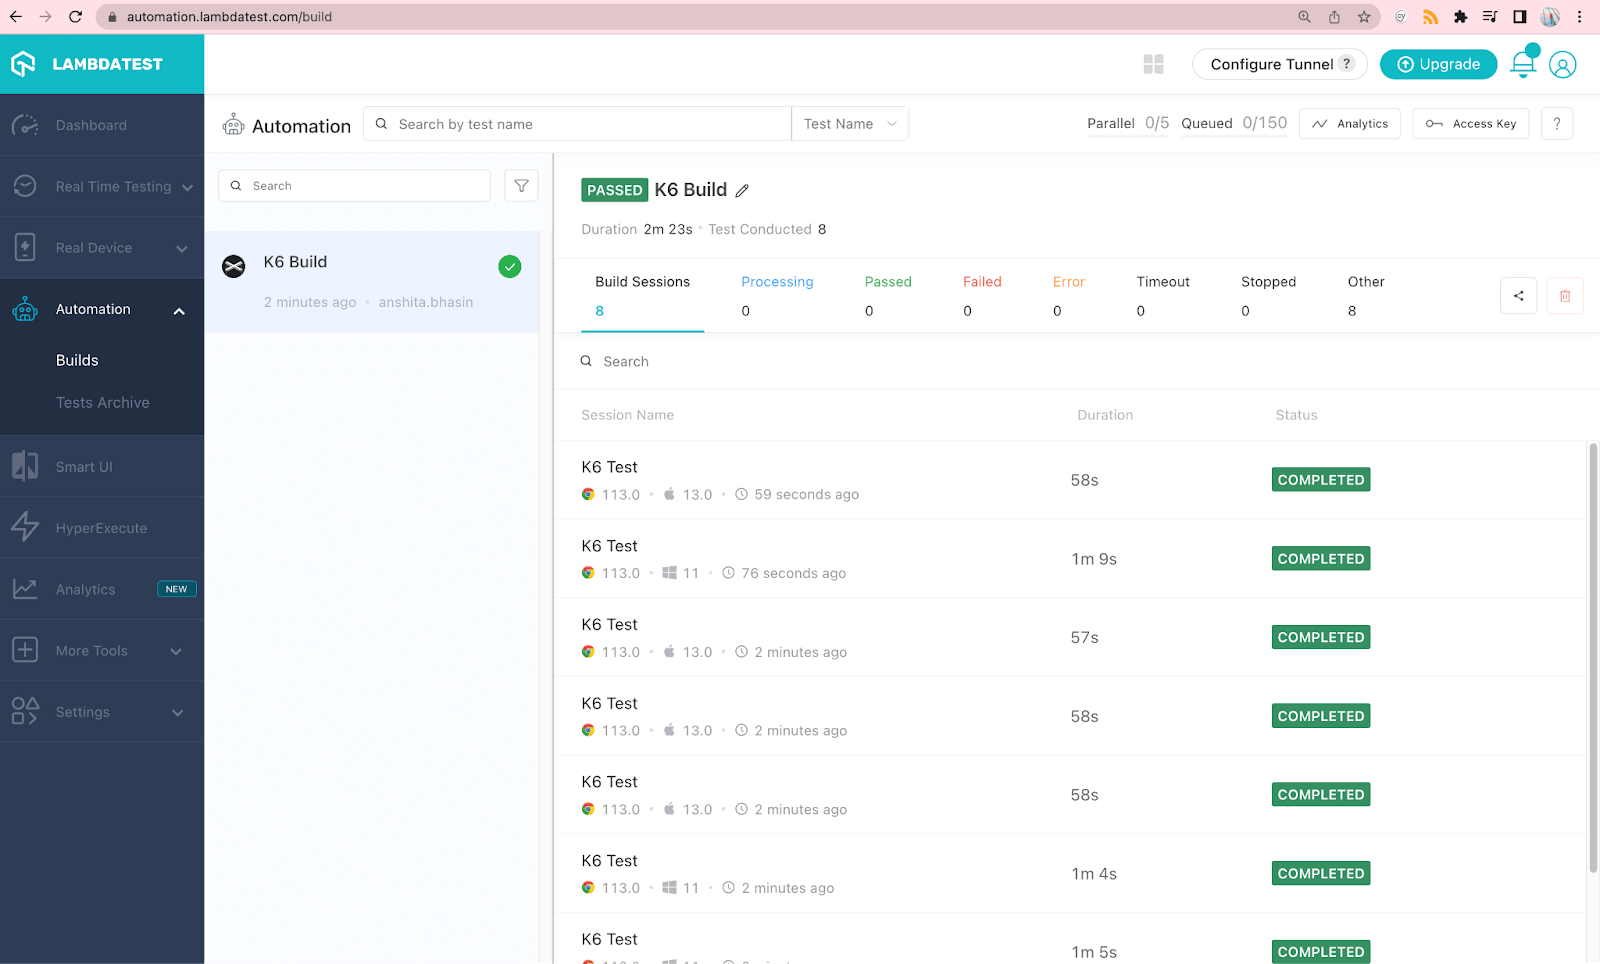
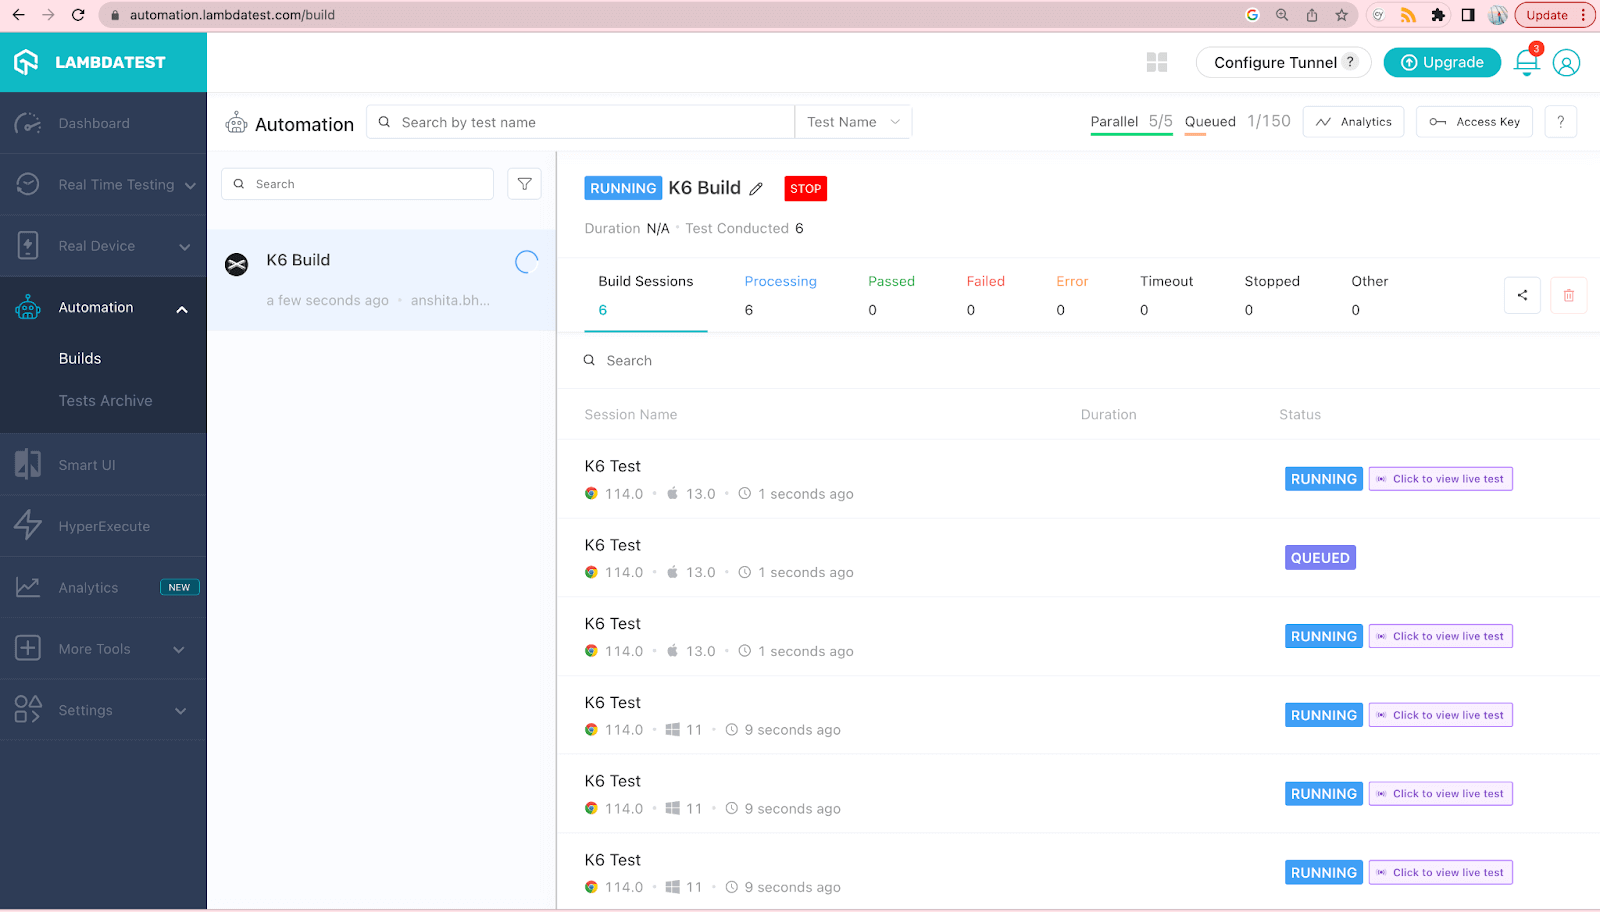
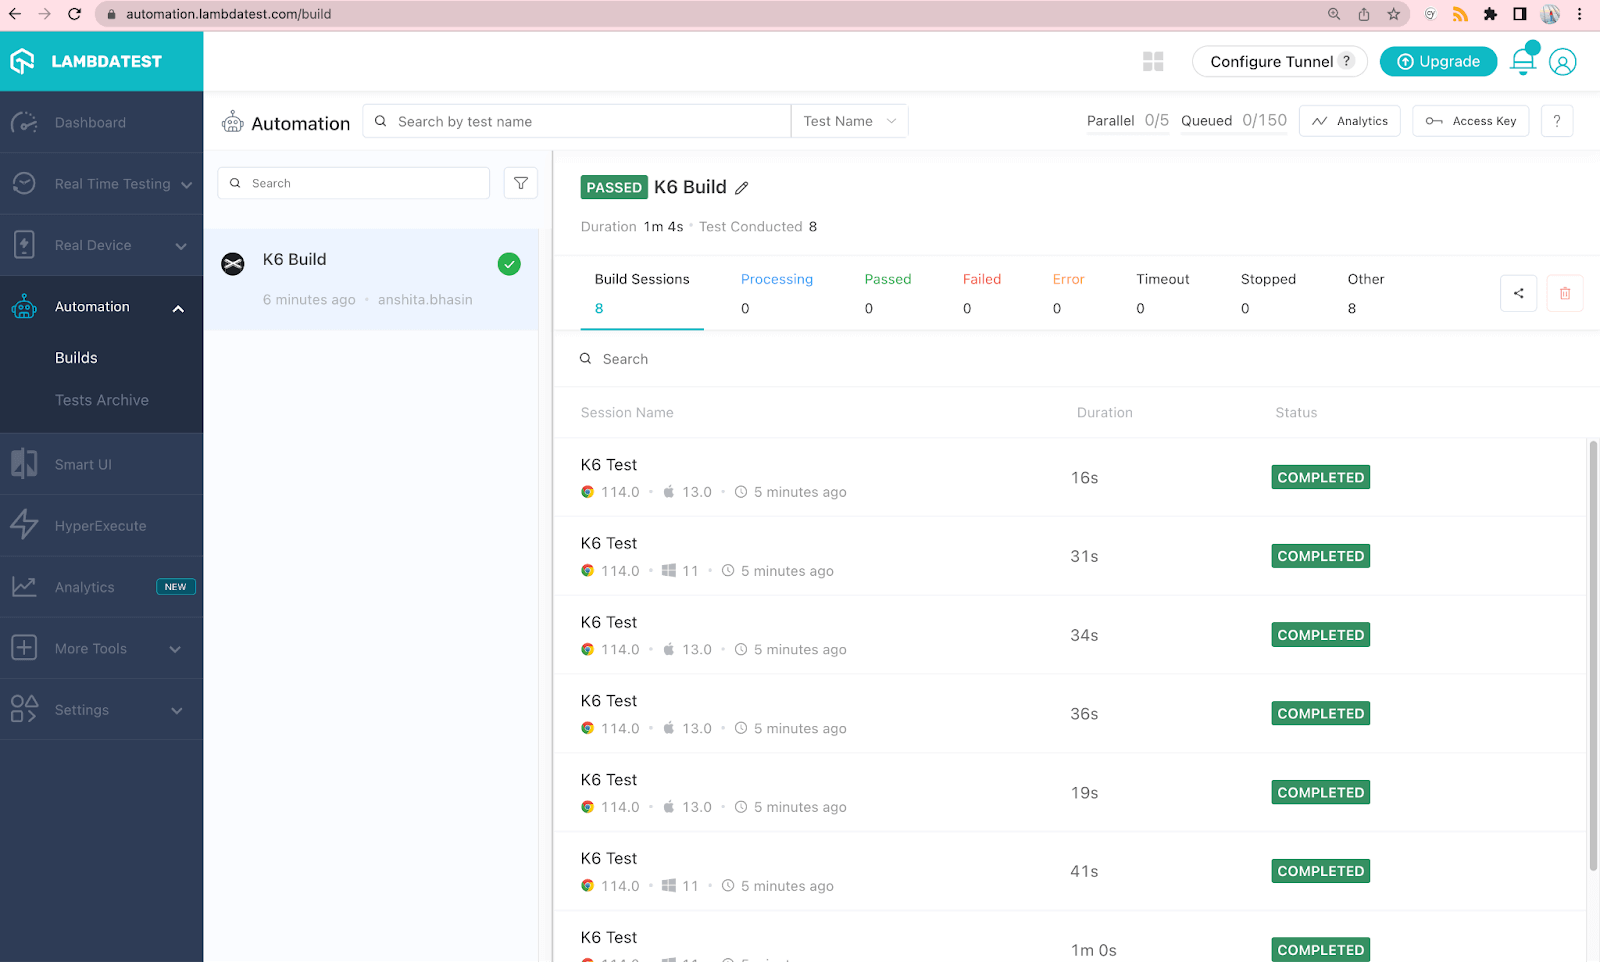
To access the build on the cloud platform, navigate to LambdaTest and go to the Automation tab. Refer to the screenshot below for guidance on locating the builds.
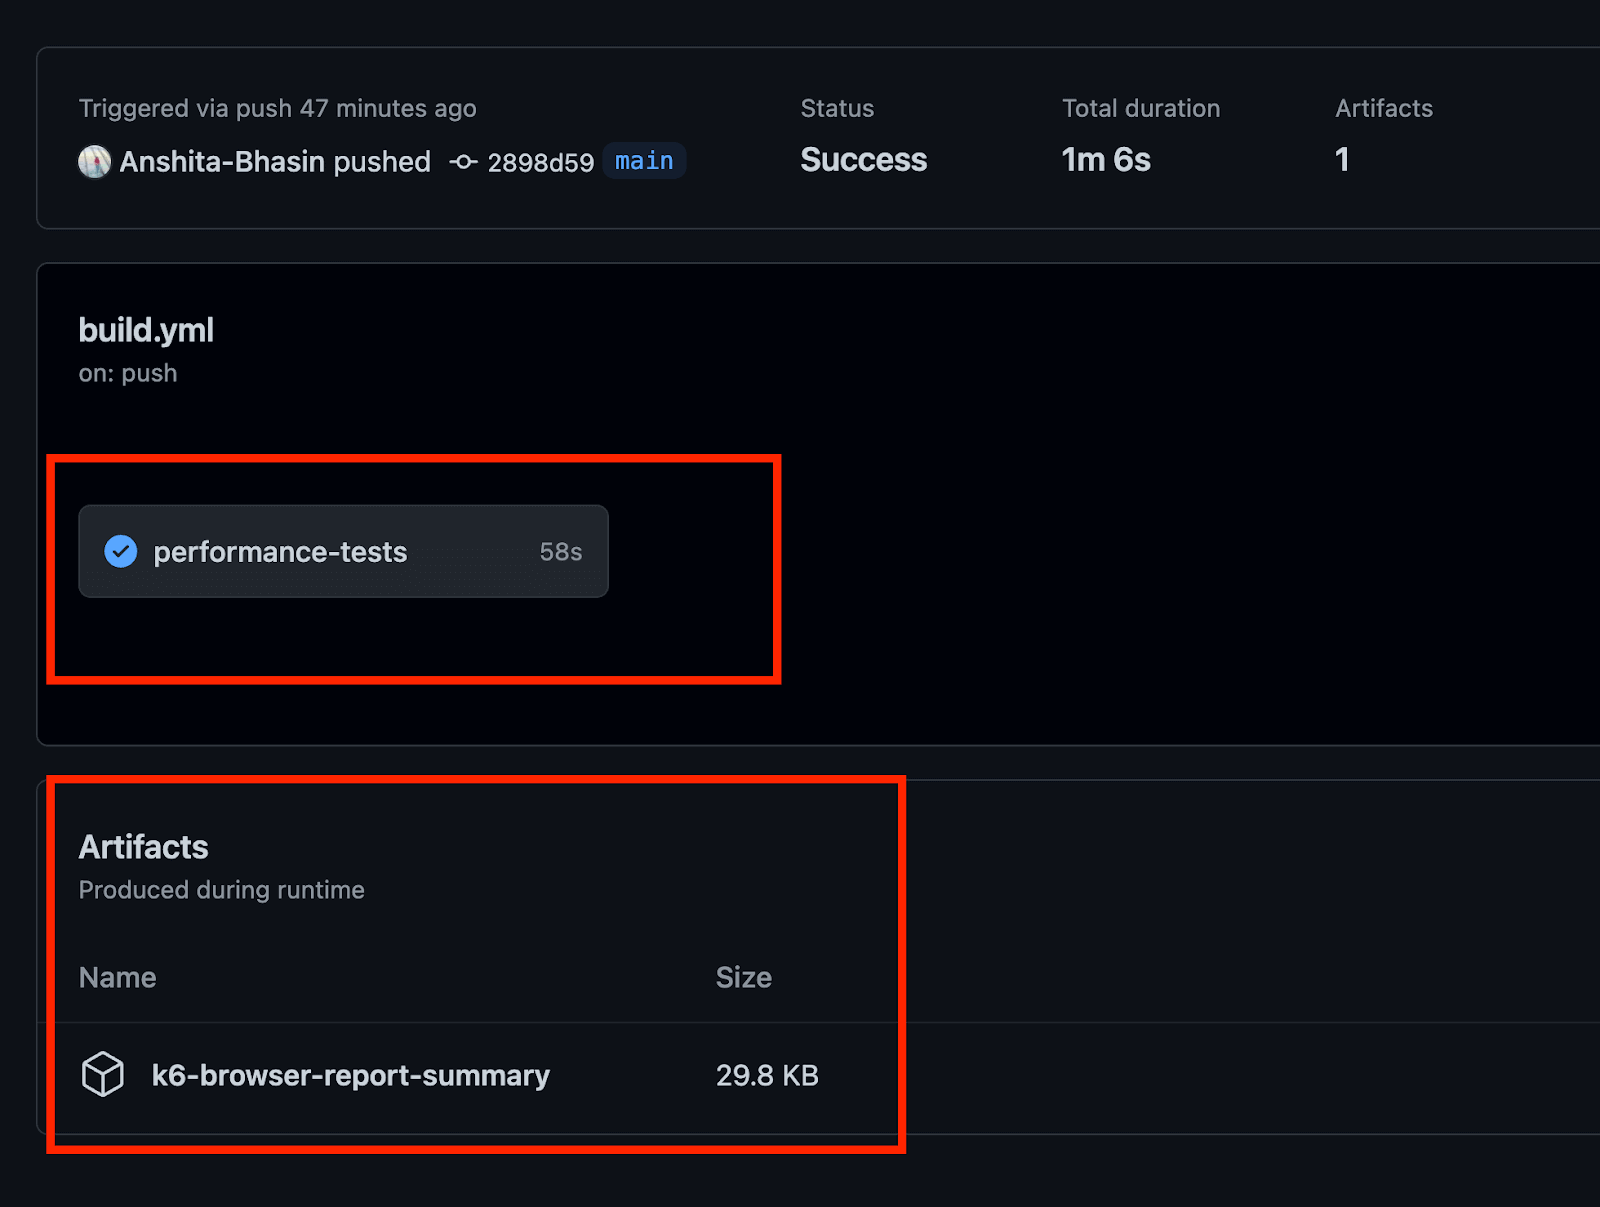
After successfully passing your Actions flow, you can download the associated reports. Navigate to your Actions tab on GitHub and click on the artifact, which will provide access to the reports.
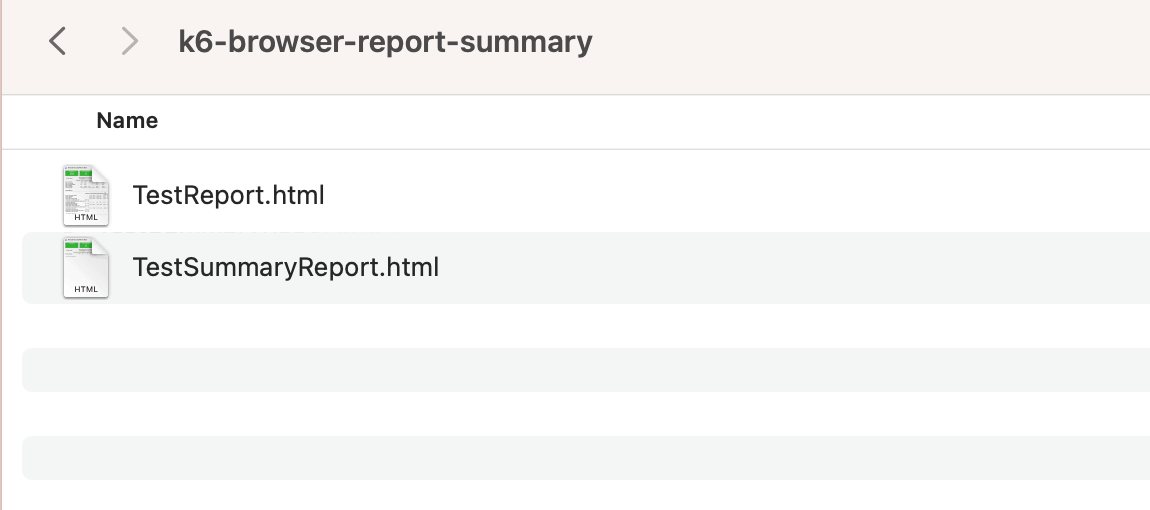
Since two artifacts are uploaded as part of the mentioned test, you can expect to find two reports in a single zip folder.
By clicking on the Artifacts, you can download a zip folder that includes two test reports, similar to the example shown below.
To view the test executed on the cloud platform, navigate to LambdaTest.
Bonus Tips
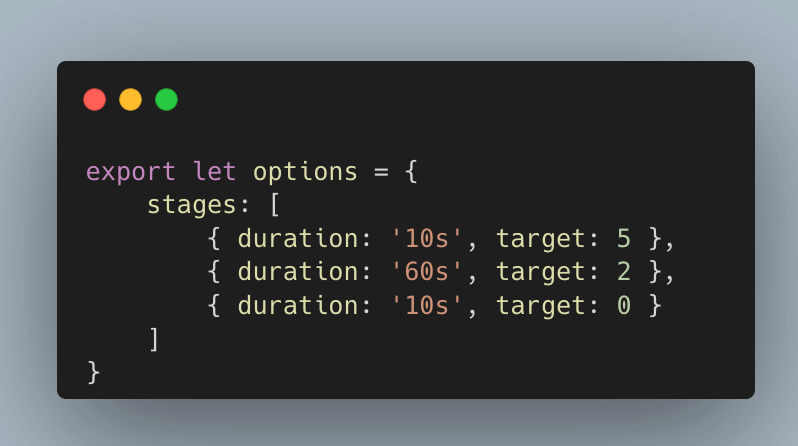
Apart from passing the virtual users and iterations directly in the test, you can also define the load in stages using duration and target values. This allows you to increase the load over a specified duration gradually.
Duration
The duration parameter determines the duration of each load stage, and the target parameter sets the desired number of virtual users (or requests per second) for that stage. By specifying multiple stages, you can create a load test scenario where the load gradually increases or changes over time.
Below is an example of how you can define load stages using duration and target:
In addition to specifying the load stages, you can also define thresholds to monitor specific performance metrics during the test.
Thresholds
It allows you to set criteria for acceptable performance levels and generate alerts or reports if those criteria are not met. This can help identify performance bottlenecks or issues. In the case of thresholds, if the provided expression evaluates to false at the end of the test, k6 considers the whole test a failure.
As part of thresholds, you can define metrics such as error rates (http_req_failed), response times (http_req_duration), or any other relevant metrics using percentile values or specific conditions.
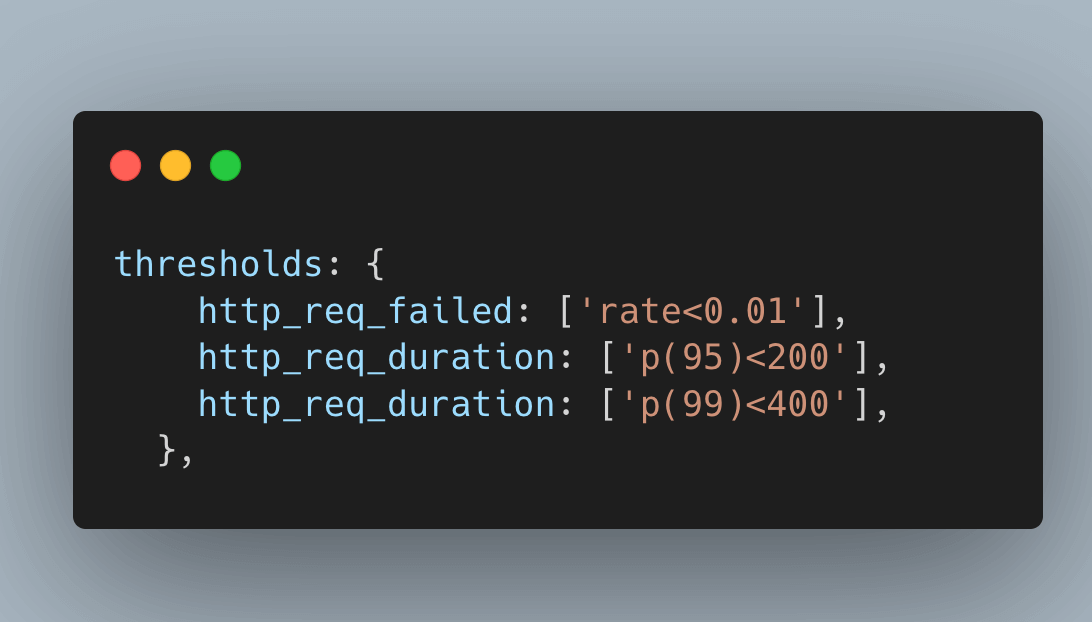
Below is a sample script defining 3 thresholds along with load stages:
- First threshold evaluates the rate of HTTP errors (http_req_failed metric) should be less than 1%.
- Second threshold http_req_duration: [‘p(95)<200'], evaluates whether 95 percent of requests have a response time below 200ms.
- Third threshold http_req_duration: [‘p(99)<400'], evaluates whether 99 percent of requests have a response time below 400ms.
You can further explore the terms and terminologies around k6 through this k6 testing cheat sheet.
Note: Now you can perform online cross browser testing on Brave Browsers to make sure your websites and web apps are compatible with all versions.
Conclusion
k6 is a powerful tool for performing load testing, giving you the ability to pinpoint bottlenecks and enhance performance, resulting in a resilient and efficient application.
In this k6 testing tutorial, we took a deep dive into the fundamentals of performance testing. We conducted two pivotal tests, one on our local environment and the other on a cloud platform, providing a comprehensive understanding of the k6 testing process. Moreover, we provided a step-by-step guide on generating HTML test reports, enabling you to gather valuable insights from your test results.
Furthermore, we explored the seamless integration of k6 into CI/CD workflows using GitHub Actions. This integration empowers you to incorporate load testing seamlessly into your development pipeline, ensuring continuous performance evaluation and optimization.
Frequently Asked Questions (FAQs)
What is k6 testing?
k6 is an open-source load testing tool used to perform performance and load testing for web applications and APIs. It allows developers and testers to simulate high user loads and analyze the system’s performance under various scenarios.
With k6, you can write test scripts in JavaScript to define user scenarios, set virtual user behavior, and analyze the performance metrics and results. k6 provides features like distributed load testing, scripting flexibility, metrics visualization, and integration with CI/CD pipelines. It is designed to be developer-friendly and scalable, making it a popular choice for load testing and performance testing of web applications and APIs.
Which is better: k6 or JMeter?
The choice between k6 and JMeter depends on various factors and specific use cases. Here are some points to consider:
- Scripting Language: k6 uses JavaScript, a widely-used language with a large developer community. JMeter uses its scripting language called JMeter Scripting Language (JSL), or it can also be scripted in Java. If you are already proficient in JavaScript, k6 may be more intuitive for you.
- Performance and Scalability: k6 is known for its performance and scalability. It is built on a modern and lightweight architecture, allowing it to handle many concurrent users efficiently. JMeter, on the other hand, may require more resources for large-scale testing due to its Java-based architecture.
- Ease of Use: k6 is designed to be developer-friendly, with a focus on simplicity and ease of use. It offers a clear and intuitive syntax, making it easier for developers to write and maintain test scripts. JMeter has a steeper learning curve and may require more effort to set up and configure, especially for complex scenarios.
Ultimately, the choice between k6 and JMeter depends on your specific requirements, familiarity with scripting languages, and the type of testing you need to perform. It can be helpful to evaluate both tools based on your specific use case and consider factors such as scripting language preference, performance needs, ease of use, and available community support.
How does k6 load testing work?
k6 load testing works by simulating virtual users (VUs) that interact with your web application or API. Here is an overview of how k6 load testing operates:
- Test Script Creation
- Virtual User Simulation
- Load Generation
- Performance Monitoring
- Analysis and Reporting
- Iterative Testing and Optimization
k6 offers additional features like distributed load testing, integration with CI/CD pipelines, and cloud platform integration, which allow you to scale your load tests and integrate them seamlessly into your development and deployment processes.
Overall, k6 simplifies the process of load testing by providing a developer-friendly approach, intuitive scripting capabilities, and powerful performance monitoring features.


Author’s Profile
Anshita Bhasin
Anshita Bhasin is a Senior QA Automation Engineer with over 9 years of experience in the software industry. Throughout her career, She has gained expertise in a variety of tools and technologies, including Rest Assured, Selenium, and Cypress. Currently, She is working at a PropTech company in Dubai. In addition to her technical expertise, she is also passionate about sharing her insights and experiences with others in the form of blogs and workshops to help guide those just starting out in their careers or seeking advice on their professional paths.
Blogs: 6
Got Questions? Drop them on LambdaTest Community. Visit now


