
How To Use Playwright Inspector For Debugging
Jaydeep Karale
Posted On: May 19, 2023
![]() 168825 Views
168825 Views
![]() 33 Min Read
33 Min Read
Debugging is the process of identifying and resolving errors or bugs in software. In web automation testing, debugging plays a crucial role in ensuring the reliability and accuracy of automated tests. Additionally, it enables the validation of functionality by applying dynamic values.
According to the Systems Sciences Institute at IBM, the expense of addressing an error discovered after product release was four to five times higher than identifying it during the design phase and even up to 100 times greater than one detected during the maintenance phase.
The debugging process typically involves noting the error, identifying the error location based on expertise, setting debugger breakpoints, analyzing the code step-by-step at runtime, finding the exact location of the issue, fixing the problematic code line, and validating the code to ensure a successful error fix.
Choosing an automation testing framework with effective and robust debugging tooling is key to writing and maintaining a high-quality test automation suite. Playwright, an open-source framework released by Microsoft in 2020, is quickly becoming popular for cross-browser testing.
Playwright can work with the browser at the API level and provides robust tooling with the built-in Playwright Inspector.Playwright Inspector simplifies creating automation scripts by providing auto code generation capabilities. With Playwright Inspector, developers, and testers can interactively explore web applications, inspect elements, and perform actions such as clicking buttons, filling forms, and navigating through pages.
Playwright Inspector lets you view the DOM structure of a webpage, inspect CSS styles, and interact with web elements using the Playwright API. It allows stepping through tests, live locators editing, picking locators, and seeing actionability logs.
One of the standout features of Playwright Inspector is its ability to record and replay user interactions. This functionality allows developers to reproduce bugs and see how their web applications behave in different scenarios. This information can be used to debug and fix issues more effectively.
In this blog, we will explore Playwright Inspector, a graphical user interface (GUI) tool that allows us to inspect and debug Playwright scripts interactively in great detail. If you’re looking to improve your playwright interview skills, check out our curated list of questions and answers at Playwright interview questions.
So, let’s get started!
TABLE OF CONTENTS
What is Playwright?
Playwright, developed by Microsoft, is an open-source end-to-end web testing and browser automation framework. It offers excellent cross-browser compatibility and user-friendly features, making it an ideal option for automation and quality assurance purposes.
It is flexible and supports multiple languages such as Python, TypeScript, JavaScript, Java, and C#. It uses a single automation API which makes it reliable and fast and produces consistent results while performing cross browser testing.
Playwright provides a robust and powerful set of testing features that can be used to simulate user interactions with the web application. With Playwright, we can test complex scenarios such as login flows, file uploads, and other interactions that are difficult to test with other testing frameworks.
It offers a wide range of built-in and custom locators to help developers easily and efficiently locate elements on web pages. Locators can identify elements based on their attributes, text content, position on the page, and more. Playwright locators help to reliably identify elements on DOM and thus build resilient and robust test suites.
If you are preparing for an interview you can learn more through Playwright interview questions.
A quick summary of features of Playwright
- Multi-Browser Support
- Advanced Browser Automation
- Powerful Debugging Capabilities
- Easy to Use and Flexible
- Scalability
- Auto-wait and Retry
Playwright supports cross-browser automation, which includes Chrome, Firefox, Safari, and Microsoft Edge. This makes it easier for developers to write tests that can run on different browsers.
Playwright provides a rich set of APIs for automating browser interactions such as page navigation, filling out forms, clicking buttons, and much more.
Playwright allows developers to easily debug their tests with tools like the built-in debugger and visual logs, making it easier to diagnose issues during test development.
Playwright is designed to be easy to use and flexible, with a simple API that allows developers to write tests in their preferred programming languages, such as JavaScript, TypeScript, or Python.
Playwright allows developers to run tests in parallel across multiple browsers and devices, making it easy to scale up test suites to handle large-scale testing scenarios.
Playwright’s auto-wait and retry features make it easier to handle flaky tests by automatically waiting for page elements to become available and retrying failed test steps, improving the reliability of tests.
You can also subscribe to the LambdaTest YouTube Channel and stay updated with the latest tutorial around Selenium testing, Playwright browser testing, Appium, and more.
Enhance your testing strategy with our detailed guide on Playwright Headless Testing. Explore further insights into Playwright’s capabilities in this guide.
What is a Playwright Inspector?
Playwright Inspector is a GUI-based tool that helps developers & testers record scripts and debug Playwright tests. It helps generate boilerplate code, which can be a good starting point for building code. This helps developers & QA teams save time which may be required when writing everything from scratch.
Developers can use the saved time to understand the code base and then confidently make relevant changes as and when needed to improve the test suites.
The Playwright Inspector can be started using the codegen command followed by the website URL to inspect. The URL is optional and can also be added when the browser starts.
|
1 |
playwright codegen https://ecommerce-playground.lambdatest.io/ |
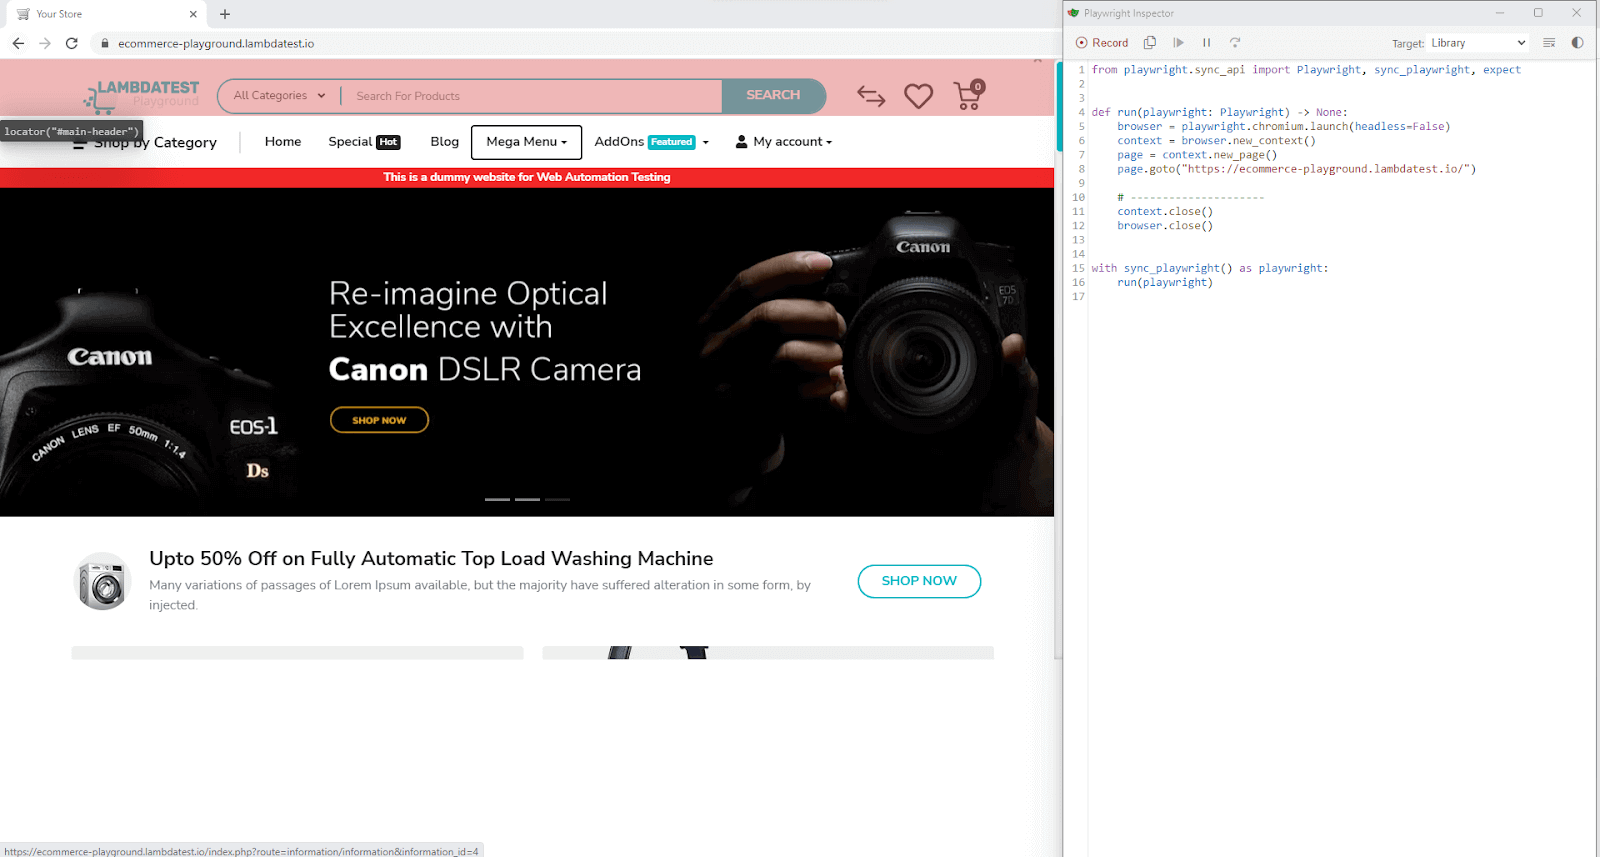
On running the command by specifying the URL:
- Playwright Inspector will open the mentioned website in Chromium by default
- Initiate the Playwright Inspector tool, record actions up to the current point, and showcase the corresponding code snippet.
- Our action at this point has been to only navigate to the LambdaTest eCommerce Playground URL code for that action to be present.
- Playwright, by default, will display code using the Library API to handle the creation of the browser, context, and page explicitly.
- On the created page, the goto() method is called with the URL specified on the command line.
Run Automated Playwright Tests Online.Try LambdaTest Now!
Features of Playwright Inspector
Generating code first and subsequently refining it is a practical and time-saving approach. One of the USPs of Playwright is the Playwright Inspector tool, which helps developers record scripts and debug Playwright tests using breakpoints. Here are some of the key features of the Playwright Inspector tool:
- Boilerplate Code
- Network trace analysis
With its intuitive interface and powerful features, Playwright Inspector makes it easy for developers to find and fix bugs in their code. One of the standout features of Playwright Inspector is its ability to record and replay user interactions.
Playwright Inspector records user actions and helps find elements by using the Playwright locators and selecting the best locator for the element. This functionality allows developers to reproduce bugs and see how their web applications behave in different scenarios.
This feature enables tracking the performance of web applications and identifies any bottlenecks that may be affecting user experience. This information can then be used to optimize code to improve the performance of web applications.
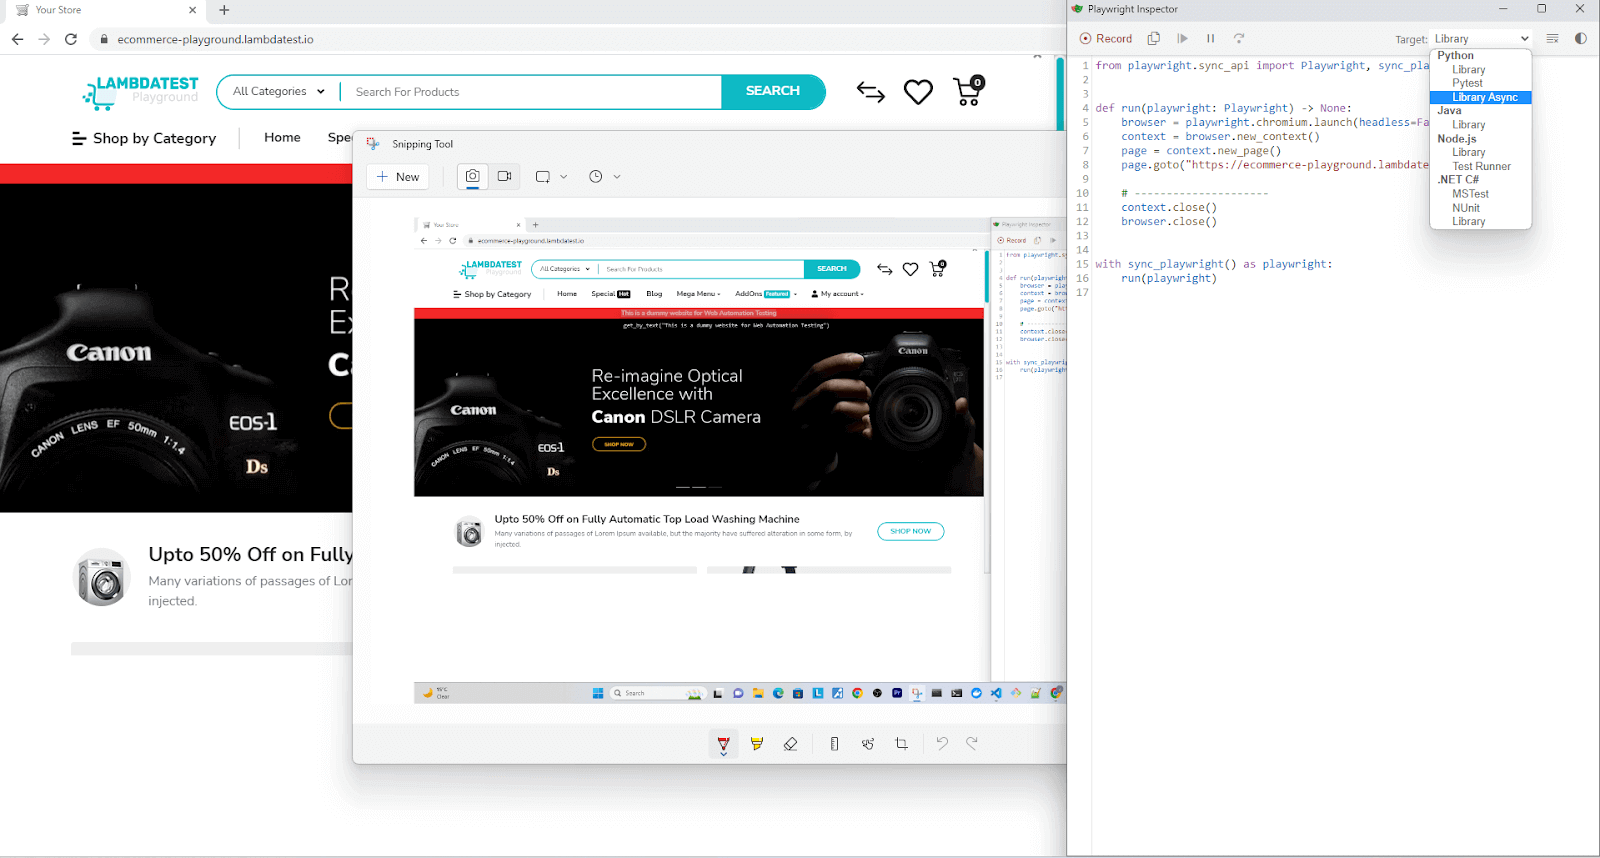
As Playwright supports multiple languages, you can choose your preferred language using the drop-down at the top right, as seen in the image below.
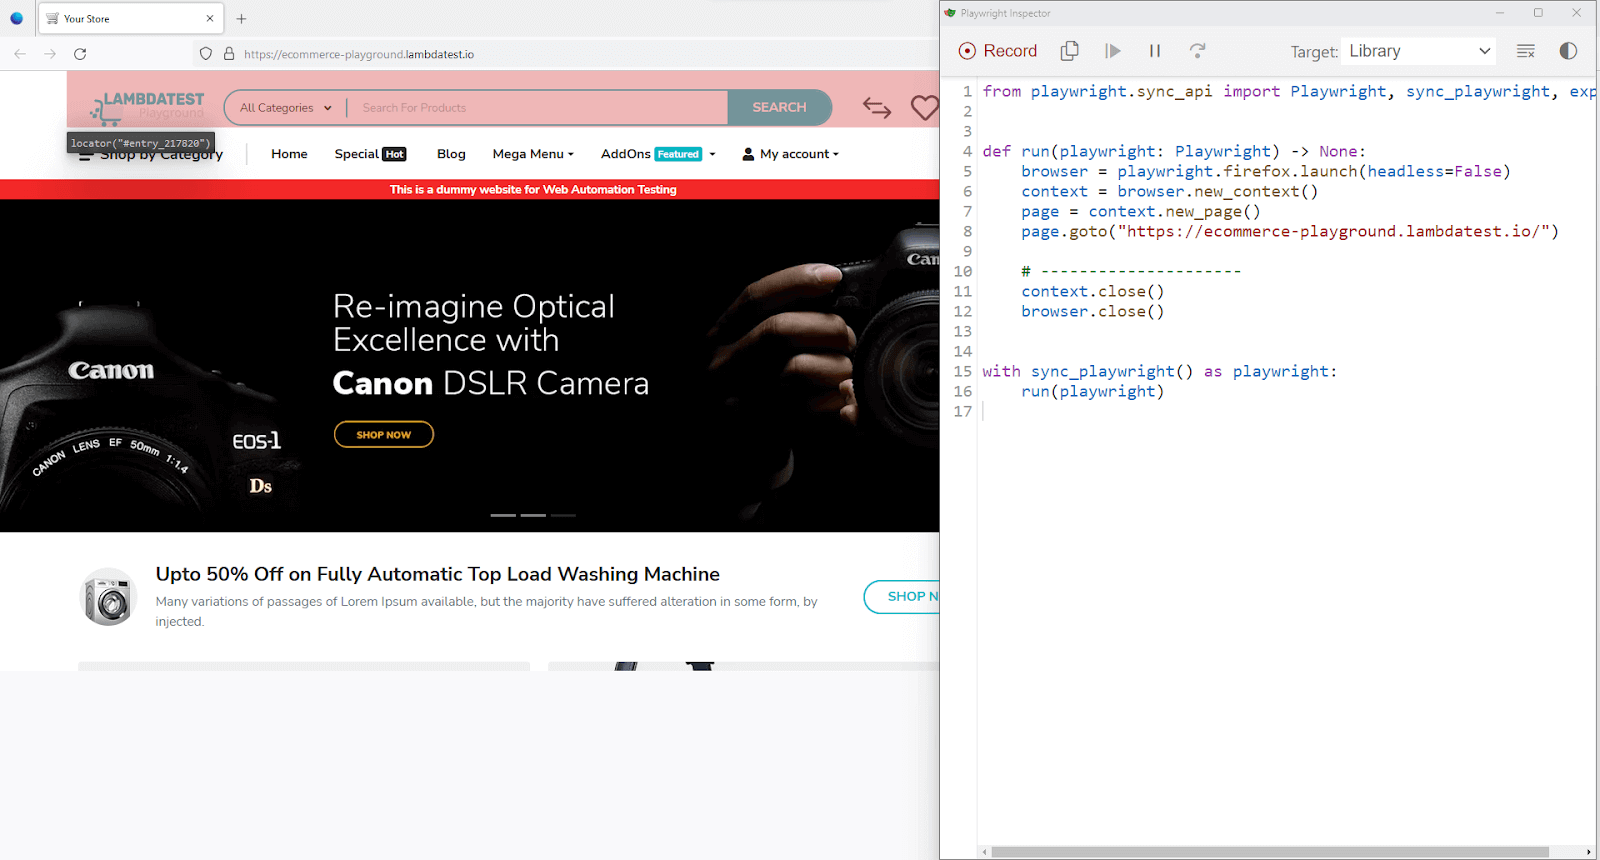
The Playwright Inspector tool will always use Chromium by default, but that behavior can be overridden using the – -browser flag on the command line. As Playwright supports WebKit, Chromium, and Firefox, the other option we can use with – -browser is WebKit.
|
1 |
playwright codegen https://ecommerce-playground.lambdatest.io/ --browser firefox |
Now we have seen some of the core features of Playwright Inspector. In the next section, we will learn more about its advantages and shortcomings.
Advantages of Playwright Inspector
The Playwright Inspector tool offers several advantages. Let’s look at some key benefits of the Playwright Inspector:
- Easy Debugging
- Record and Replay
- Intuitive Interface
- Robust Logging
- Breakpoints
- Cross-Browser Support
Playwright Inspector simplifies the process of debugging Playwright scripts by providing a visual interface that allows developers to inspect the page, modify its state, and identify the cause of issues quickly.
Playwright Inspector offers a record and replay feature that allows testers and QA teams to record user actions on the page and replay them for debugging purposes.
This feature can help identify issues that may only occur during specific user interactions.
Playwright Inspector has an intuitive and user-friendly interface. It is easy to navigate and use, even for testers and QA teams new to Playwright.
Playwright Inspector offers robust logging capabilities that allow testers and QA teams to trace the execution flow of their test script.
This helps quickly identify issues and make fixes, thereby improving trust in the code and application itself.
The Playwright Inspector tool allows testers and QA teams to set breakpoints in their test script, pause test execution at specific points and investigate the page’s state.
This provides greater control and visibility over the testing process. It helps improve the overall efficiency and effectiveness of the testing process
Playwright Inspector supports multiple Chromium-based browsers, including Chrome, Edge, and Firefox, allowing developers to test and debug their applications across various platforms.
Overall, the Playwright Inspector tool is valuable for developers looking to debug their Playwright scripts effectively. Its intuitive interface, record and replay capabilities, and robust logging features make it a powerful tool for identifying and resolving issues quickly.
Shortcomings of Playwright Inspector
Although Playwright Inspector is a powerful tool for debugging test scripts while performing Playwright automation, it does have a few limitations and potential drawbacks:
- Failure To Record Mouse Scroll
- Manual Coding For Testing Lazy-Loaded Elements
- Overhead & Resource Consumption
- Limited Customization
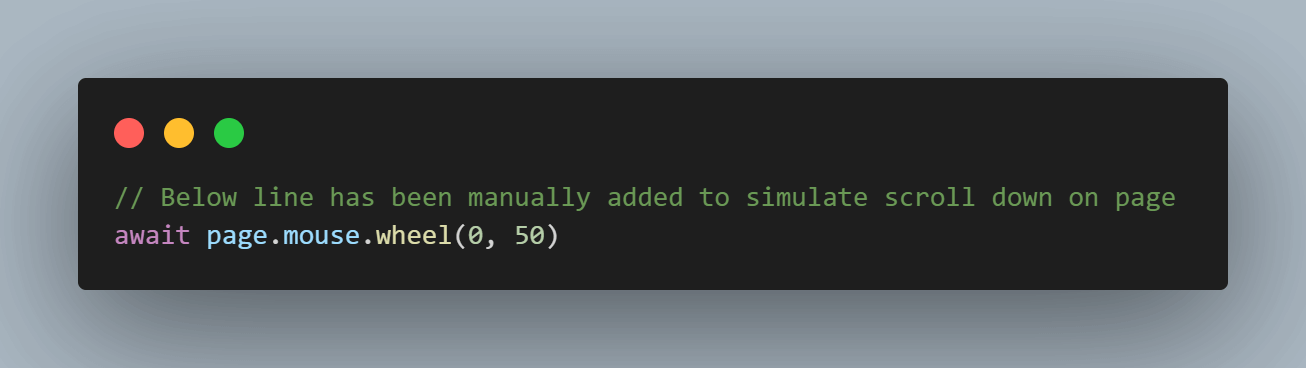
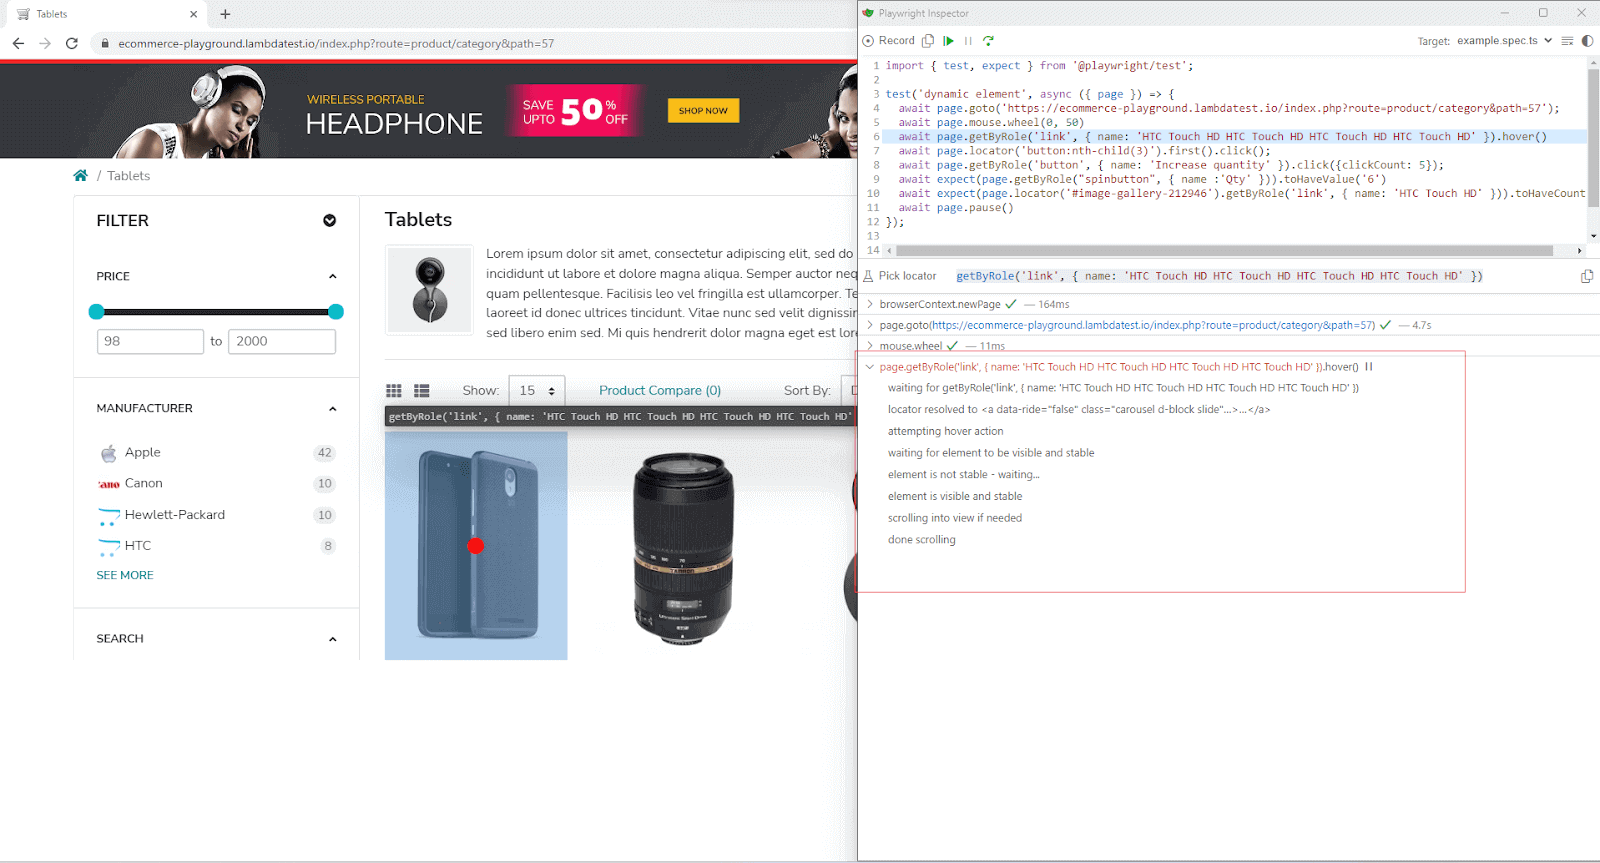
Playwright Inspector does not record mouse scroll events. Hence, for tests that require us to scroll down to elements to prepare locators, a manual task is involved in writing the mouse scroll event. The video/gif shows the user action of scrolling down on a page and Playwright Inspector, which makes no record of the scroll
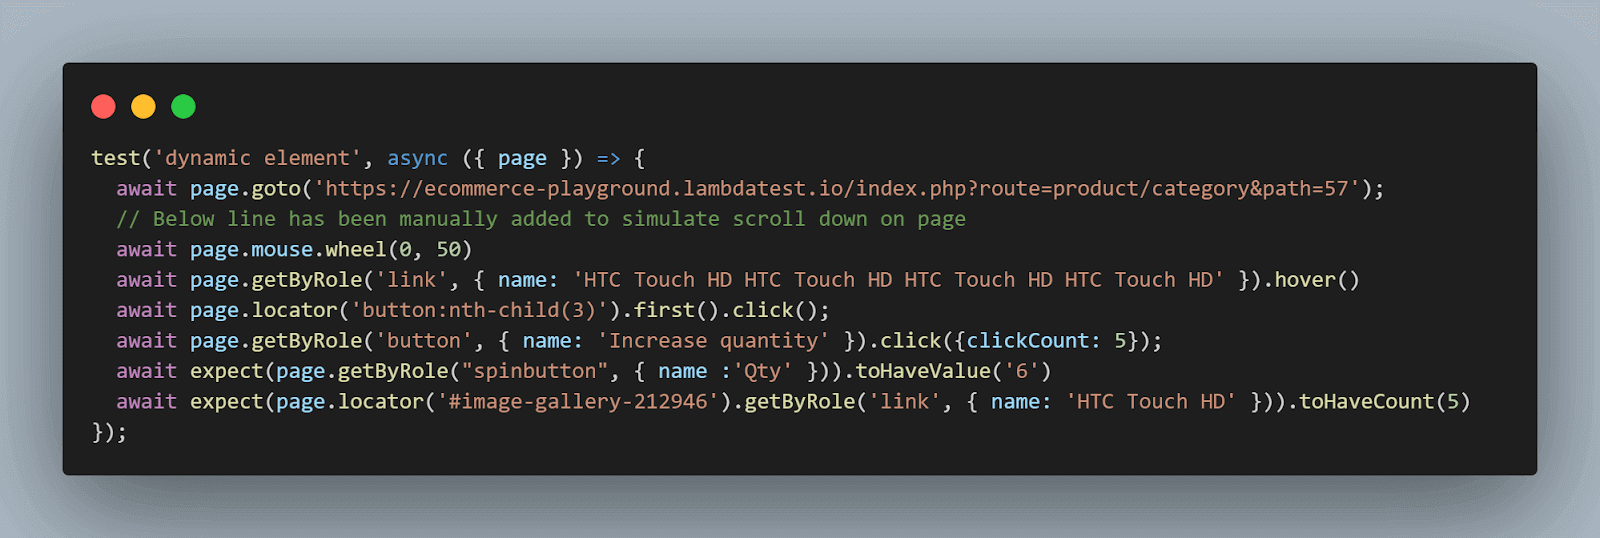
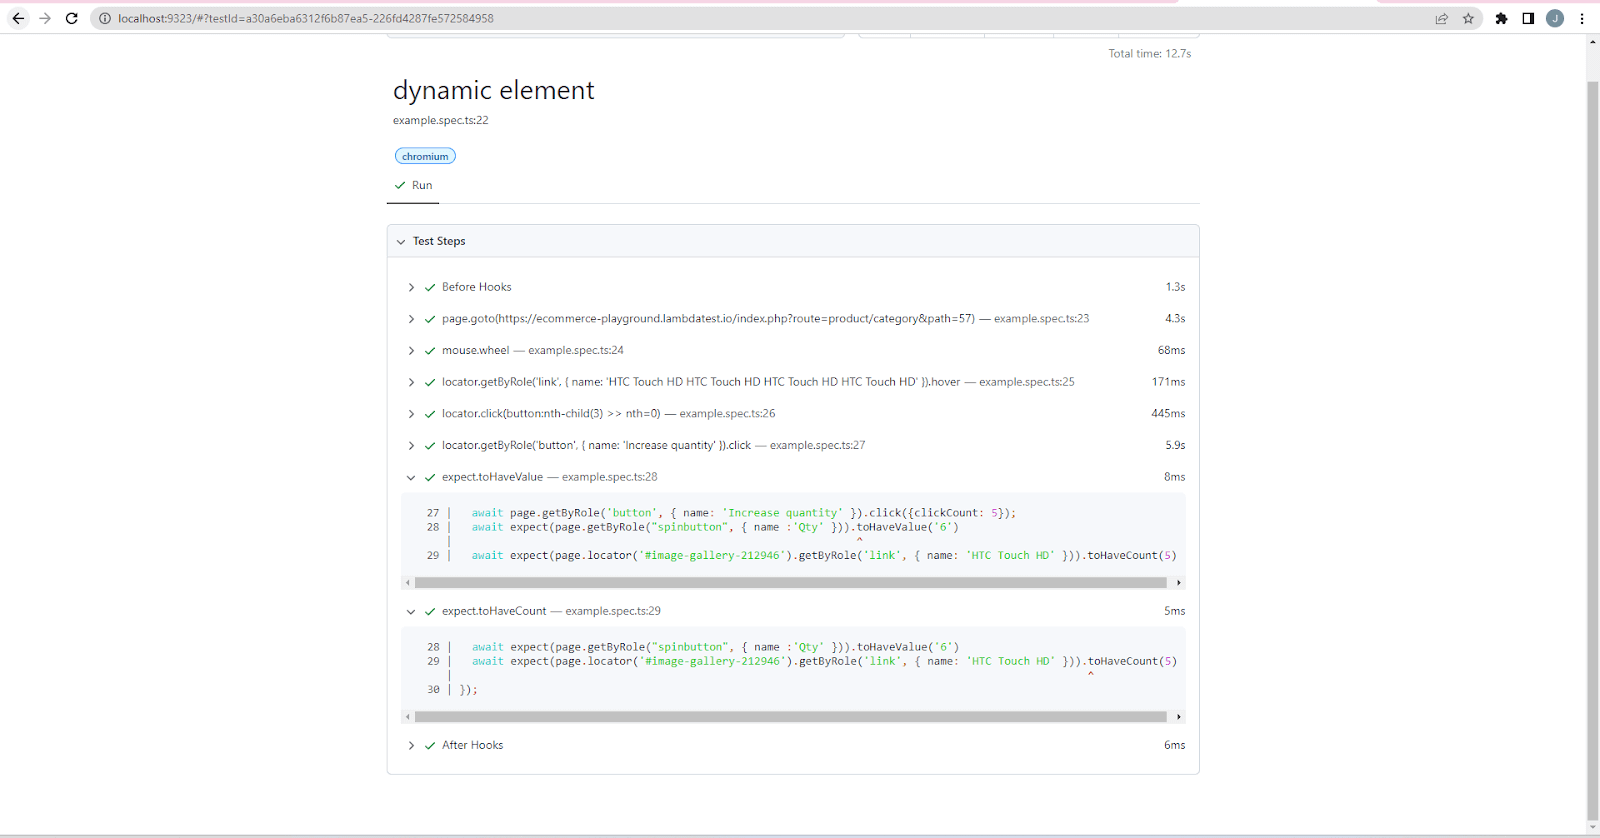
The image below shows a sample test dynamic element, which requires the mouse.wheel() to be added manually.
Locating lazy-loaded elements requires scrolling them. Since the scroll events are not recorded by the Playwright Inspector, it becomes challenging to test lazy loading elements as supporting code needs to be written manually.
Since the Playwright Inspector launches Chromium in non-headless mode, it consumes additional resources (i.e., bump-up in CPU consumption, increased RAM utilization), which can impact the performance tests being executed. This can lead to slower test execution, give an impression of a slow-running application, and increase the likelihood of false positives and negatives.
The overhead depends on several factors, such as the machine’s capacity where tests are run in terms of Operating System, RAM, and CPU cores.
The Playwright Inspector tool has limited customization options. While it does allow modifying the page’s state, it does not provide much flexibility in terms of adding custom code or changing the test script within the GUI.
Despite these limitations, Playwright Inspector remains a valuable tool for debugging Playwright scripts and can significantly reduce the time and effort required to identify and fix issues during the development and Playwright automated testing process.
How to generate tests using Playwright Inspector?
Playwright is language agnostic, and its API is available in various languages like Java, Python, .Net, JavaScript, and TypeScript. For this blog, we will be using the TypeScript API of Playwright. Before we start writing tests, let’s quickly understand the installation process for using Playwright with TypeScript.
How to install Playwright using TypeScript?
Combining Playwright with TypeScript offers a powerful and efficient approach to web automation and testing. TypeScript, a typed superset of JavaScript, enhances the development experience by providing type safety, enhanced IDE support, modern JavaScript features, and improved code readability.
When used with Playwright, a versatile browser automation tool, TypeScript unleashes its full potential, enabling developers to build robust, maintainable, and scalable automation scripts. In terms of installation, there are two ways in which Playwright can be installed.
- Using the Node.js package manager like npm.
- Using the Playwright VSCode extension.
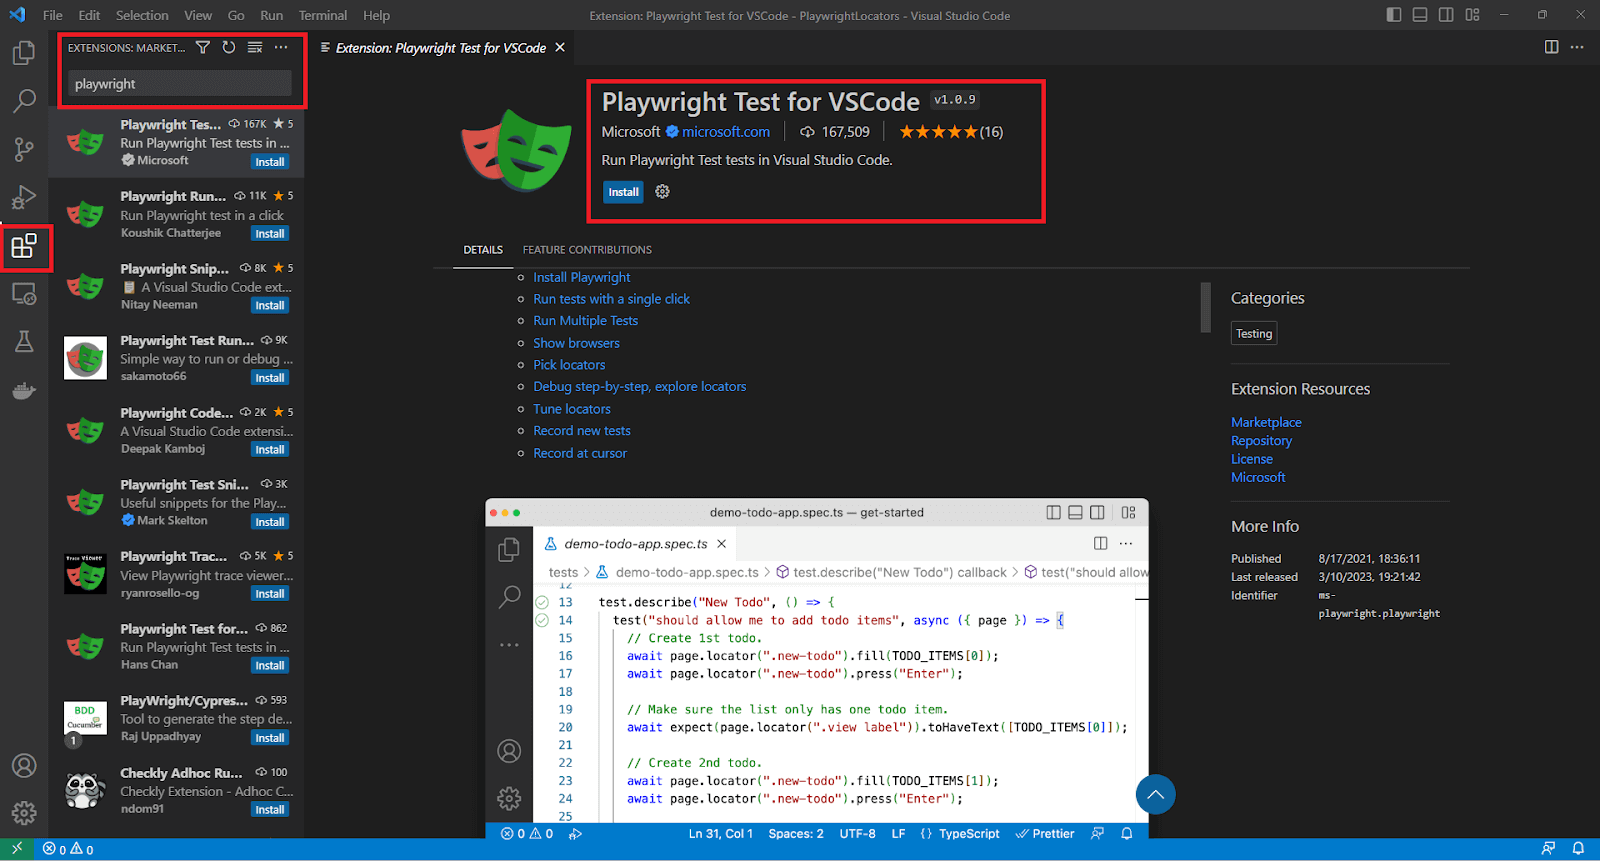
Using the Playwright VSCode extension is much easier and more user-friendly. We simply need to navigate to the extension manager and search for Playwright. Then install the official Playwright Test for VSCode, as shown in the image below.
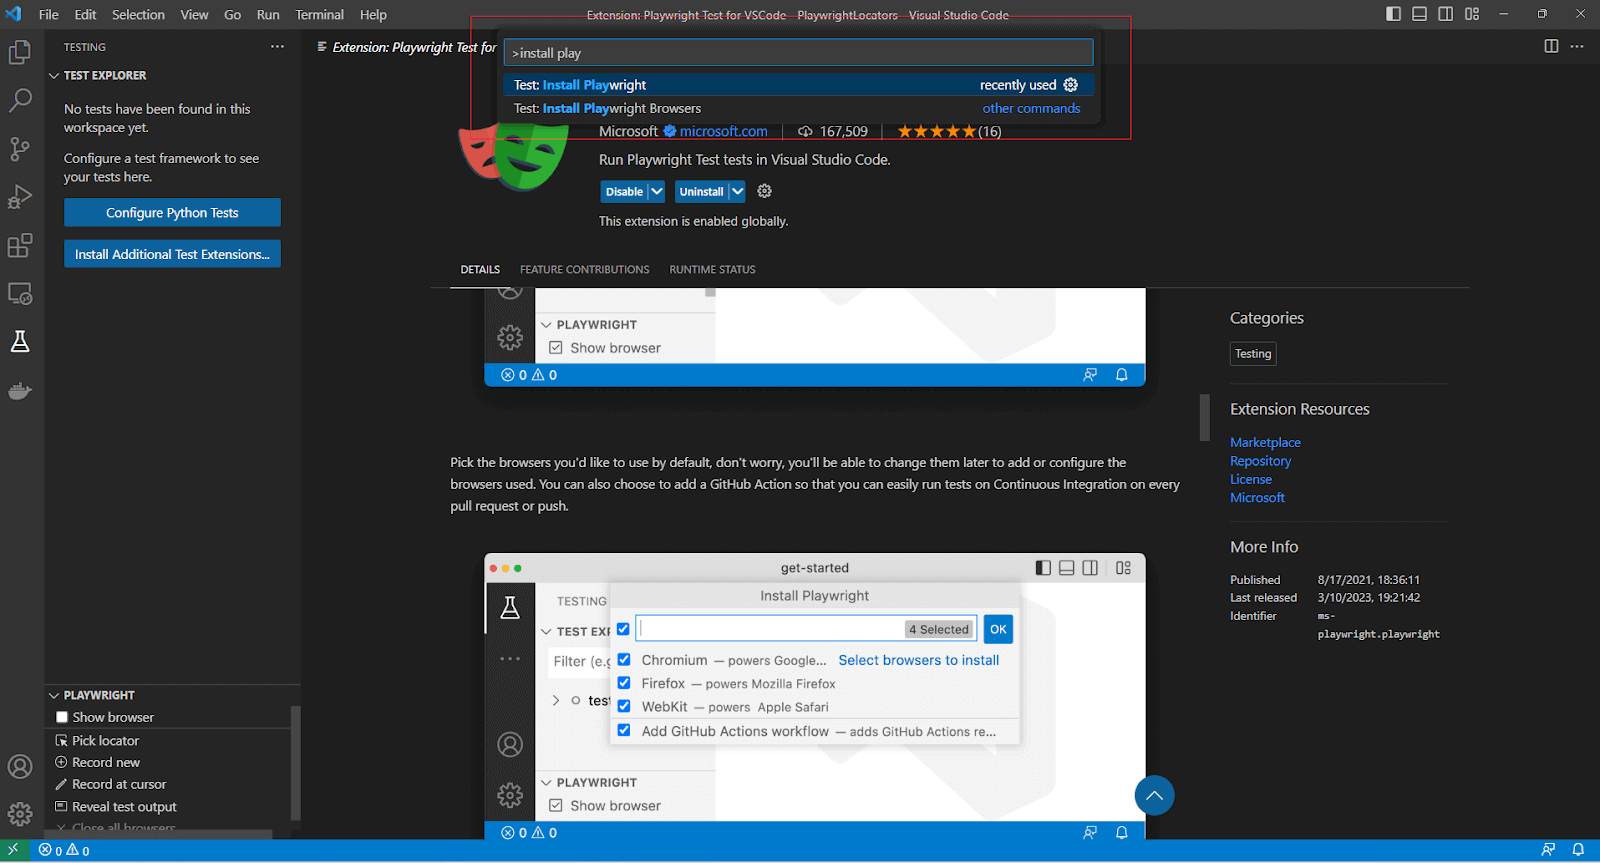
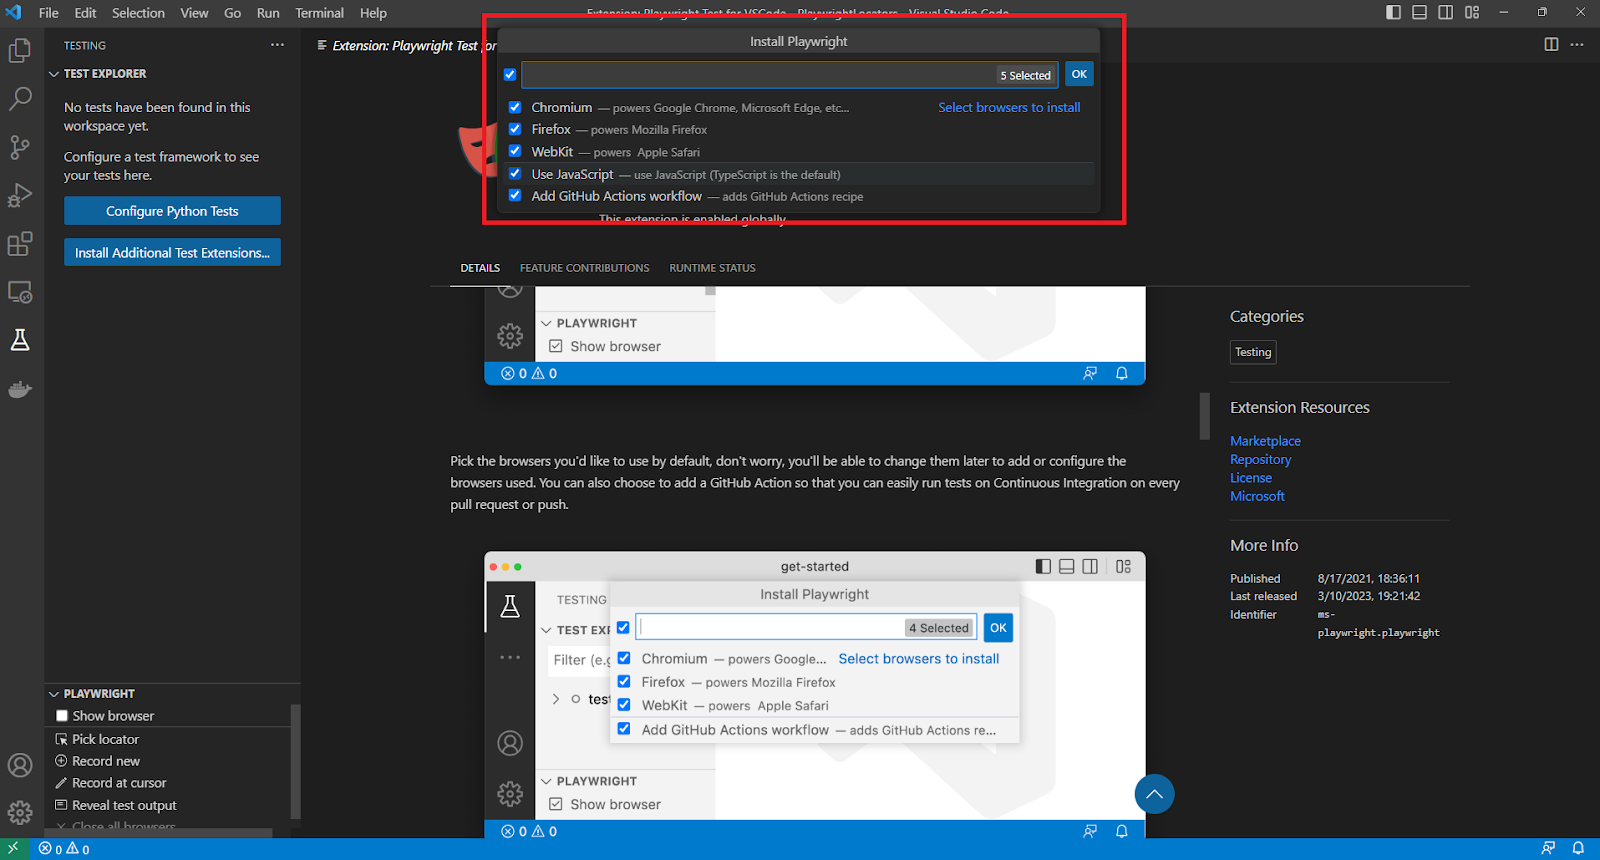
Once the official extension is installed, use the ‘Install Playwright’ action from the command panel to get started.
A successful installation will result in logs that look like the below image.
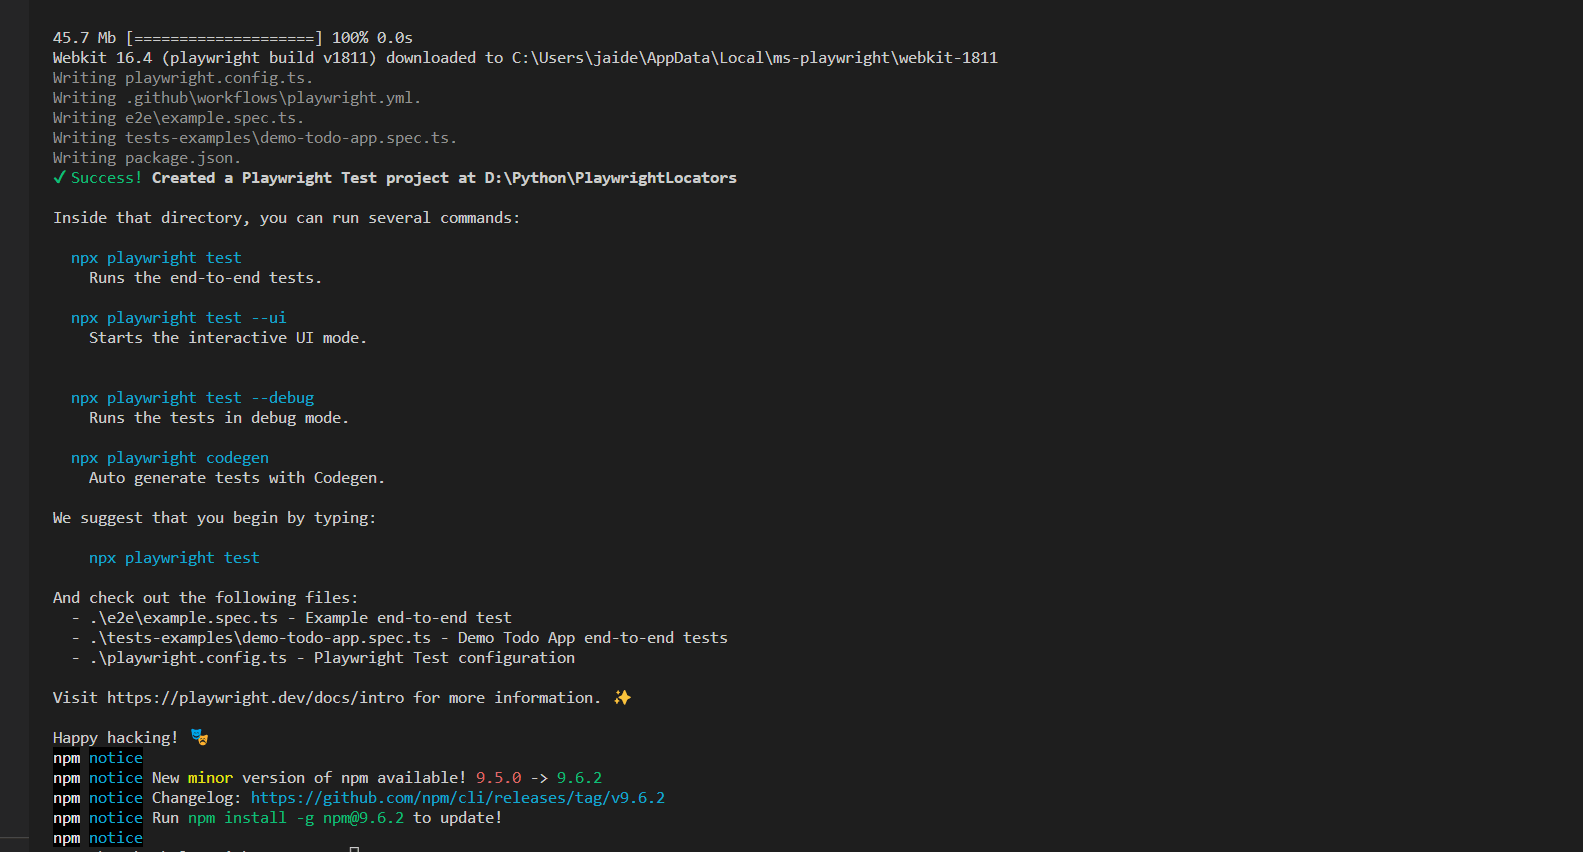
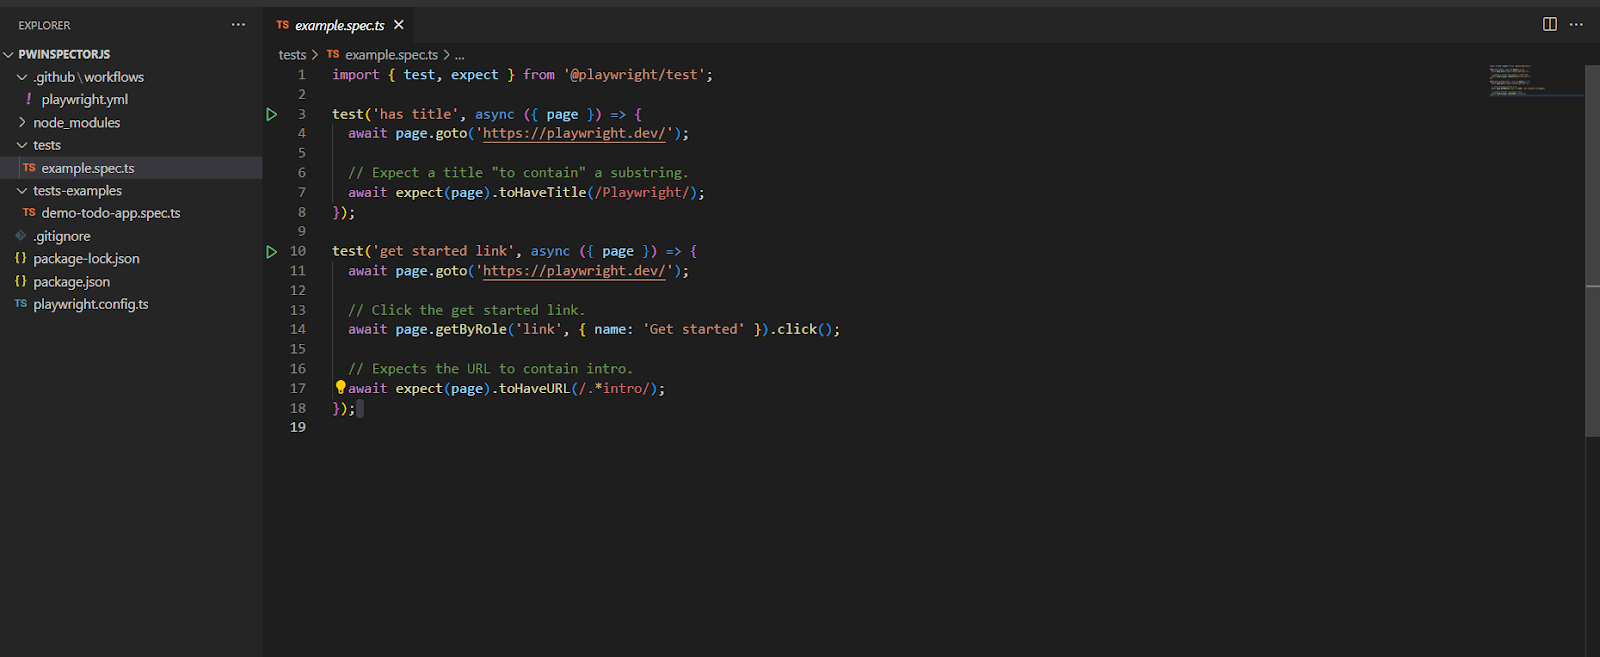
The installation will also result in a proper directory structure that resembles the image shown. The tests folder will contain a sample test, and all new tests should be added to this folder only. The package.json will contain the Playwright version, and the demo test app is also included in the test-examples folder.
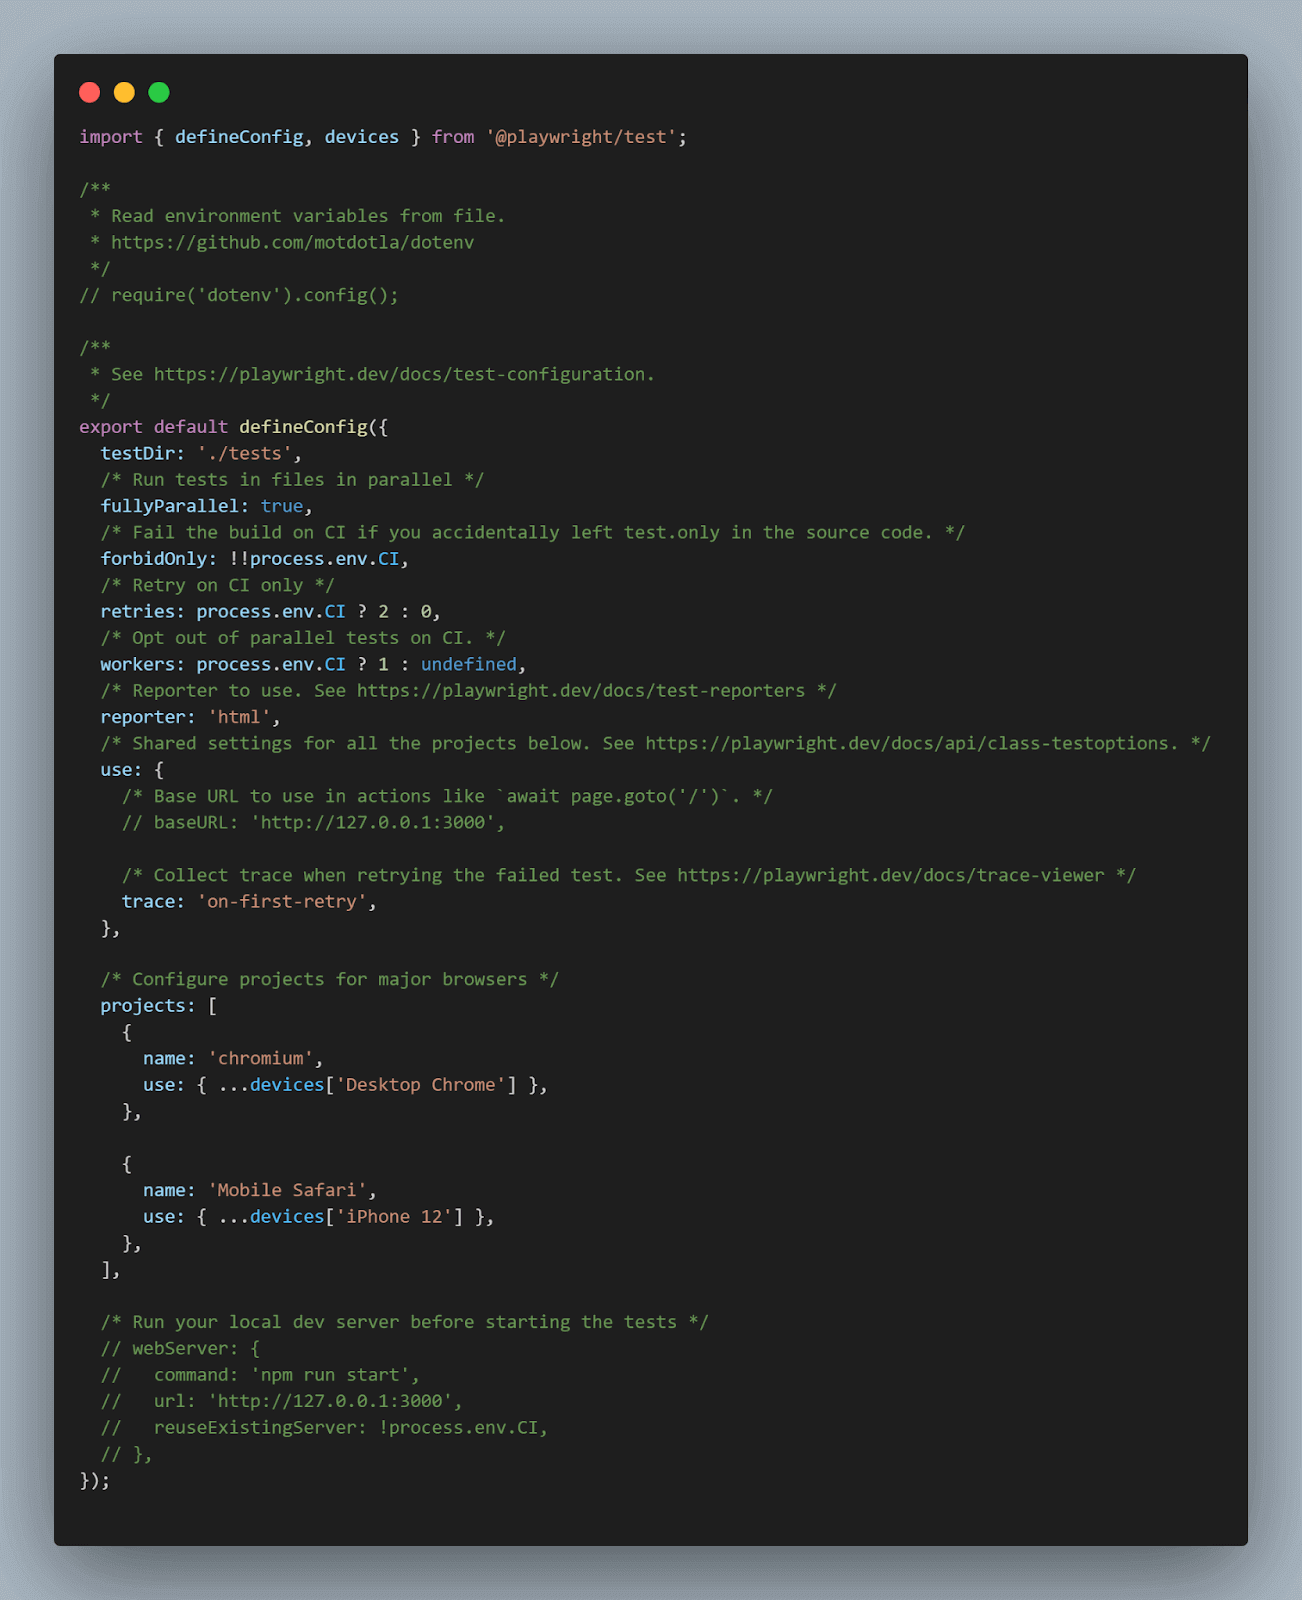
The playwright.config.ts file, generated during installation, holds crucial configuration information, including the test lookup folder, making it an essential component of the setup.
The below line implies that Playwright will look for tests to be executed under the folder tests at the project’s root.
|
1 2 |
export default defineConfig({ testDir: './tests', |
The reporter to be used to generate reports after tests are run.
|
1 |
reporter: 'html', |
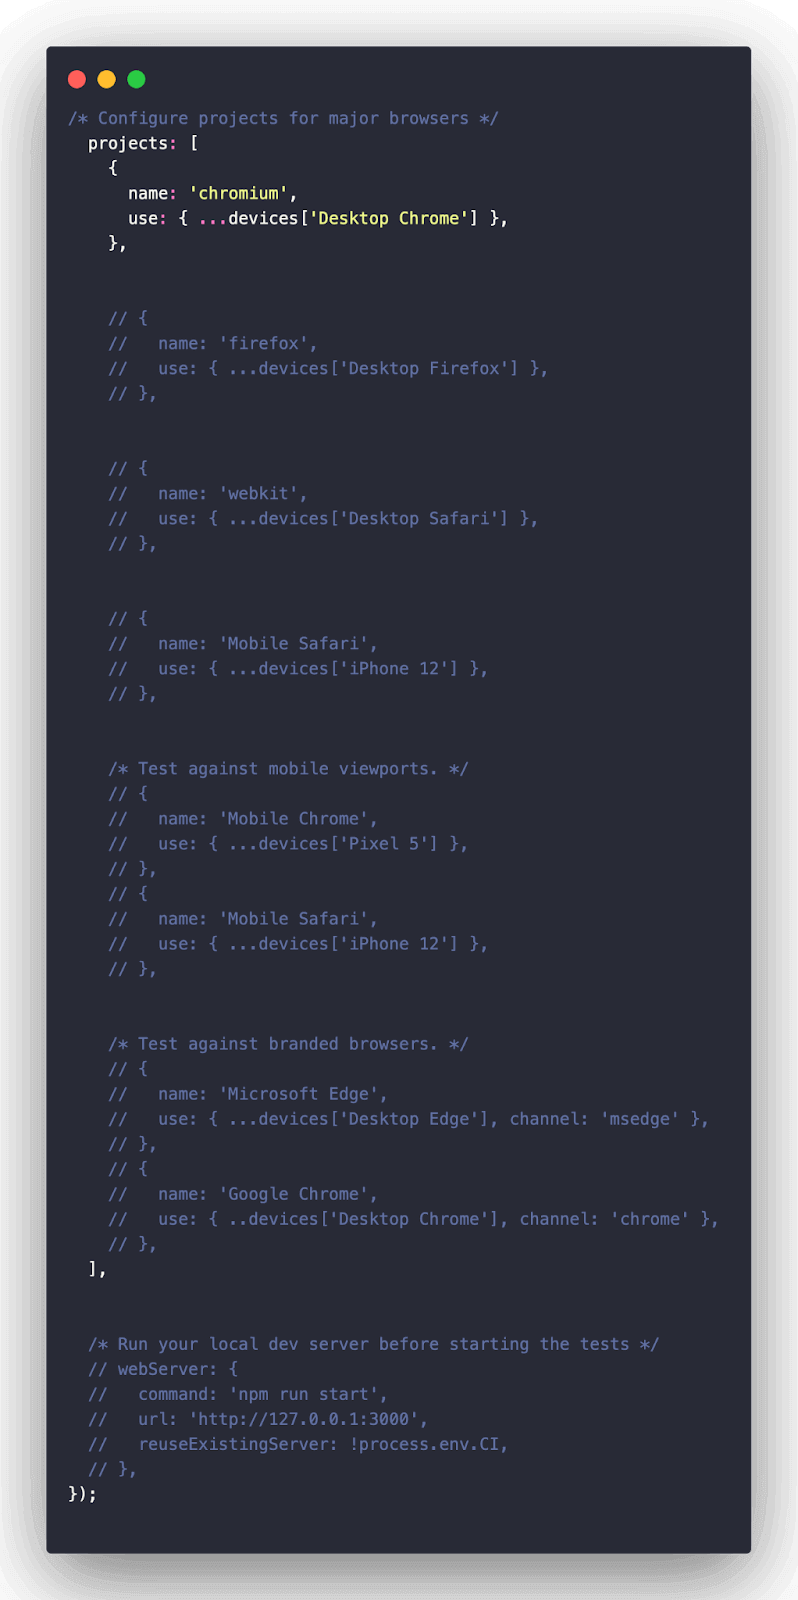
List of browsers and device viewports to run the tests on. We will be later configuring this file to debug tests on mobile viewports.

An optional github/workflow has been included because we chose to do so when installing Playwright. This step is optional and is only necessary if CI/CD integration needs to be done.
How to write a Playwright TypeScript test?
Now that the installation is completed let’s move on to writing the tests. We will use the LambdaTest eCommerce Playground website for writing the tests for this blog.
| Test Scenario 1: Assert the ‘Continue’ link exists for new customer registration and is visible |
Step 1
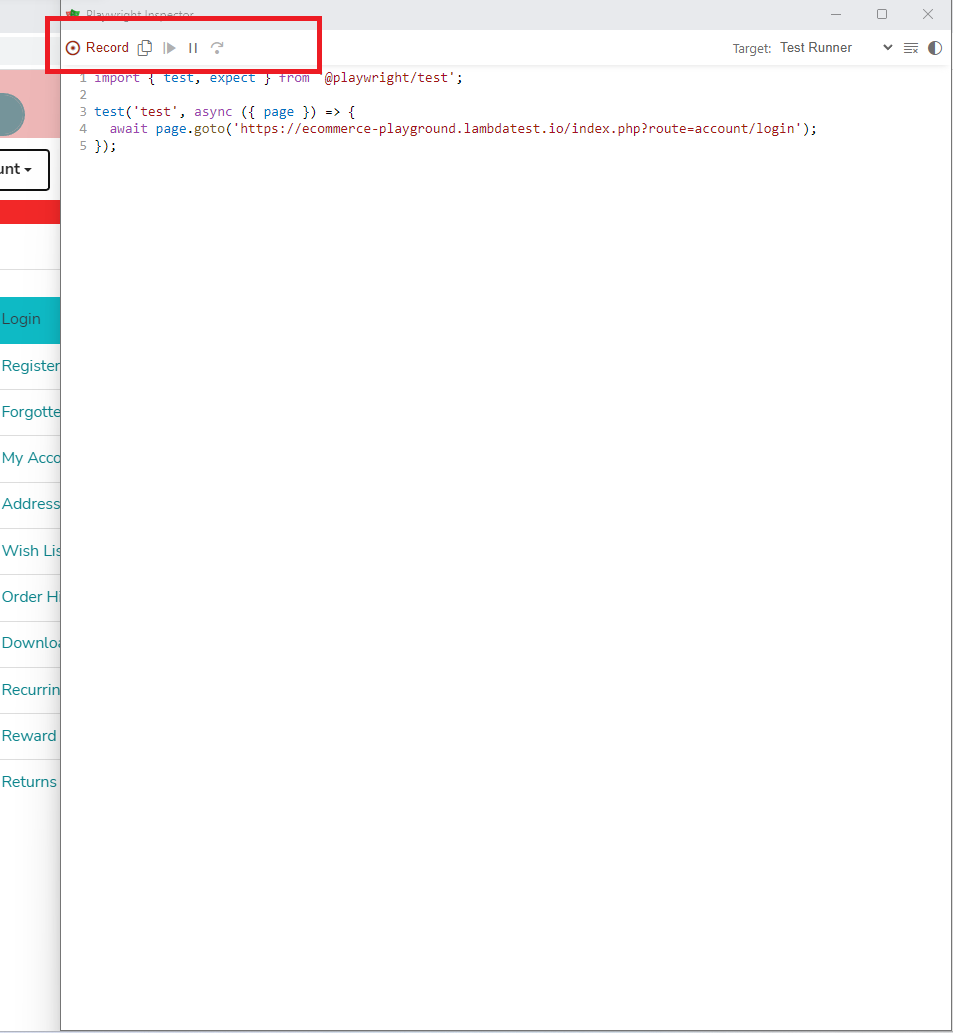
Navigate to the website under test. This will open up the Playwright Inspector and Chromium, the default browser, and record the first action, navigating to the My Account page as specified by the URL.
|
1 2 |
npx playwright codegen https://ecommerce-playground.lambdatest.io/index.php?route=account/login |
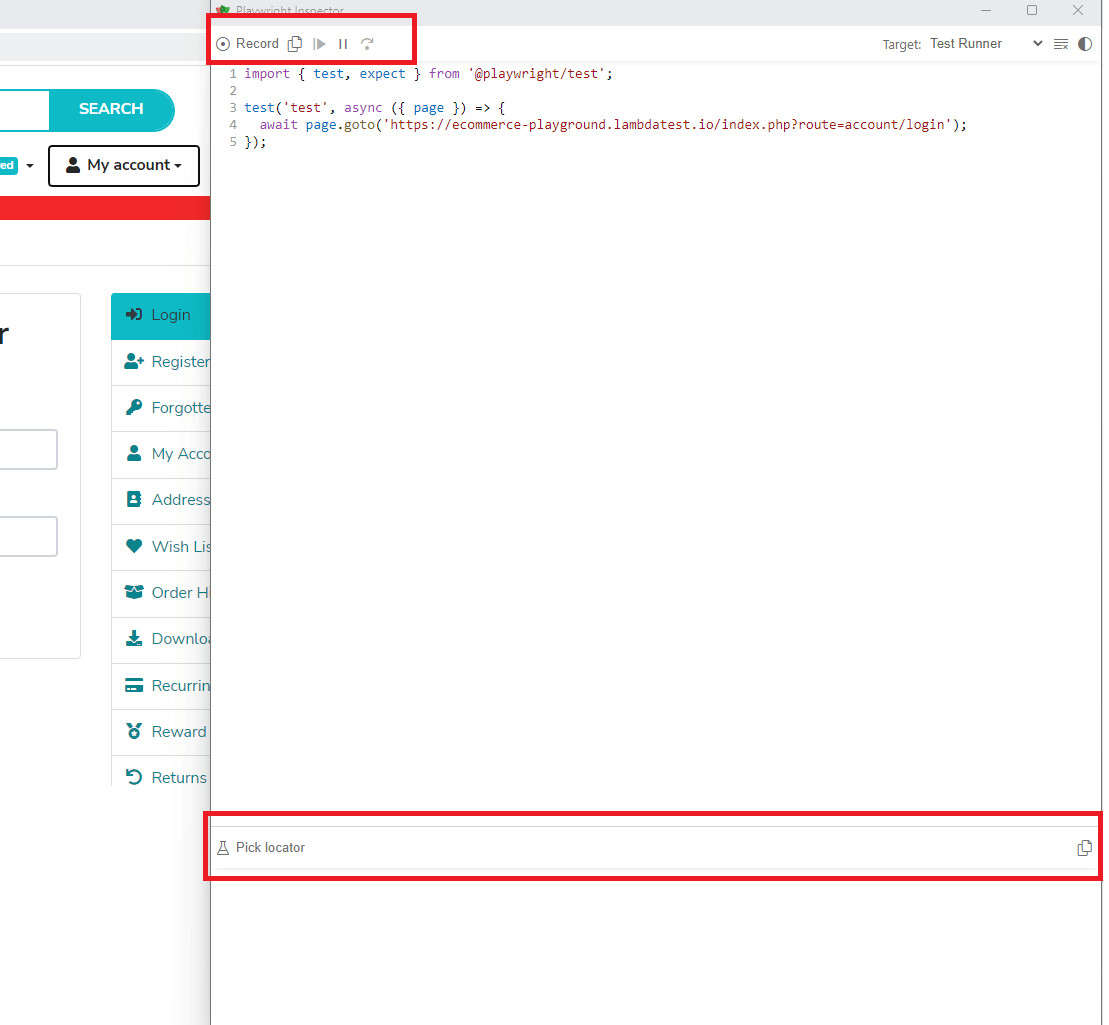
Step 2
Stop the recording by clicking the ‘Record’ button.
Step 3
The ‘Pick Locator’ will be visible immediately, and the ‘Record’ button will be grayed out, indicating recording is stopped.
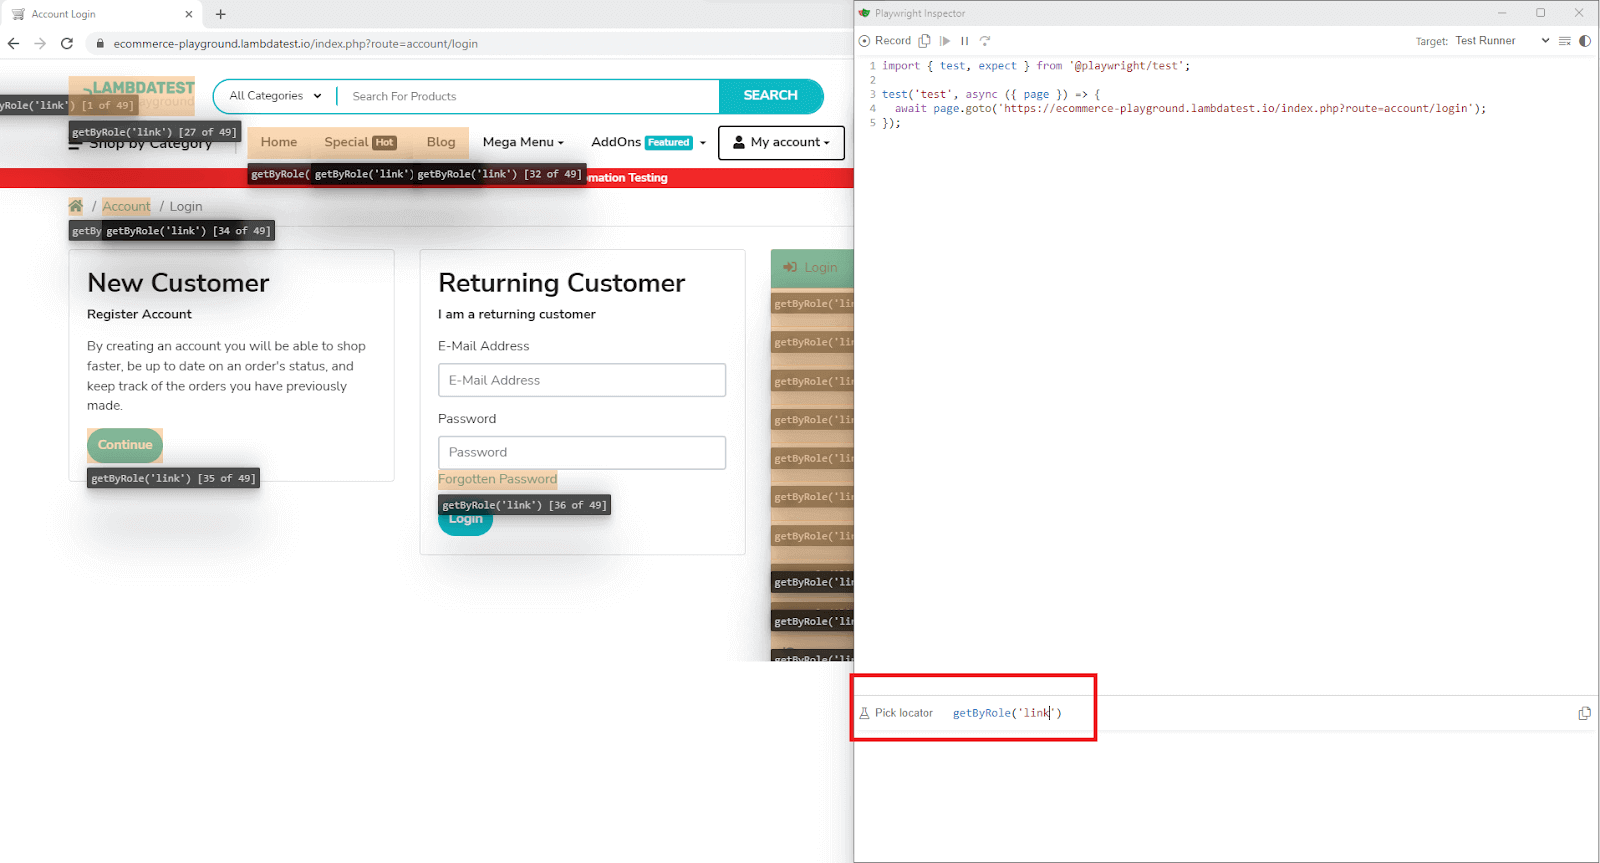
Step 4
We can either start typing in the text form to manually locate elements or click on ‘Pick Locator’ to automatically let the Playwright Inspector choose the best locator for the particular element. Locators are central to Playwright and its ability to find elements on the DOM.
Playwright provides seven built-in locators, which are recommended and can suffice most scenarios. If there remains a need to work with CSS or XPath, the page.locator() can be used to build custom locators. Playwright locators play a key part in making auto-wait and retry possible.
In the below image, we see how we can locate all the links using the getByRole() Playwright locator.
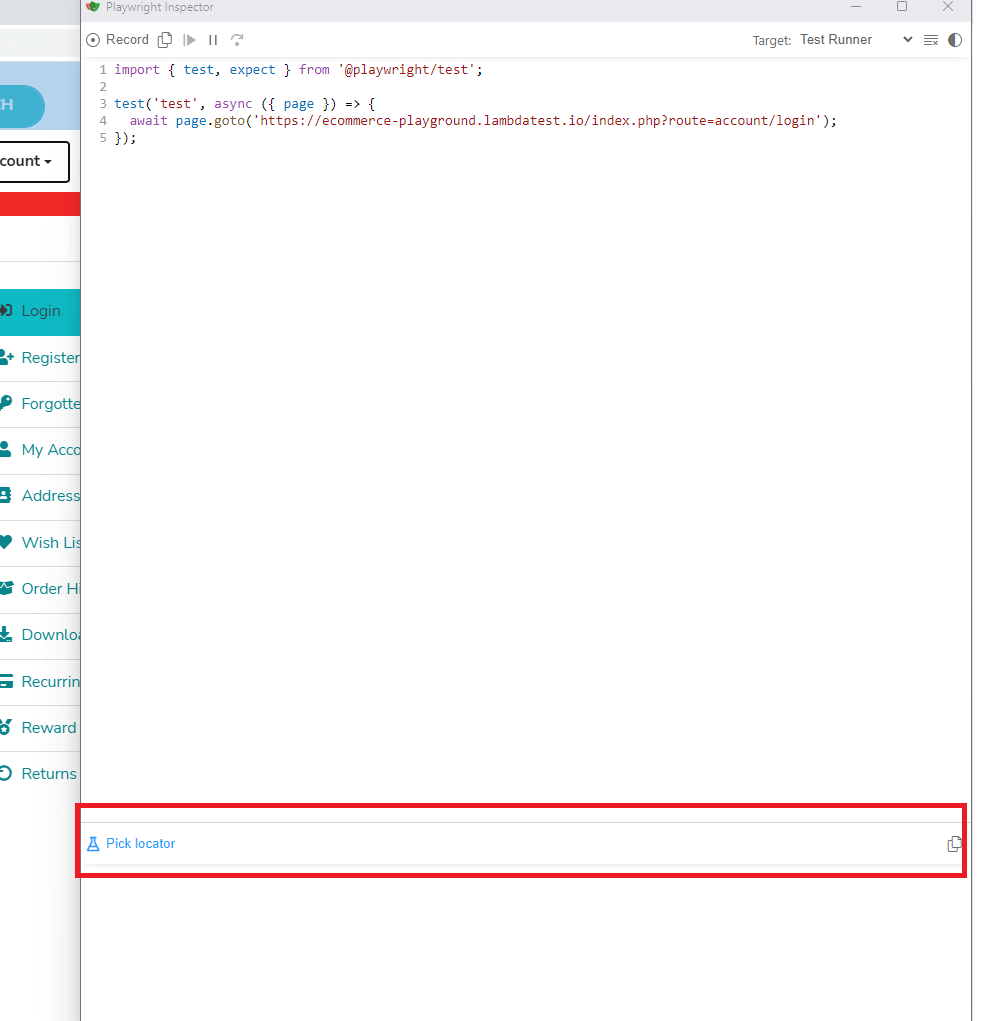
Step 5
To avoid manual selection, we can click on the ‘Pick Locator’, which will enable automatic locator selection. The ‘Pick Locator’ will also turn blue, indicating automatic locator selection is on.
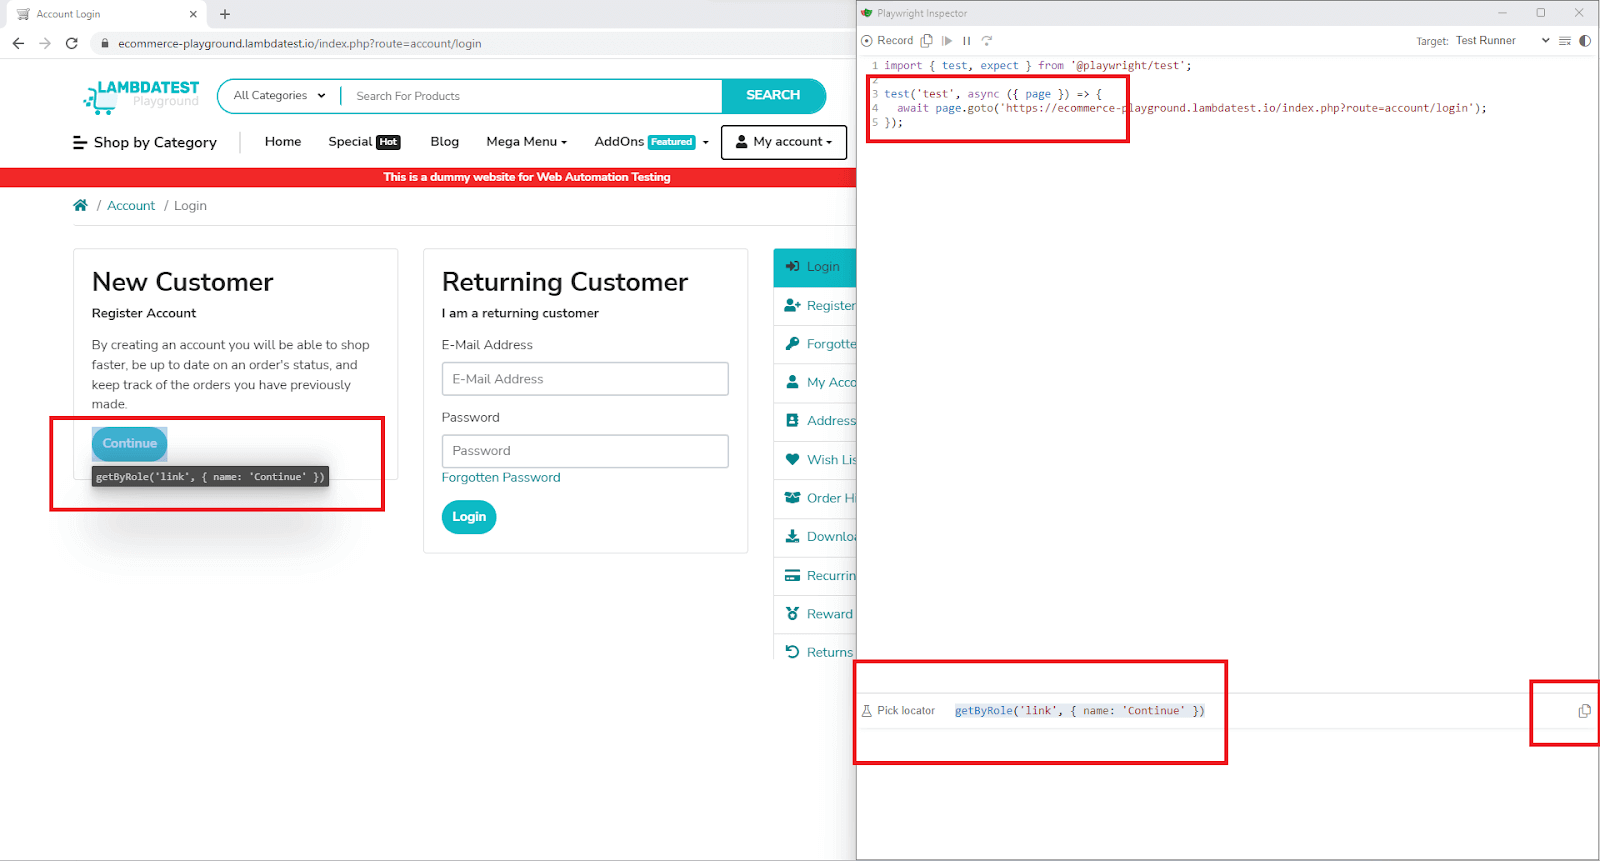
Step 6
Once the automatic locator selection is on, we need to act on the element we want to locate. We want to locate the ‘Continue’ button, so we click on it. The Playwright Inspector will automatically choose the ideal locator for the element, in this case, ‘getByRole()’, to consistently locate the element under test.
This locator is optimized for identifying elements based on their roles, aligning with how users and assistive technology perceive the page. It helps determine whether an element is a button, checkbox, or other relevant components.
Role locators encompass a wide range of elements, such as buttons, checkboxes, links, lists, tables, and more. These locators adhere to the W3C specifications for ARIA roles, ARIA attributes, and accessible names, ensuring compatibility with accessibility standards.
This generated Playwright locator can be copied using the ‘Copy’ button and added to the test.
Playwright Inspector assigns a default name to the generated test. To align with the specific scenario being tested, it is necessary to rename it appropriately and assign a more fitting name. Lastly, on the located element, we use the expect() Playwright assertion and the toBeVisible() method to ensure the element is visible on the page under test.
|
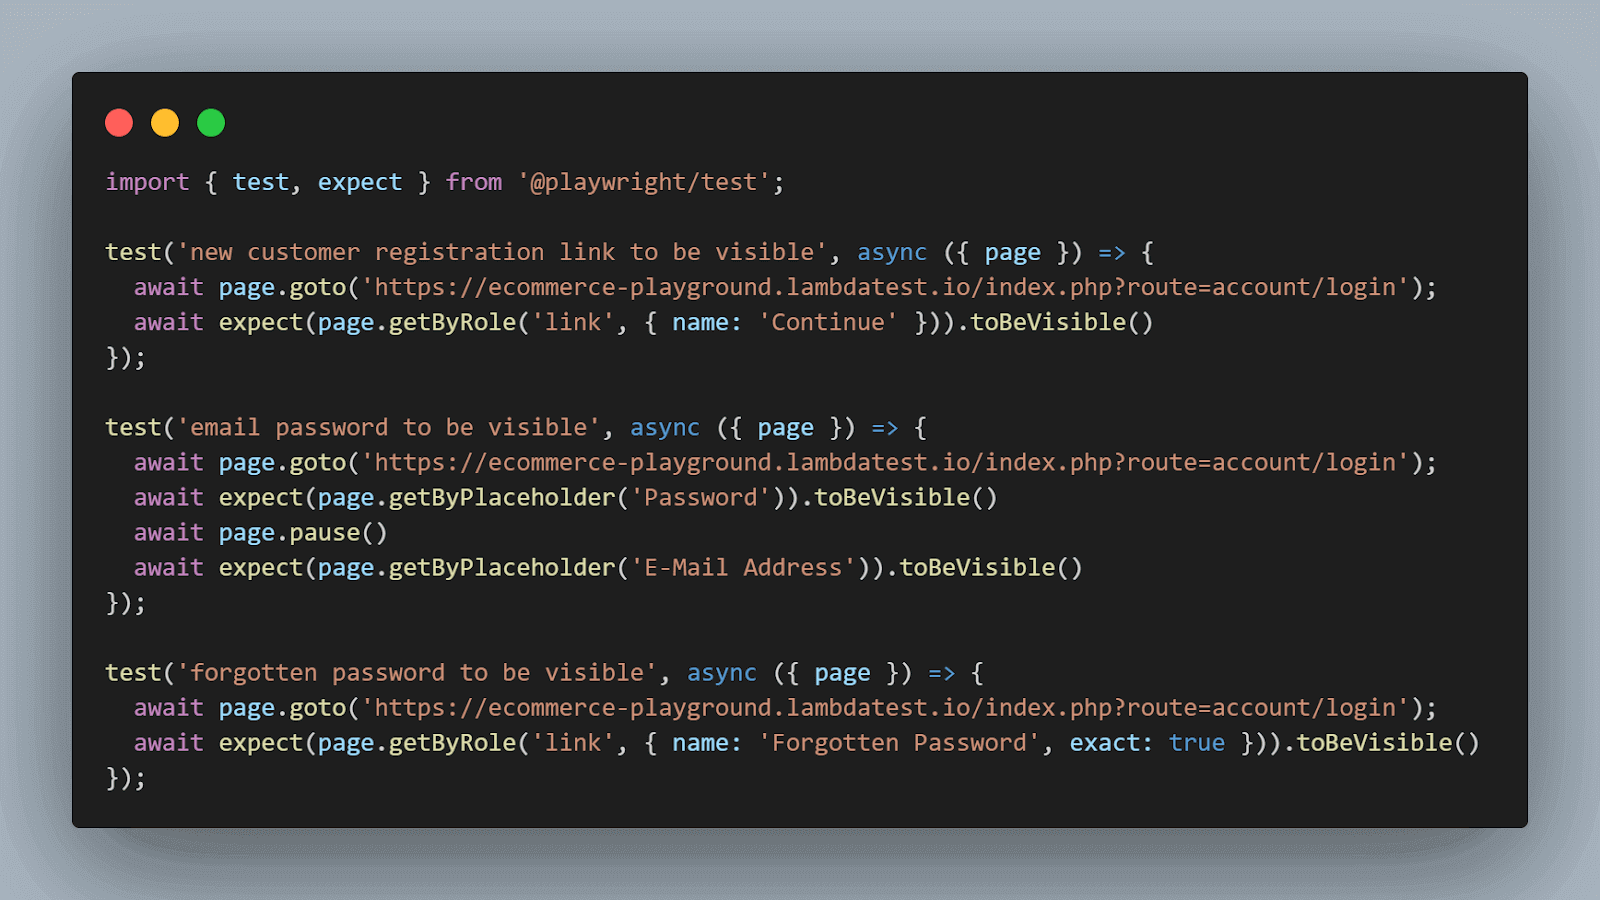
1 2 3 4 5 6 7 |
import { test, expect } from '@playwright/test'; test('new customer registration link to be visible', async ({ page }) => { await page.goto('https://ecommerce-playground.lambdatest.io/index.php?route=account/login'); await expect(page.getByRole('link', { name: 'Continue' })).toBeVisible() }); |
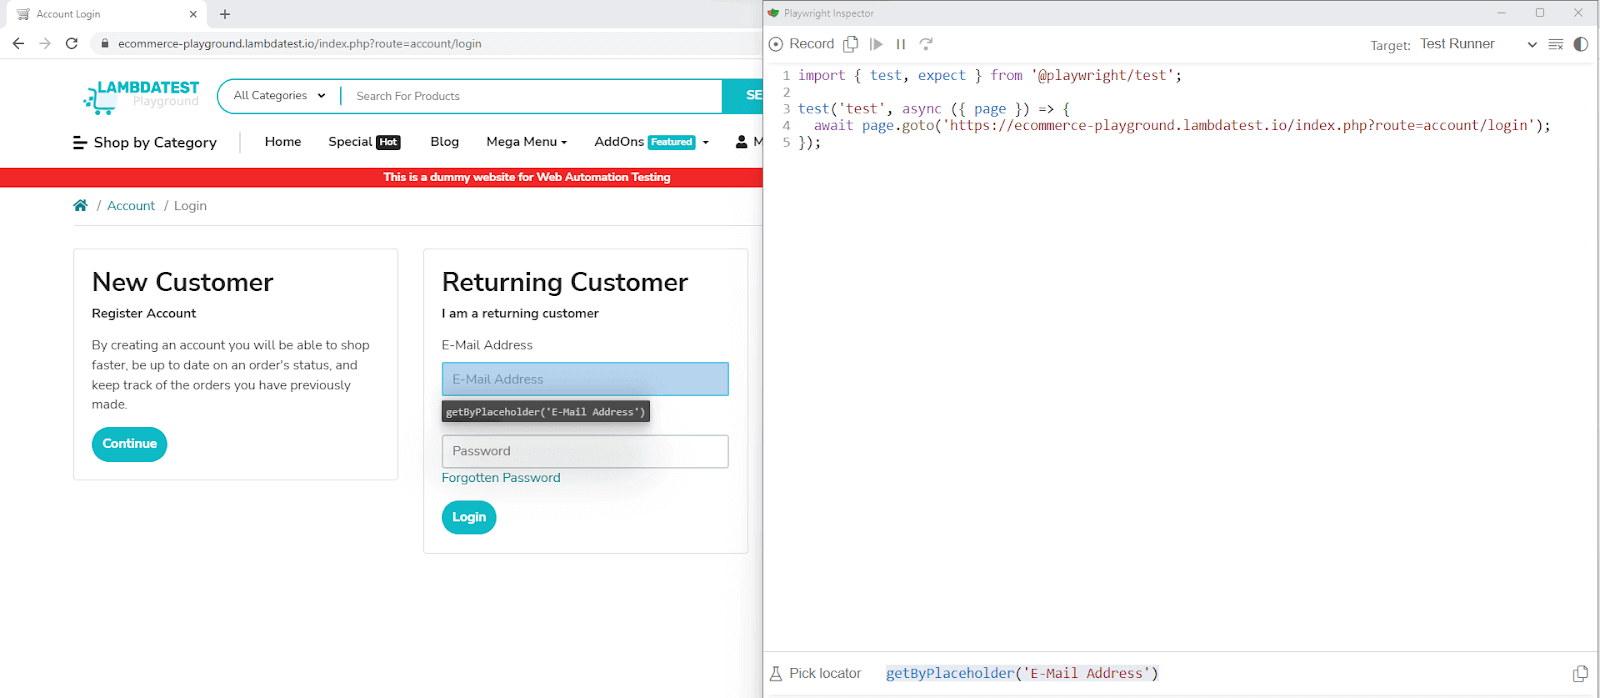
| Test Scenario 2: Assert ‘E-mail’ and ‘Password’ fields exist on the customer login form and are visible |
In the upcoming scenario, our focus will be on generating tests to ensure that the customer login form includes a designated input field for entering both email and password.
The steps for initiating the Playwright Inspector tool, pausing the recording, and enabling automatic locator selection remain consistent with the previous test.
On clicking the ‘E-Mail Address’ field, the getByPlaceholder(‘E-mail Address’) locator is prompted by the Playwright Inspector tool.
Similarly, on clicking the ‘Password’ field, the getByPlaceholder(‘Password’) locator is prompted by the Playwright Inspector tool.
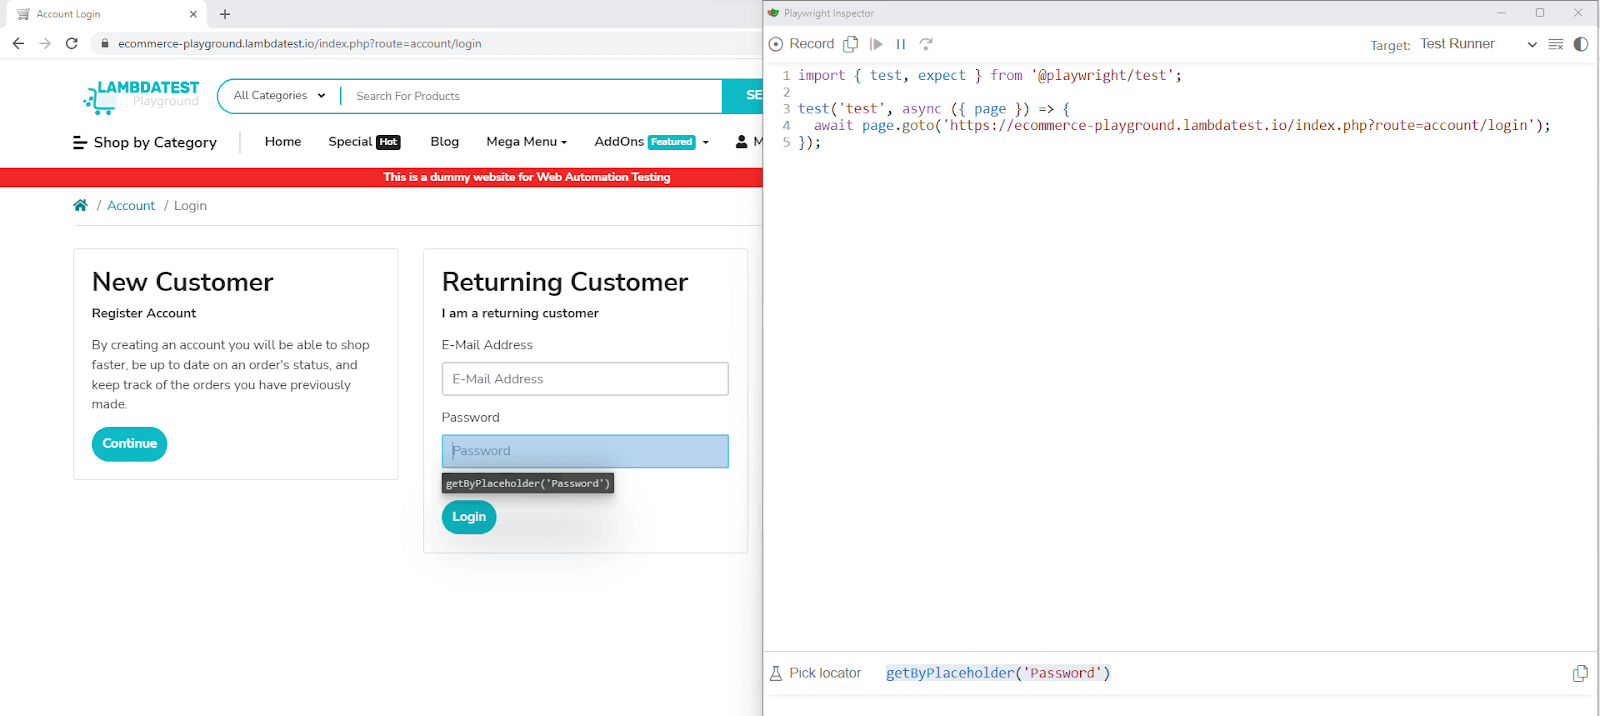
The getByPlaceholder() Playwright locator leverages the presence of the placeholder attribute in form input fields, providing a useful hint to users regarding the expected input value. This locator is particularly advantageous in scenarios involving form fields, especially when labels are absent, but placeholder texts are available.
On the locators, we use the Playwright expect() and toBeVisible() assertion to ensure that the locator points to an element visible on the DOM.
|
1 2 3 4 5 |
test('email password to be visible', async ({ page }) => { await page.goto('https://ecommerce-playground.lambdatest.io/index.php?route=account/login'); await expect(page.getByPlaceholder('Password')).toBeVisible() await expect(page.getByPlaceholder('E-Mail Address')).toBeVisible() }); |
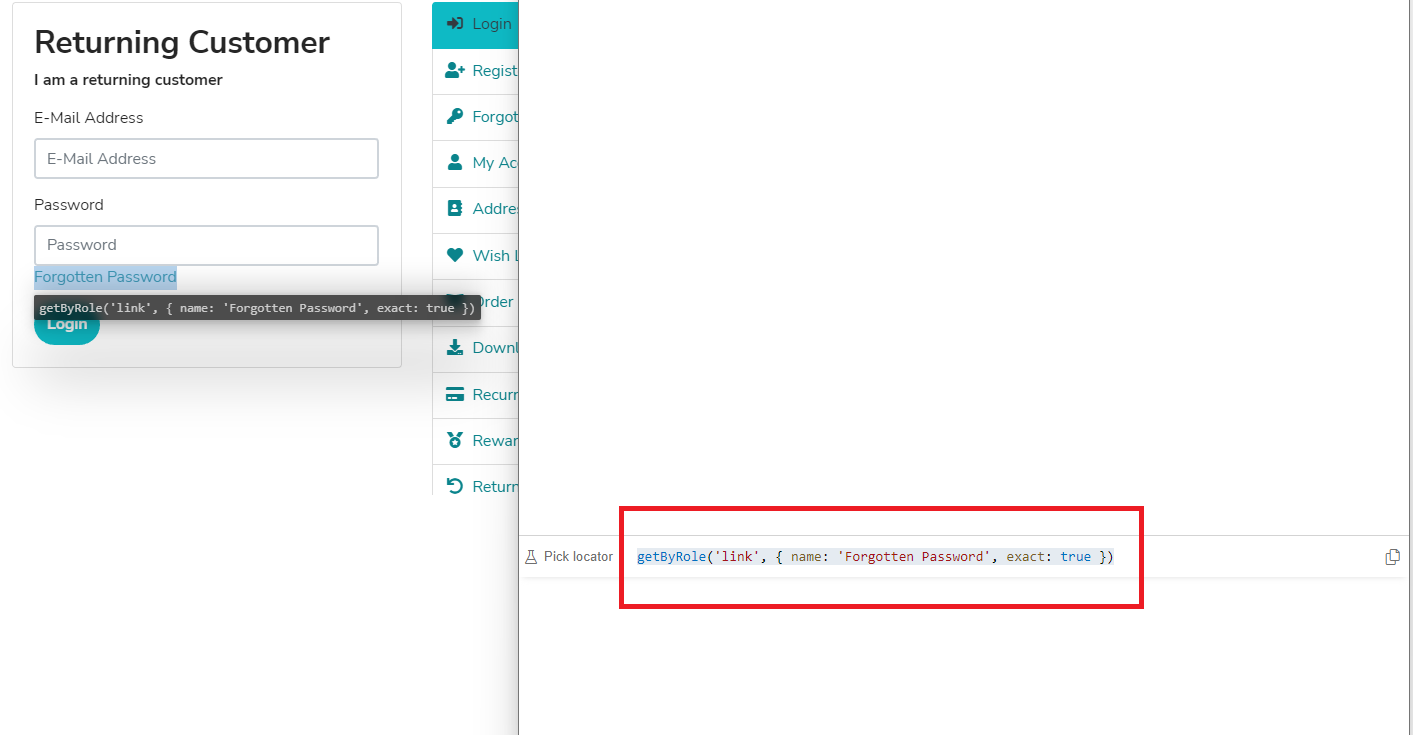
| Test Scenario 3: Assert ‘Forgotten Password’ link exists on Returning Customer form and is visible |
The next scenario we will generate tests for is to make sure the customer login form has the ‘Forgotten Password’ link in case a returning customer
The steps to start the Playwright Inspector tool, pause the recording and enable automatic locator selection remain unchanged.
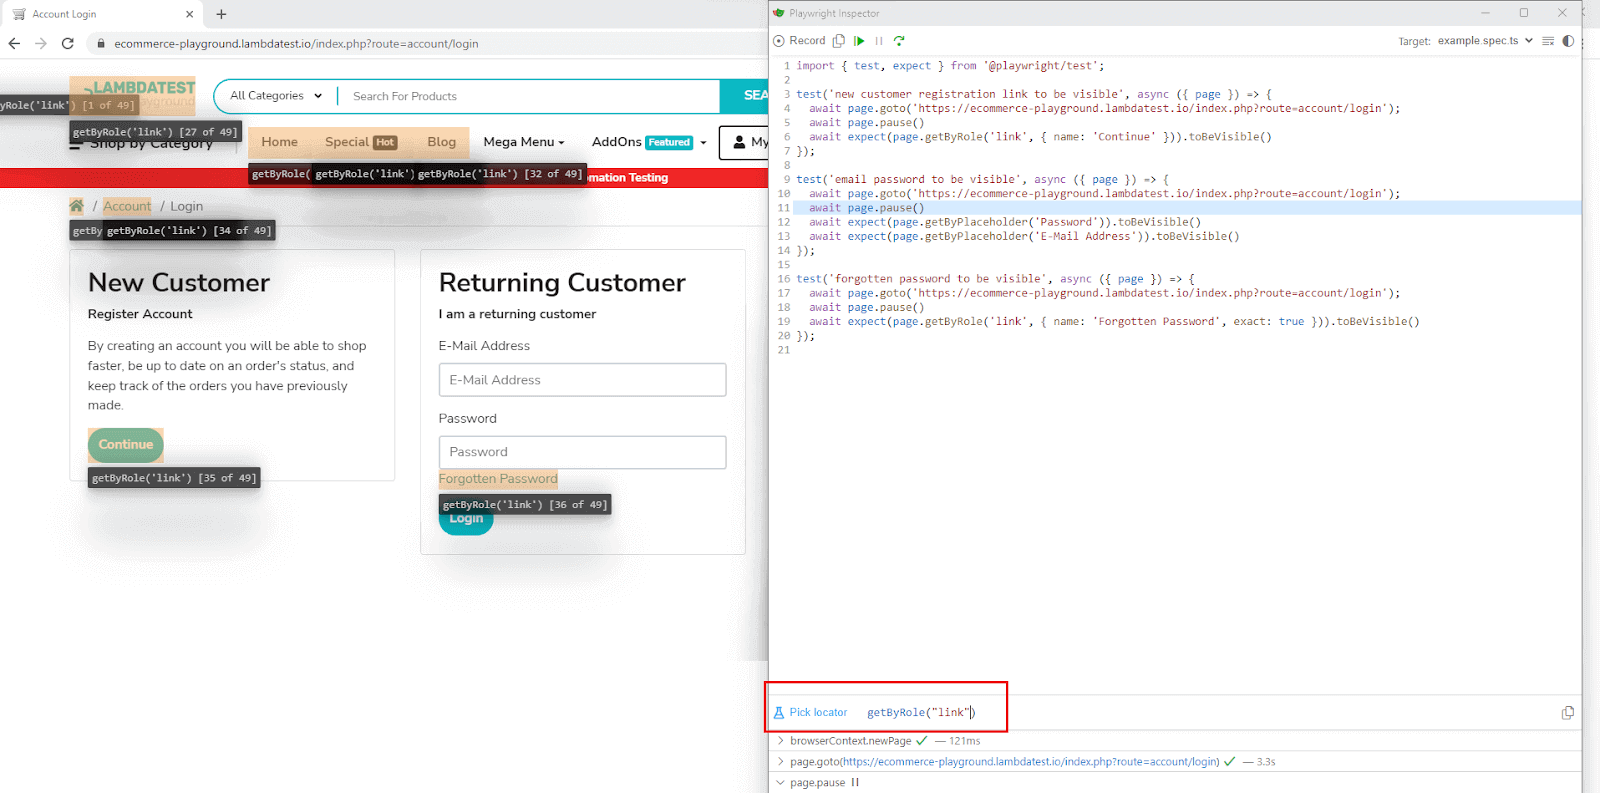
On pausing the record and clicking the ‘Forgotten Password’ link, we can notice the prompted locator is again getByRole(‘link’, {name: ‘Forgotten Password’, exact: True’}).
The exact: True filter is applied by Playwright Inspector to the getByRole() locator as the ‘Forgotten Password’ link is present twice on the page. The image below shows that if we remove exact: True, the locator matches two elements with the HTML link role and name matching the text ‘Forgotten Password’. The second ‘Forgotten Password’ has a space after the ‘Password’ filter helps eliminate it from the selection.
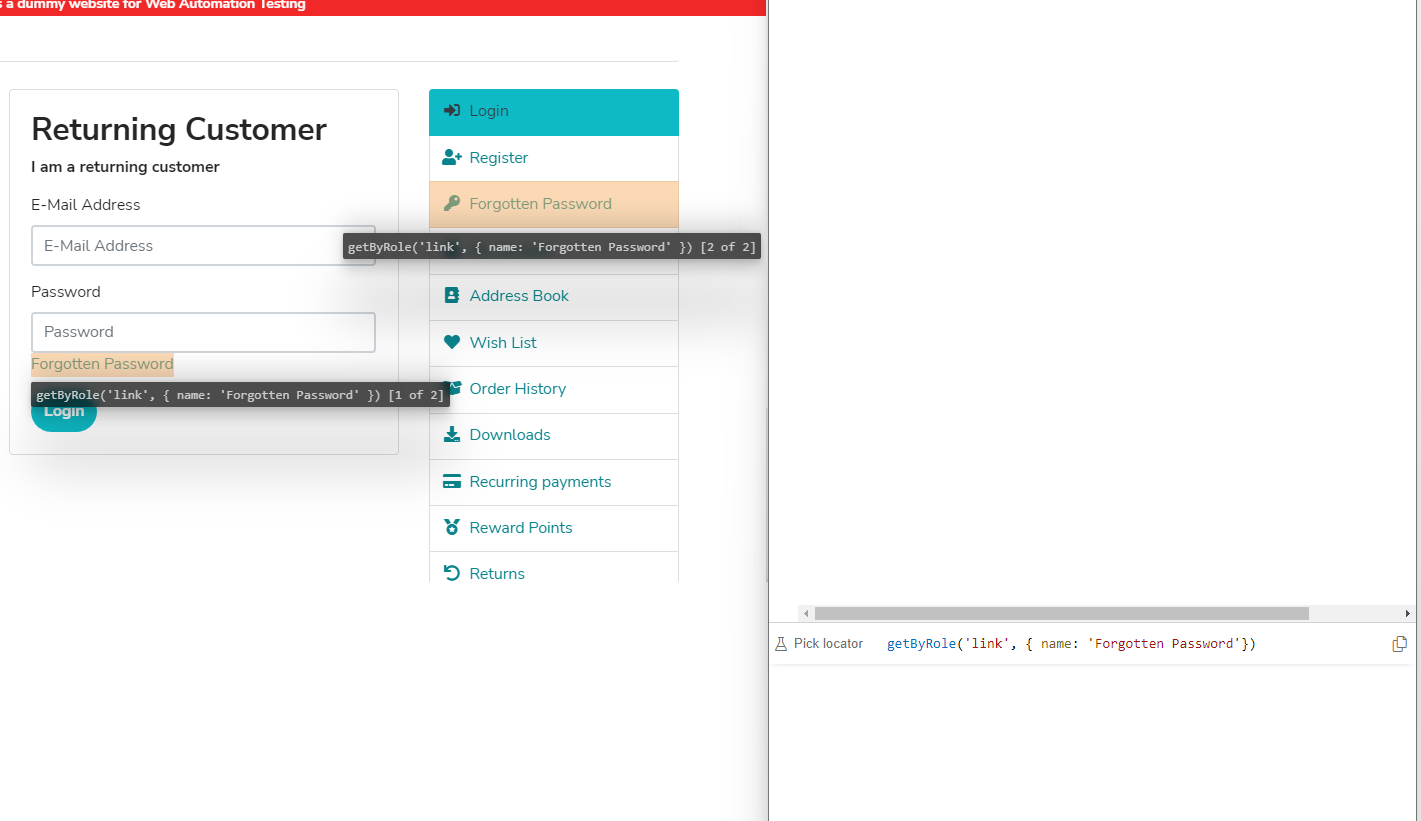
To prevent such behavior and ensure precise element matching, the Playwright Inspector intelligently includes an additional parameter in the generated locator. This ensures that only the intended element is matched, eliminating ambiguity or unintended matches.
We then copy the generated test code and locator and give it a proper name. We then use the expect() and toBeVisible() Playwright assertion to ensure the element under test is visible on the DOM.
|
1 2 3 4 |
test('forgotten password to be visible', async ({ page }) => { await page.goto('https://ecommerce-playground.lambdatest.io/index.php?route=account/login'); await expect(page.getByRole('link', { name: 'Forgotten Password', exact: true })).toBeVisible() }); |
Let’s now execute these three tests before we move on to writing the fourth and final test of this blog.
Execution
Running tests is possible using the VSCode extension or nodejs CLI (command line). The simplest command is the npx playwright D:\Python\pwinspectorjs\test. This command searches in the TestDir (default: ./tests) for all files with the extensions .spec.ts(js). Tests are run against all browsers.
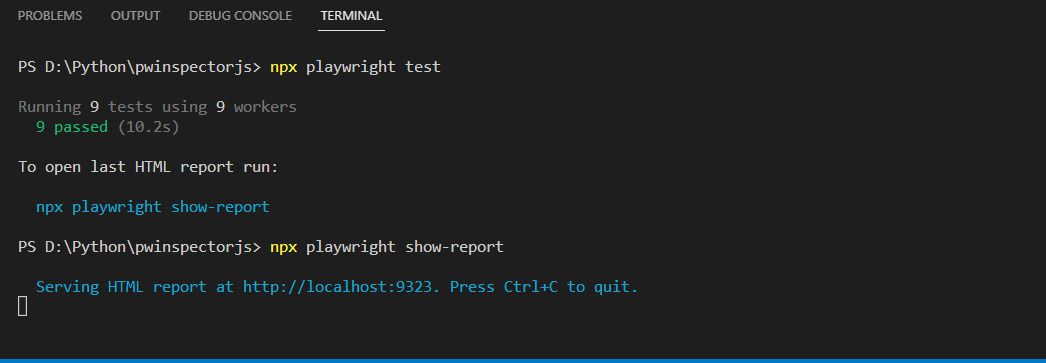
We can also generate a detailed text execution HTML report using the npx playwright show-report command. The output of which looks like below.
| Test Scenario 4: Assert Add Quantity & Product Image Gallery |
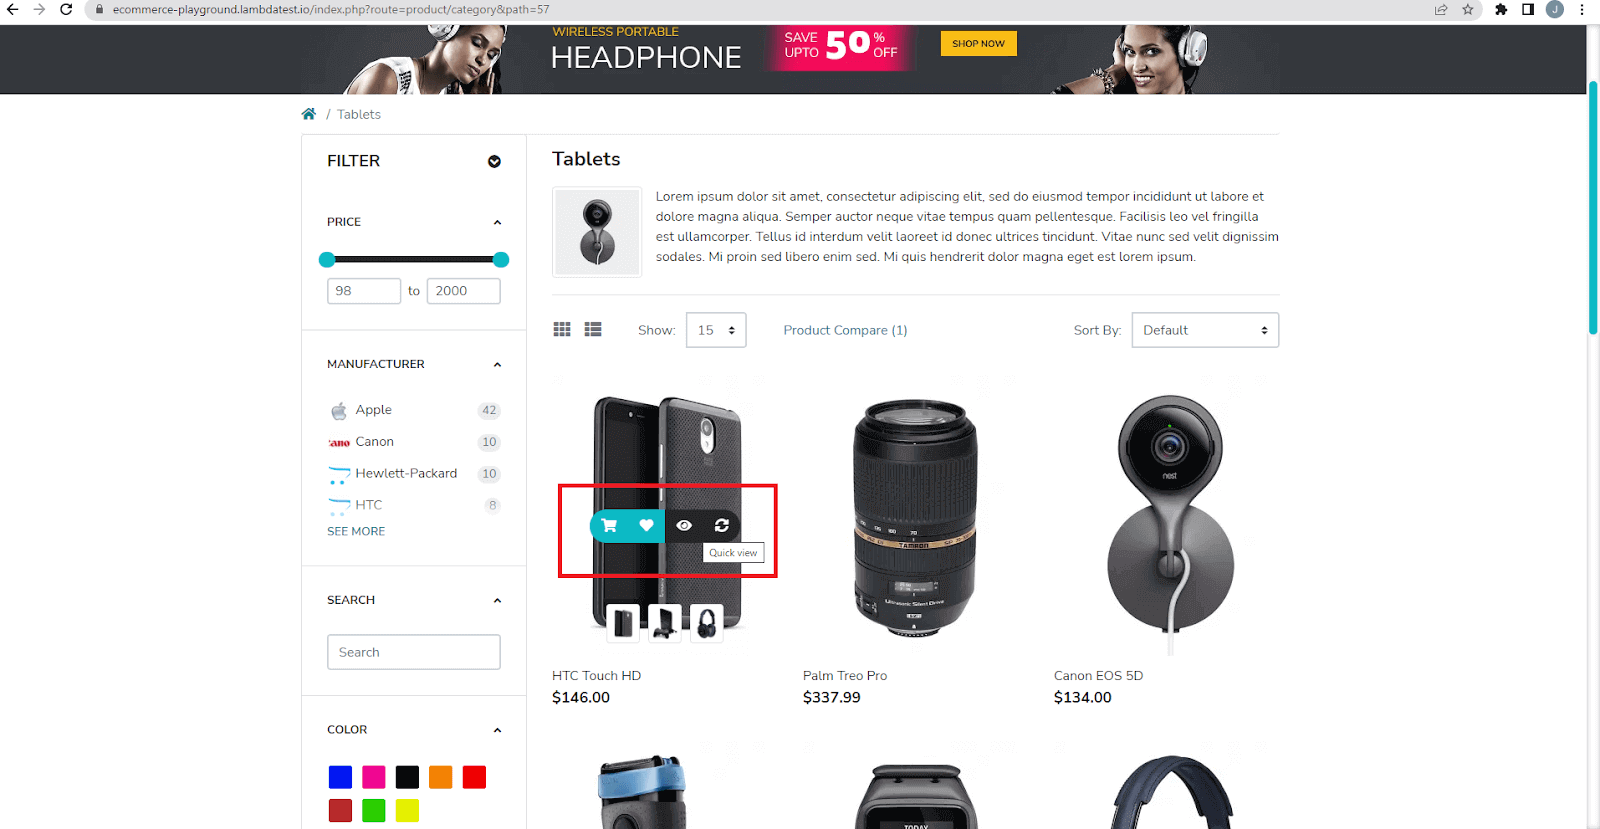
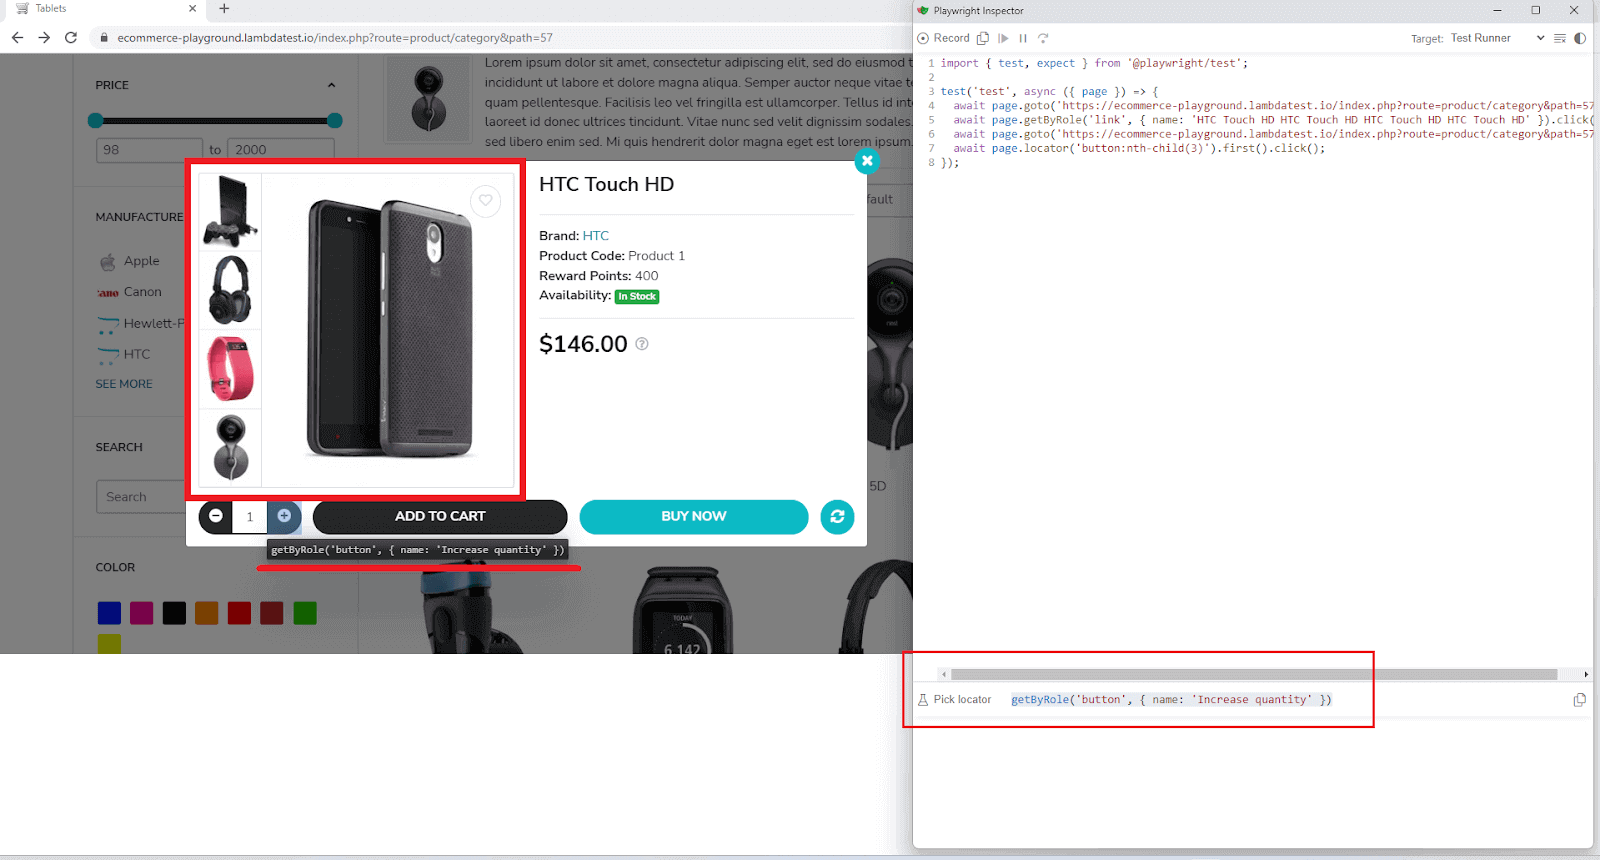
Hovering over any product shows a pop-up menu that contains options like ‘add to car’, ‘add to wish list’, ‘quick view’, and ‘compare product’. On clicking the ‘quick view’ button, a subsequent modal opens up that has the product info along with an input field to increase quantity, add to cart, and buy now buttons.
modal opens up that has the product info along with an input field to increase quantity, add to cart, and buy now buttons.
Here is the overall scenario:
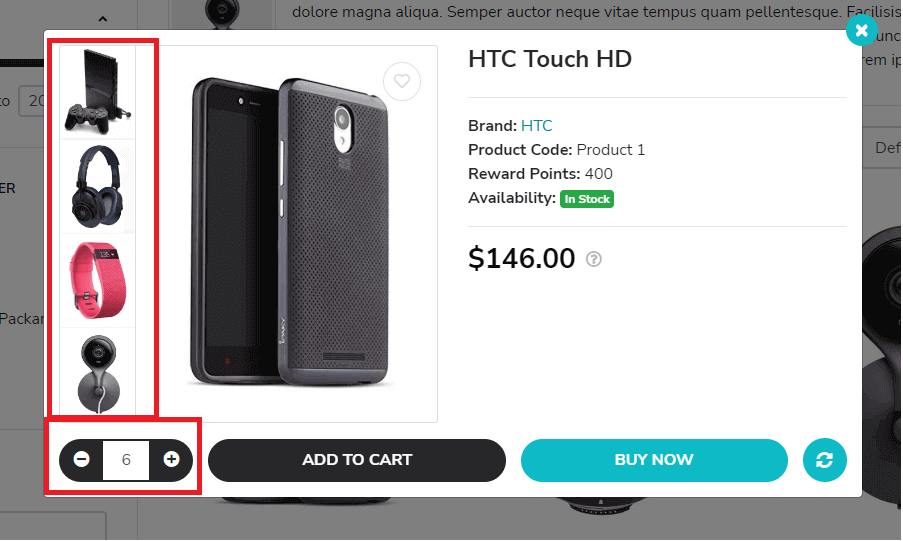
- Click the ‘+’ icon 5 times and verify if the quantity is updated to 6.
- Product image gallery to have a total of 5 images.
The URL of the product page is
https://ecommerce-playground.lambdatest.io/index.php?route=product/category&path=57
Open the Playwright Inspector tool and pass the URL as shown below:
|
1 2 |
npx playwright codegen https://ecommerce-playground.lambdatest.io/index.php?route=product/category&path=57 |
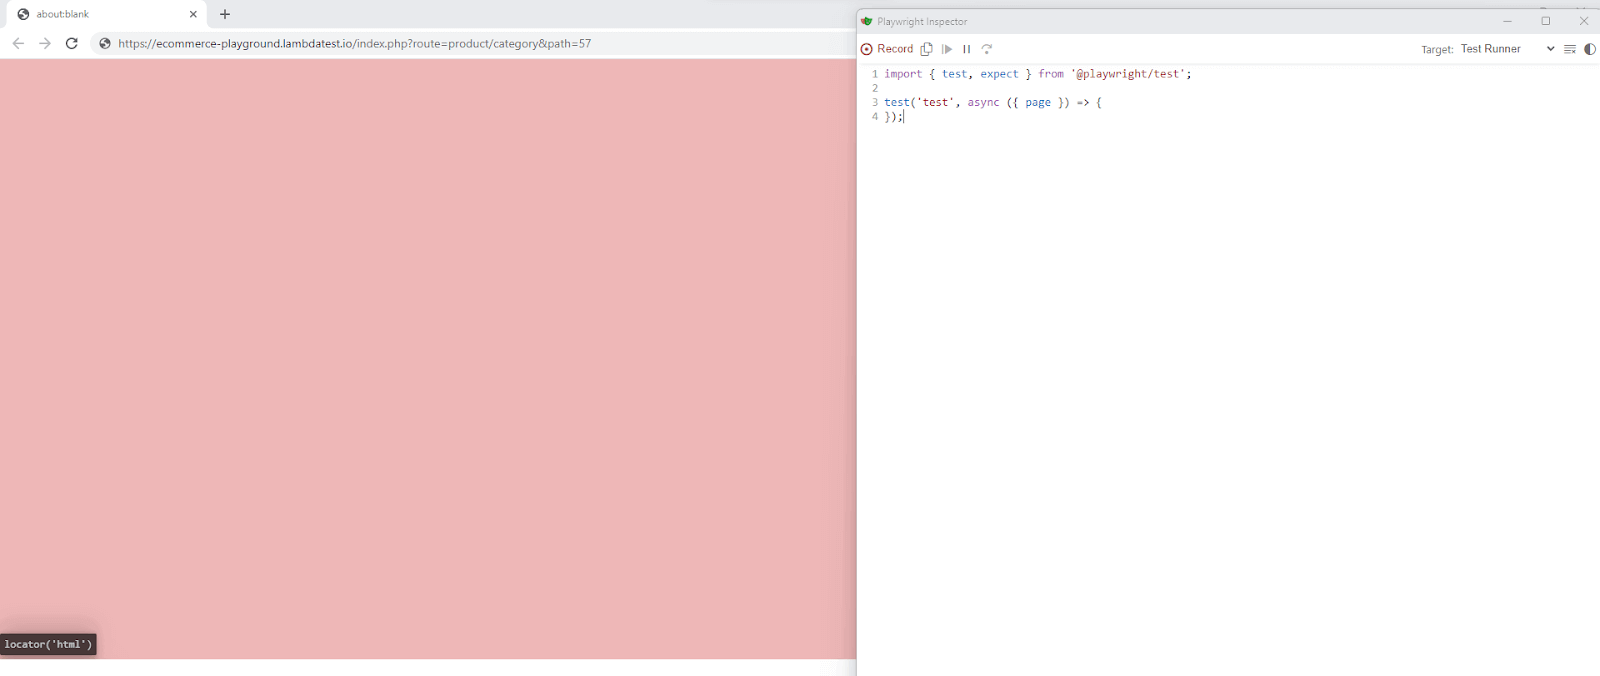
The opened chromium and Playwright Inspector resemble a blank canvas where we are free to perform actions, and the recording will start.
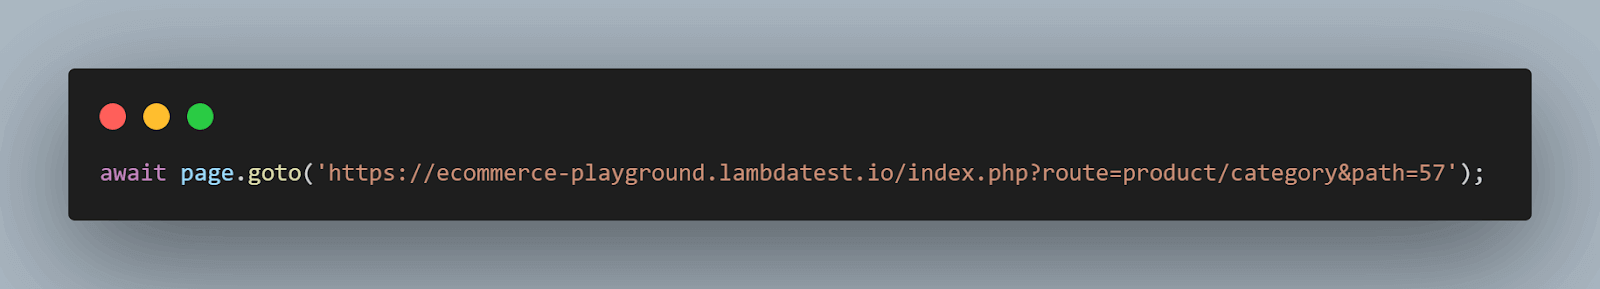
After entering the URL and pressing enter, the action is recorded, as seen in the image below.
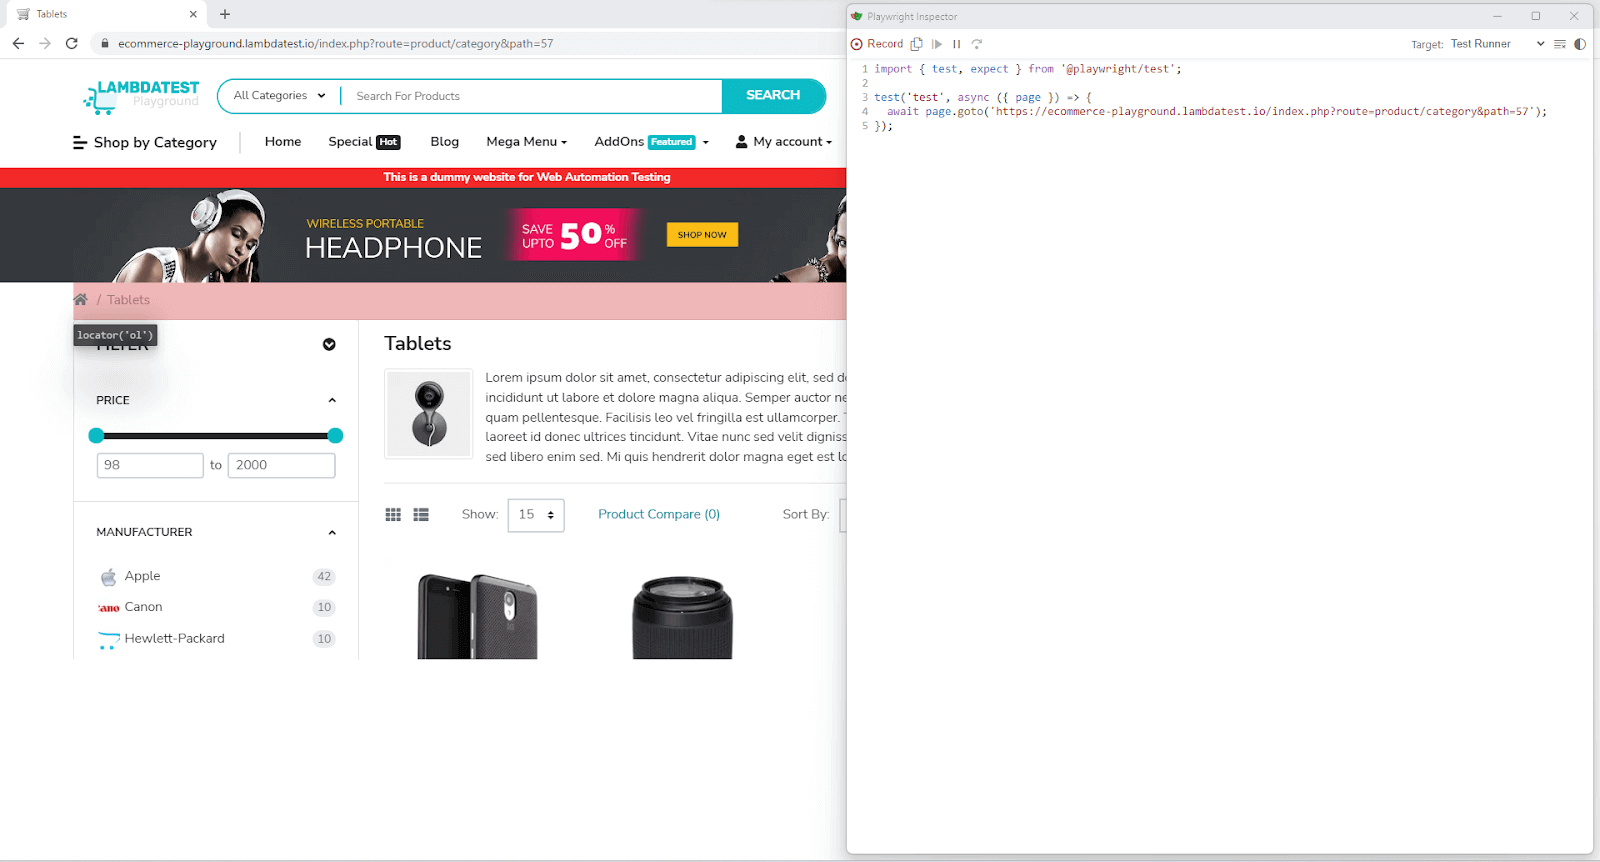
The product images on the test website are lazy-loaded, i.e., we have to scroll down to load them and be able to locate them.
⚠️The downside of the Playwright Inspector, however, is that it cannot record the scroll event. So, later in the generated code, we will have to add the mouse scroll manually.
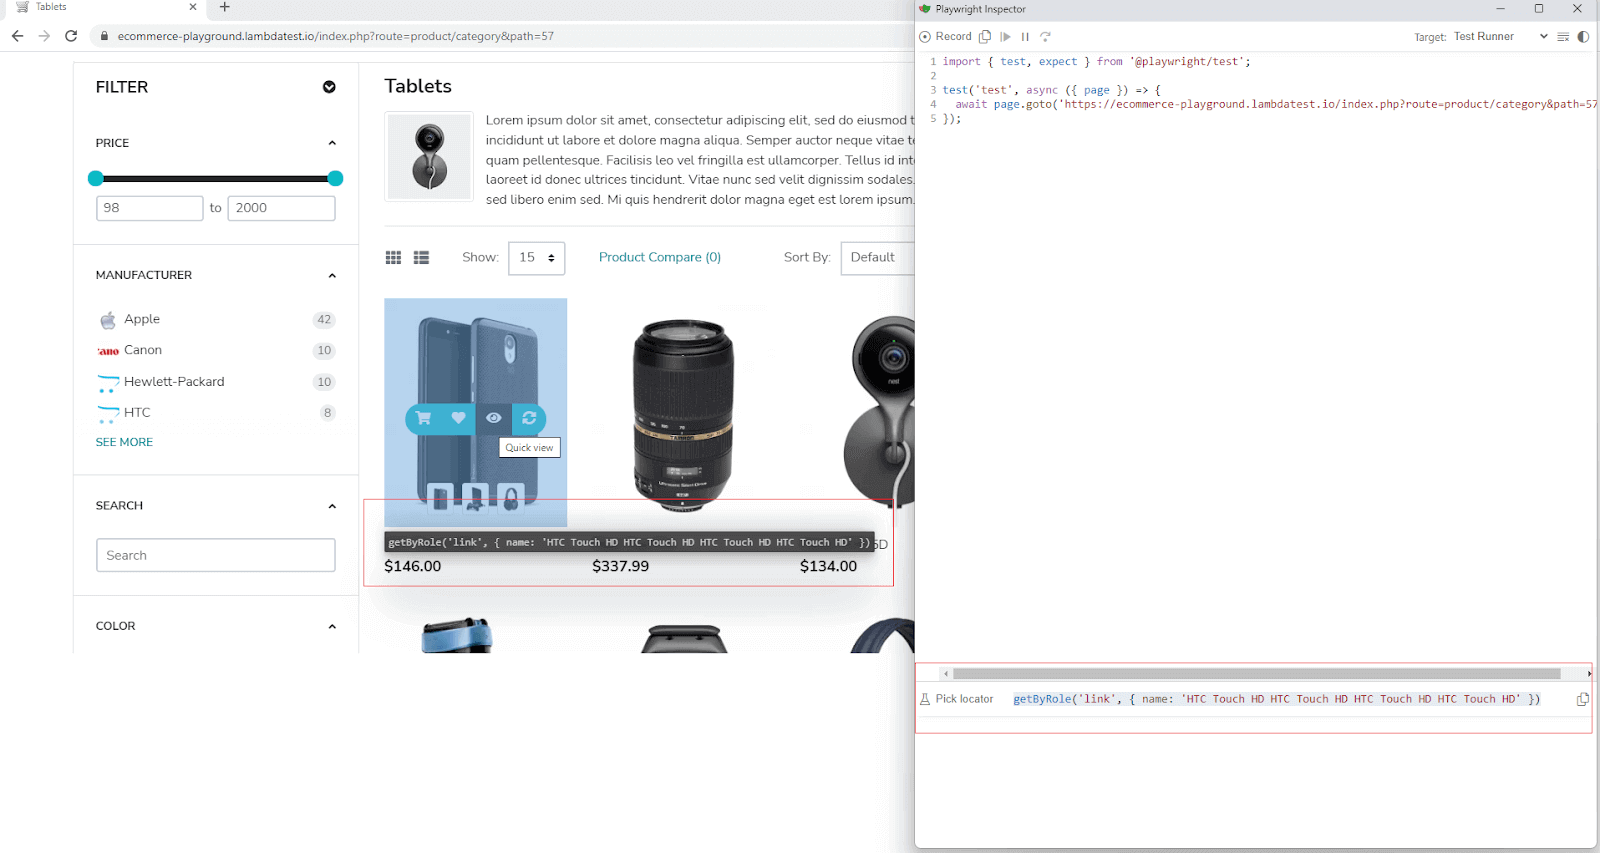
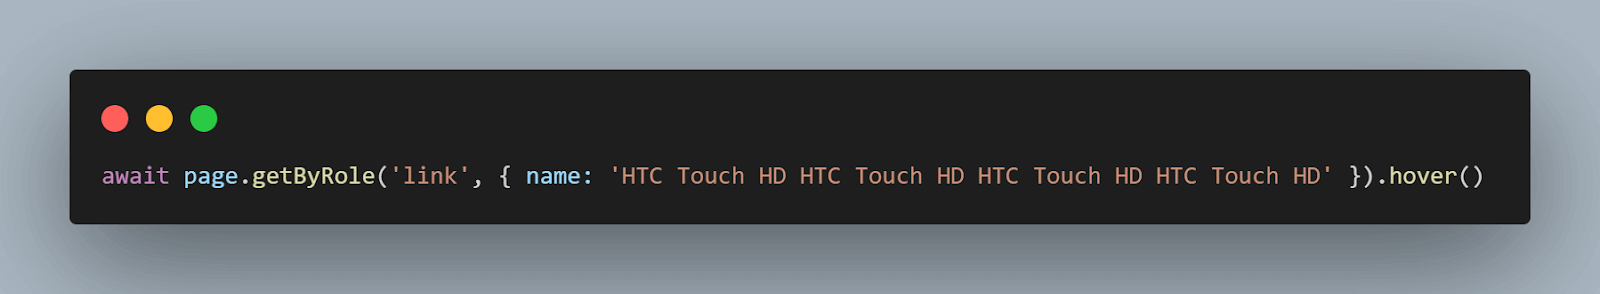
For now, let’s continue locating the product and pop-up menu. The pop-up menu is available only when we hover over the product. The Playwright Inspector doesn’t record this hover action as well.
So, another issue that we need to handle manually. But it gives us the locator of the product, which is enough. On this locator, we can call the Playwright hover() method.
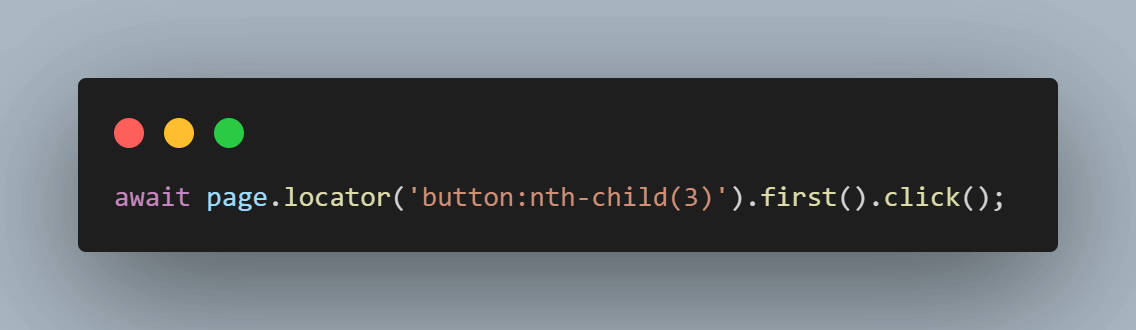
Next, we locate ‘Quick View’ from the pop-up menu and click on it.
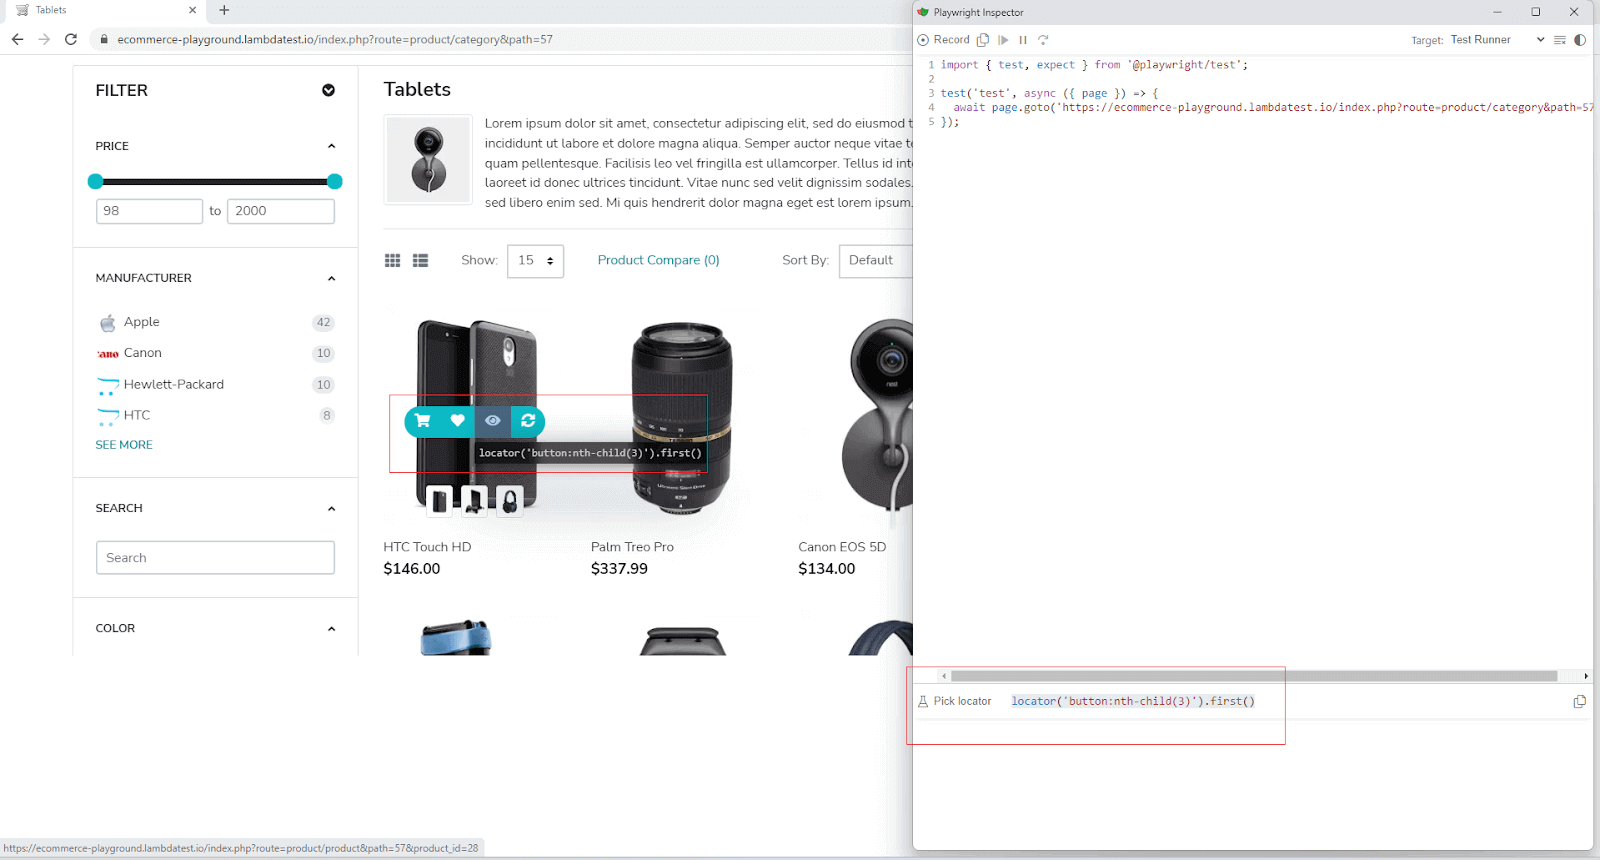
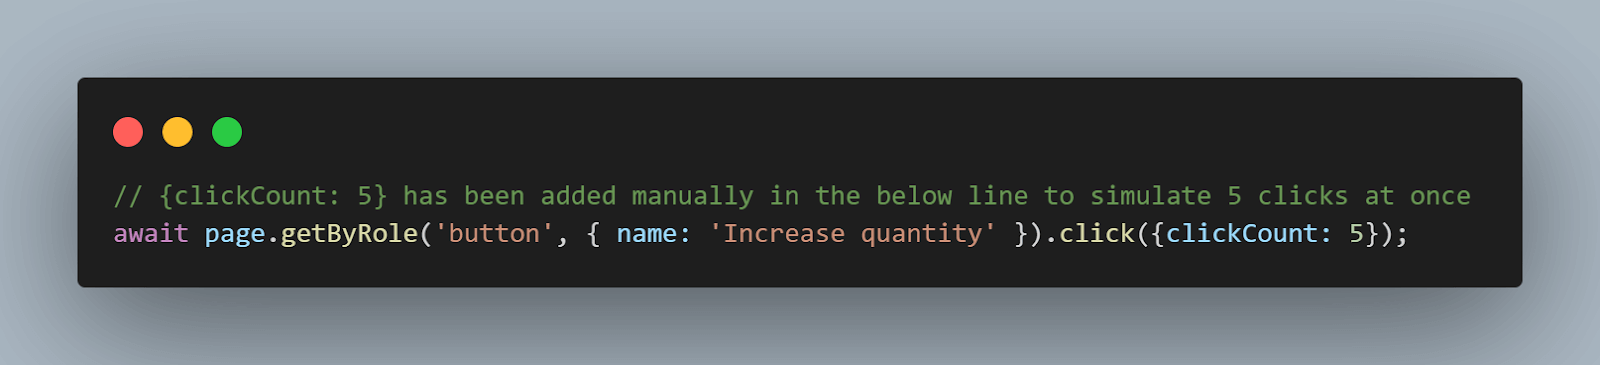
On the subsequent modal that opens, we can locate the ‘+’ element, which increases the quantity and can be clicked to increase the quantity. Here we can either perform the click action multiple times using the Playwright click() method or supply the {clickCount: 5} parameter to the click() method to increase it to 6 directly.
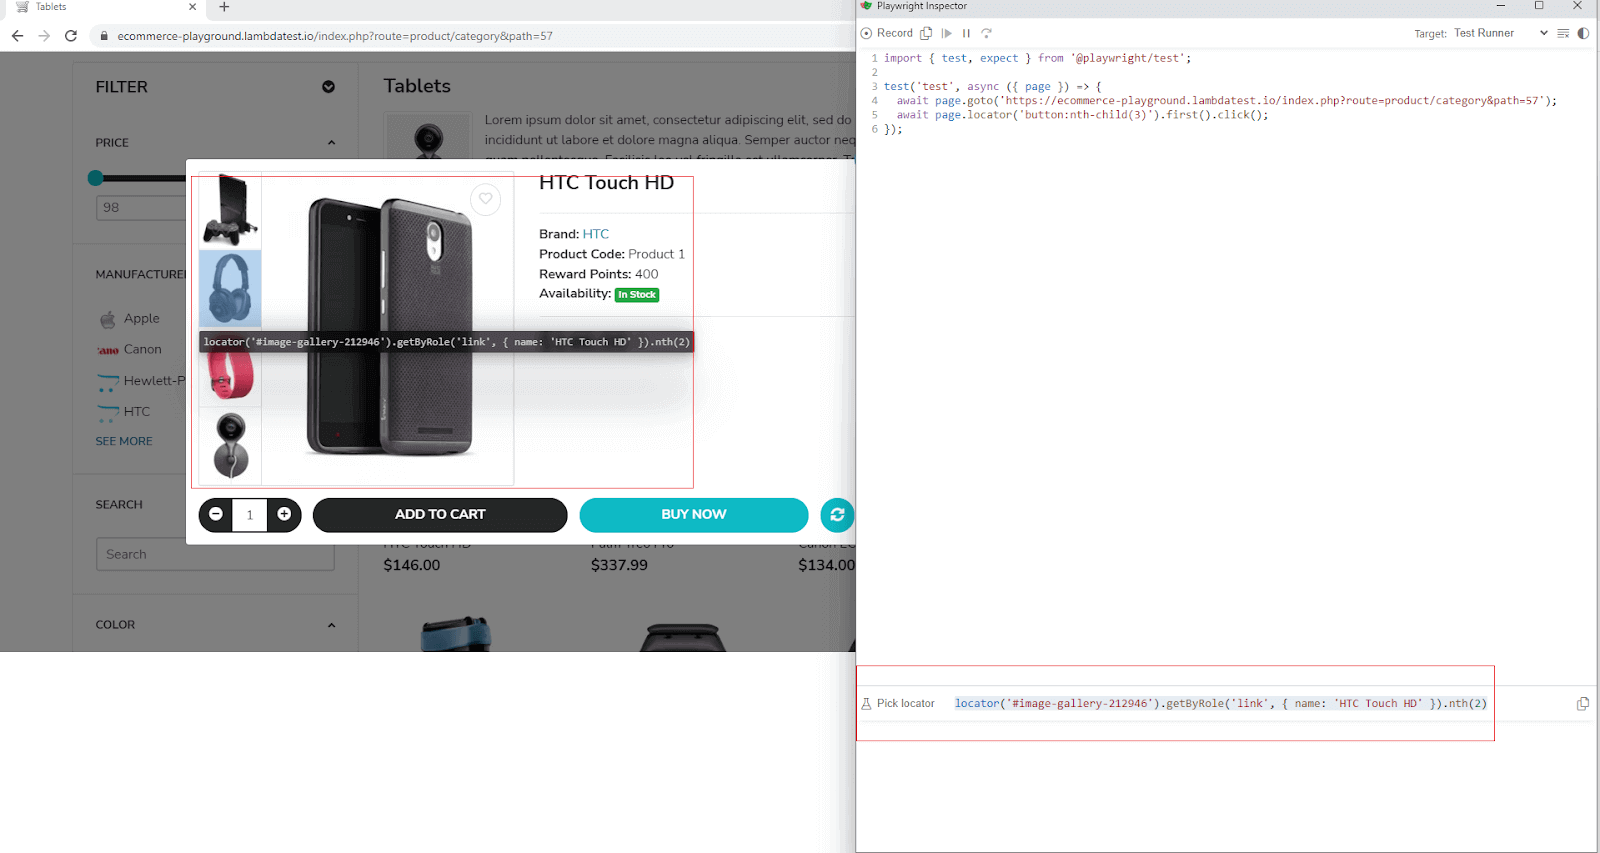
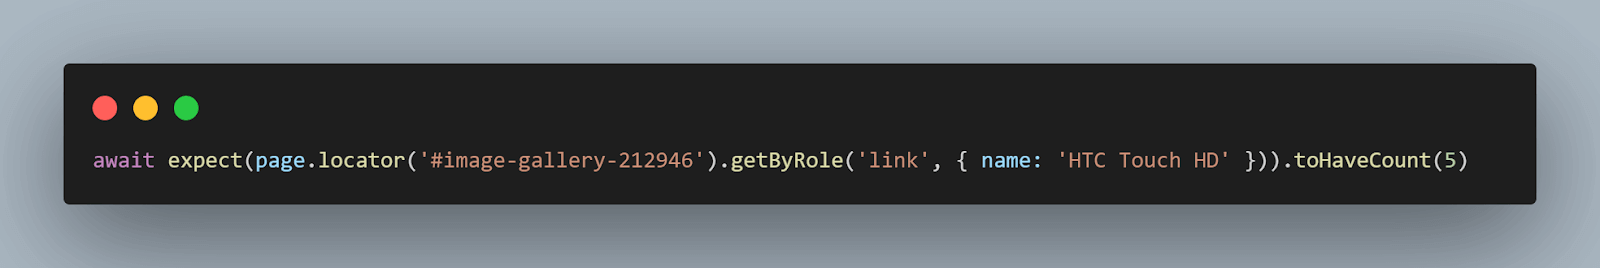
The last one is locating the image group, which cannot be directly reached. We have to use Playwright locator chaining first to get the image gallery element and then all the links with the name HTC Touch HD. We can see there are a total of 5 images, so the locator should match 5 elements. This is exactly the assertion we will verify.
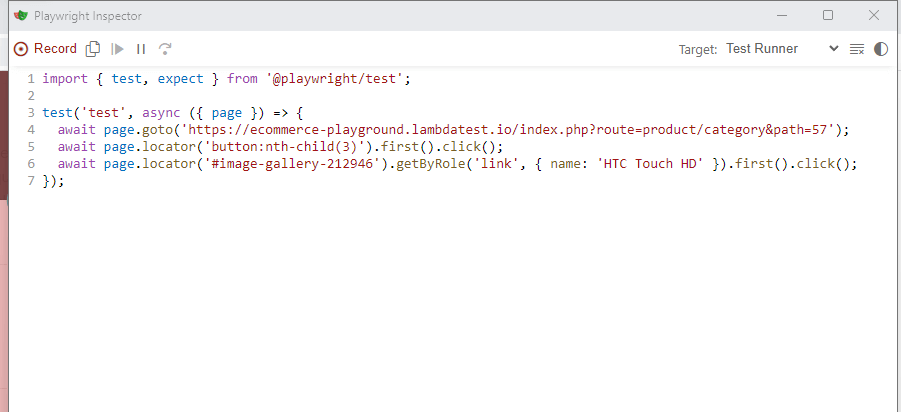
The final boilerplate code generated by Playwright Inspector looks like below. While it’s not perfect and lacks the hover() on the product and the mouse scroll, it’s a good starting point. Even with these shortcomings, Playwright Inspector did a good job of providing complex locators, and in the case of the image gallery, even was able to generate chained Playwright locators.
|
1 2 3 4 5 6 7 8 9 10 11 12 13 14 |
test('dynamic element’, async ({ page }) => { await page.goto('https://ecommerce-playground.lambdatest.io/index.php?route=product/category&path=57'); await page.mouse.wheel(0, 50) await page.getByRole('link', { name: 'HTC Touch HD HTC Touch HD HTC Touch HD HTC Touch HD' }).hover() await page.locator('button:nth-child(3)').first().click(); // the { clickCount:5 } has been added manually to simulate adding 5 items as once await page.getByRole('button', { name: 'Increase quantity' }).click({clickCount: 5}); // the following two lines which perform the expect test assertion have been added manually await expect(page.getByRole("spinbutton", { name :'Qty' })).toHaveValue('6') await expect(page.locator('#image-gallery-212946').getByRole('link', { name: 'HTC Touch HD' })).toHaveCount(5) await page.pause() }); |
Code Walkthrough
Step 1
We first navigate to the product page URL.
Step 2
The product images are lazy loaded, so we simulate the mouse scroll, which the Playwright Inspector does not capture.
Step 3
Next, we hover() over the product image to make the pop-up menu visible.
Step 4
On the pop-up menu, ‘Quick View’ is the 3rd element located by the tool.
Step 5
The ‘+’, which increases the quantity, is a button. We locate and click on it and amend the click() method to simulate 5 clicks by adding the {clickCount :5 } argument
Step 6
After this, we locate the input element where the quantity is displayed and use the expect() assertion to make sure it has the value 6
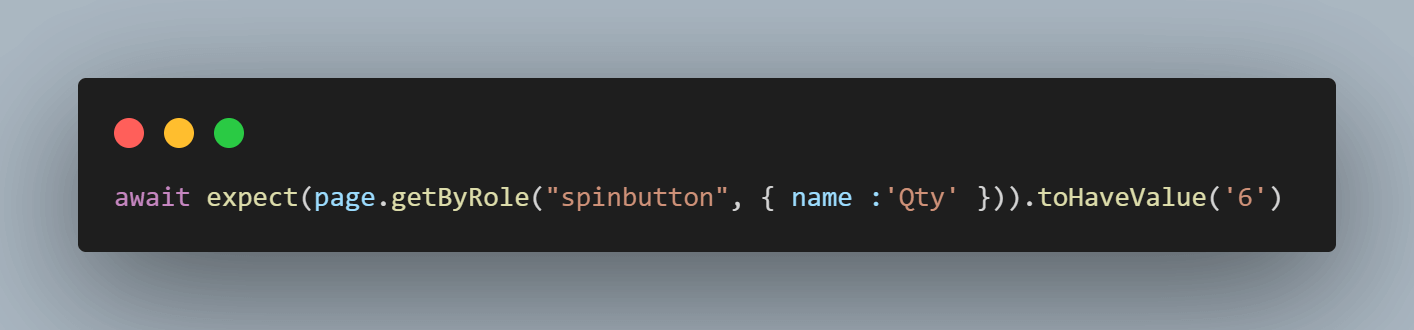
Step 7
Lastly, we use the expect() assertion of the product image gallery locator and assert it to have matched 5 elements for the 5 images seen.
Step 8
The await page.pause() method supports the pause of debugging execution at this point.
Execution
Now, let’s execute the single test. This can be done by using the -g flag and giving the name of the single test we want to run.
|
1 |
npx playwright test -g “dynamic element” |
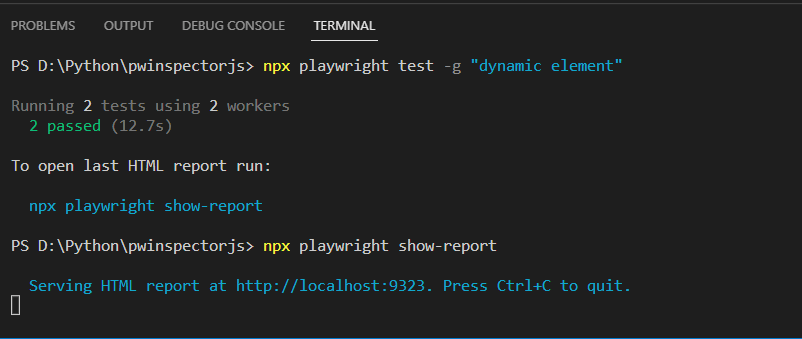
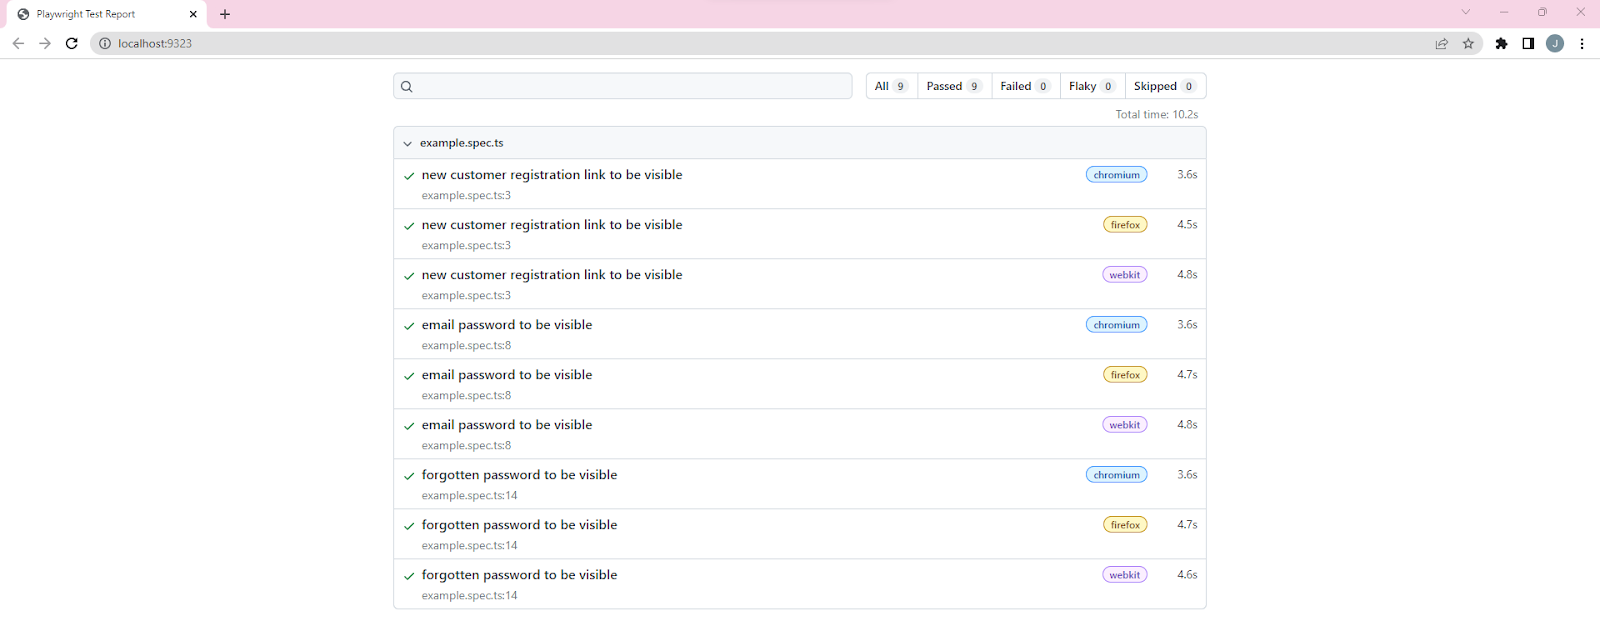
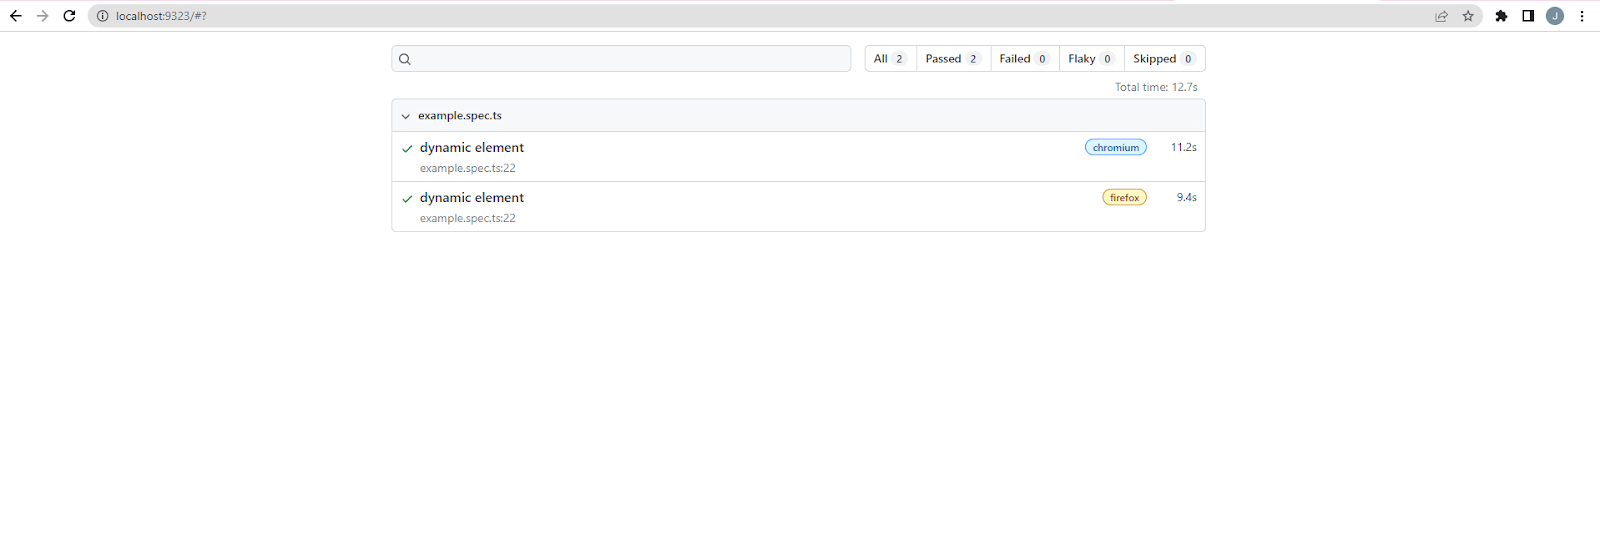
npx playwright show-report allows viewing the HTML report providing insights into the test run such as the number of tests run, passed, failed, and flaky tests. The individual tests also show browsers against which it was run. Clicking on individual tests also shows details about steps and actionability logs.
The below image shows the overview of the generated HTML report.
We can click on the individual test and then view the actionability logs in each step, as shown in the image below.
The Playwright Inspector is not only capable of recording user actions to generate scripts and tests but can also be used to debug tests.
How to debug tests using Playwright Inspector?
To run the Playwright Inspector in debug mode, we need to use the – – debug flag. By default, this will run all the tests one by one based on the browsers configured in the playwright.config.ts file and open the inspector and a browser window for each test.
We will be reusing the same test suite we wrote in the blog to understand debugging using Playwright Inspector. Since we have only configured one browser, Chromium, in our config file playwright.config.ts, only that will be used for debugging run.


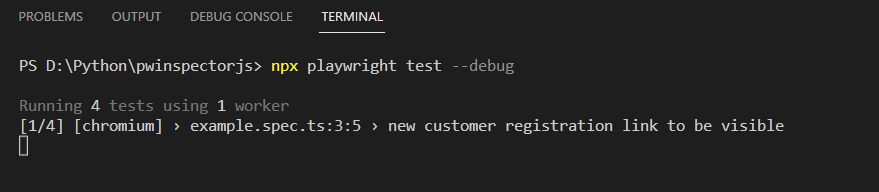
Starting the execution of the tests in debug mode.
|
1 |
npx playwright test --debug |
The Playwright Inspector will start in debug mode, and the top menu will reveal options to resume (F8), Step over (F19) tests, which allow step-by-step debugging, are now activated.
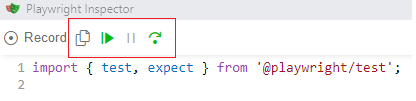
The actionability logs also start showing at the console, indicating the progress of the test.
The Chromium browser will always launch in headless mode with no default timeout. No action will be performed if we do not press the Resume or Step over button.
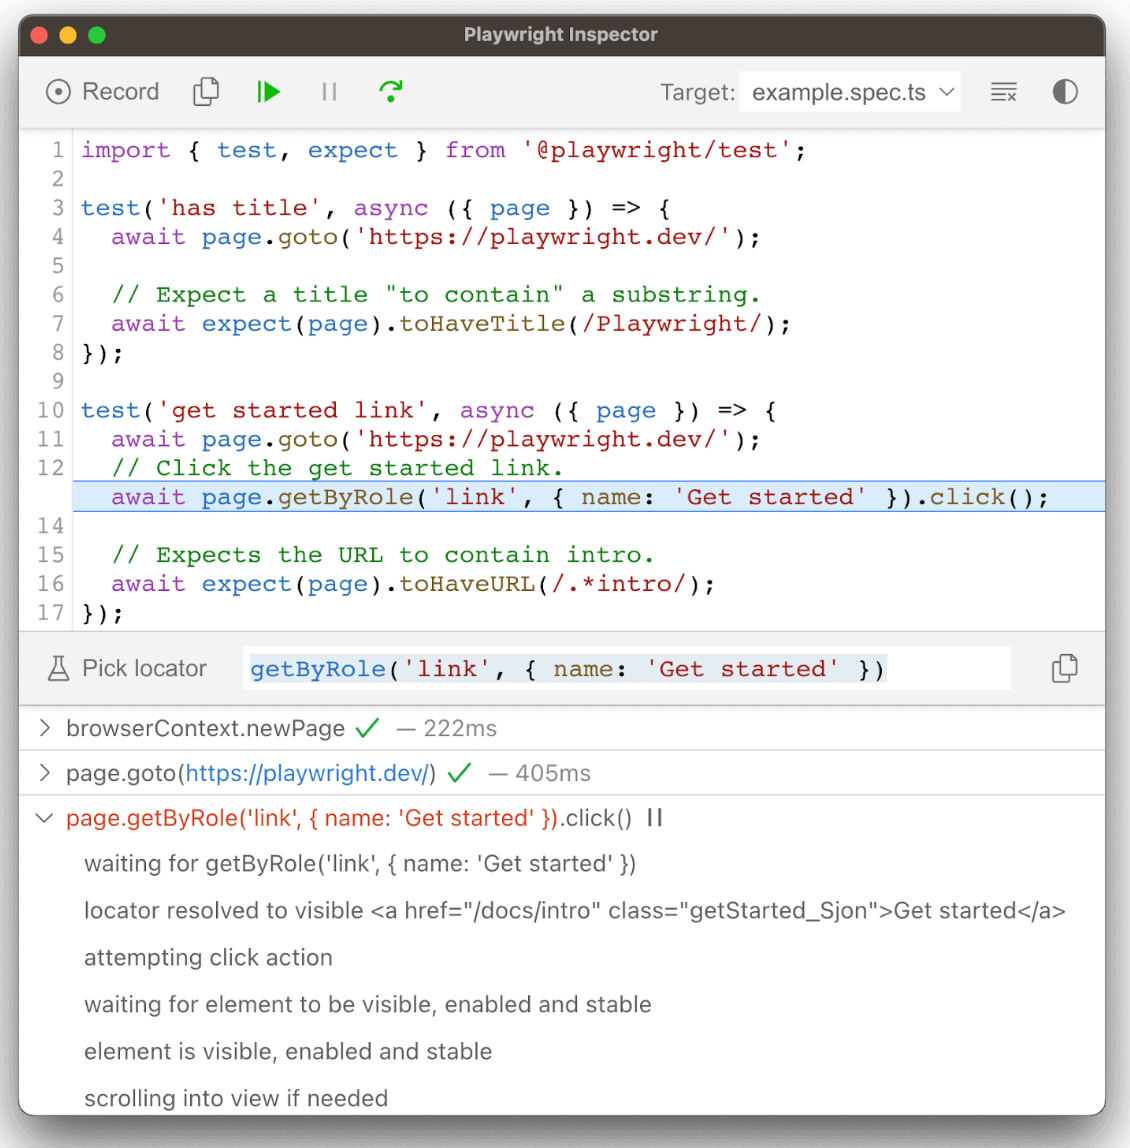
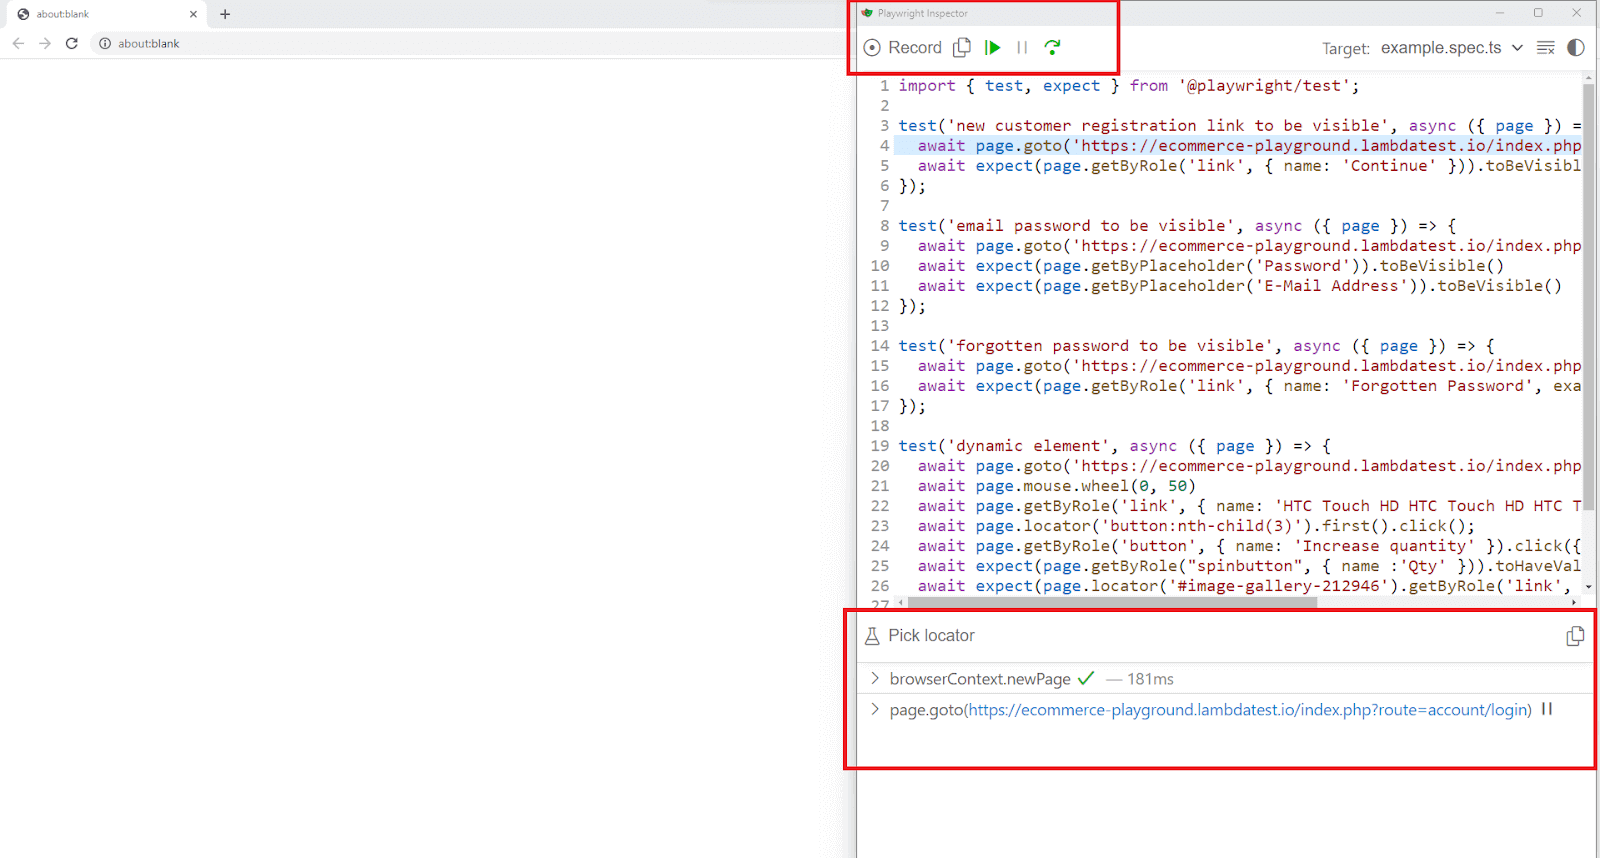
The upper half of the Playwright Inspector shows the code under test, and the lower half shows the actionability log. This can help us understand what happened during our test and what Playwright did or tried to do. The log informs if the element was visible, enabled, and stable, if the locator resolved to an element, scrolled into view, and so much more. If actionability can’t be reached, it will show the action in the Pending state.
Live Editing Playwright Locators
When a running test is paused, we can also experiment with various locators to find elements. ‘Pick Locator’ needs to be enabled, and then on the text field next to it, we can use the built-in or custom locators to find elements.
The example image below shows the use of the getByRole(“link”) locator to find all the links on the page. This helps us debug the existing locators and fine-tune the auto-generated locator.
Debug a Test From a Specific Breakpoint
Sometimes, we don’t want to step through the entire test execution and speed up the debugging process by stopping after certain actions or several lines have elapsed. By default, when running the tests in debug mode, the control execution stops at each step on pressing the step over button and only runs the entire test if we press the resume button.
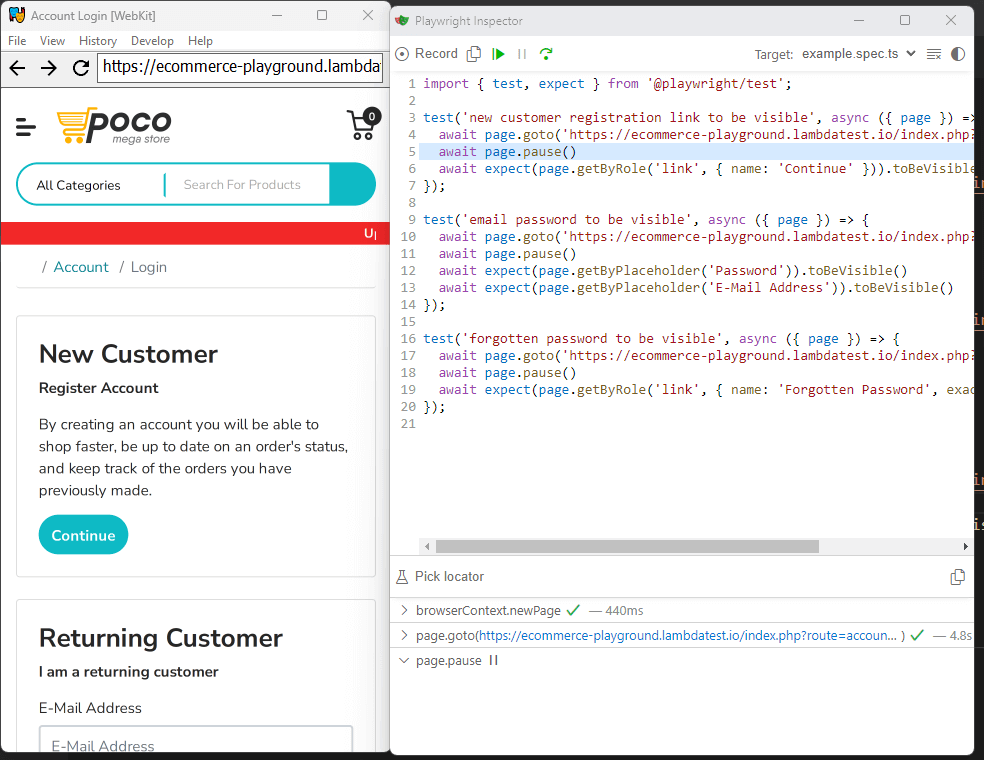
To override this behavior, we can add await page.pause() call in our tests. When we do this and start test execution, the Playwright inspector will only run the test until the point it encounters await page.pause(). As soon as it finds the await page.pause(), the execution is halted until we press the Resume button on the page overlay or there is a call to playwright.resume().
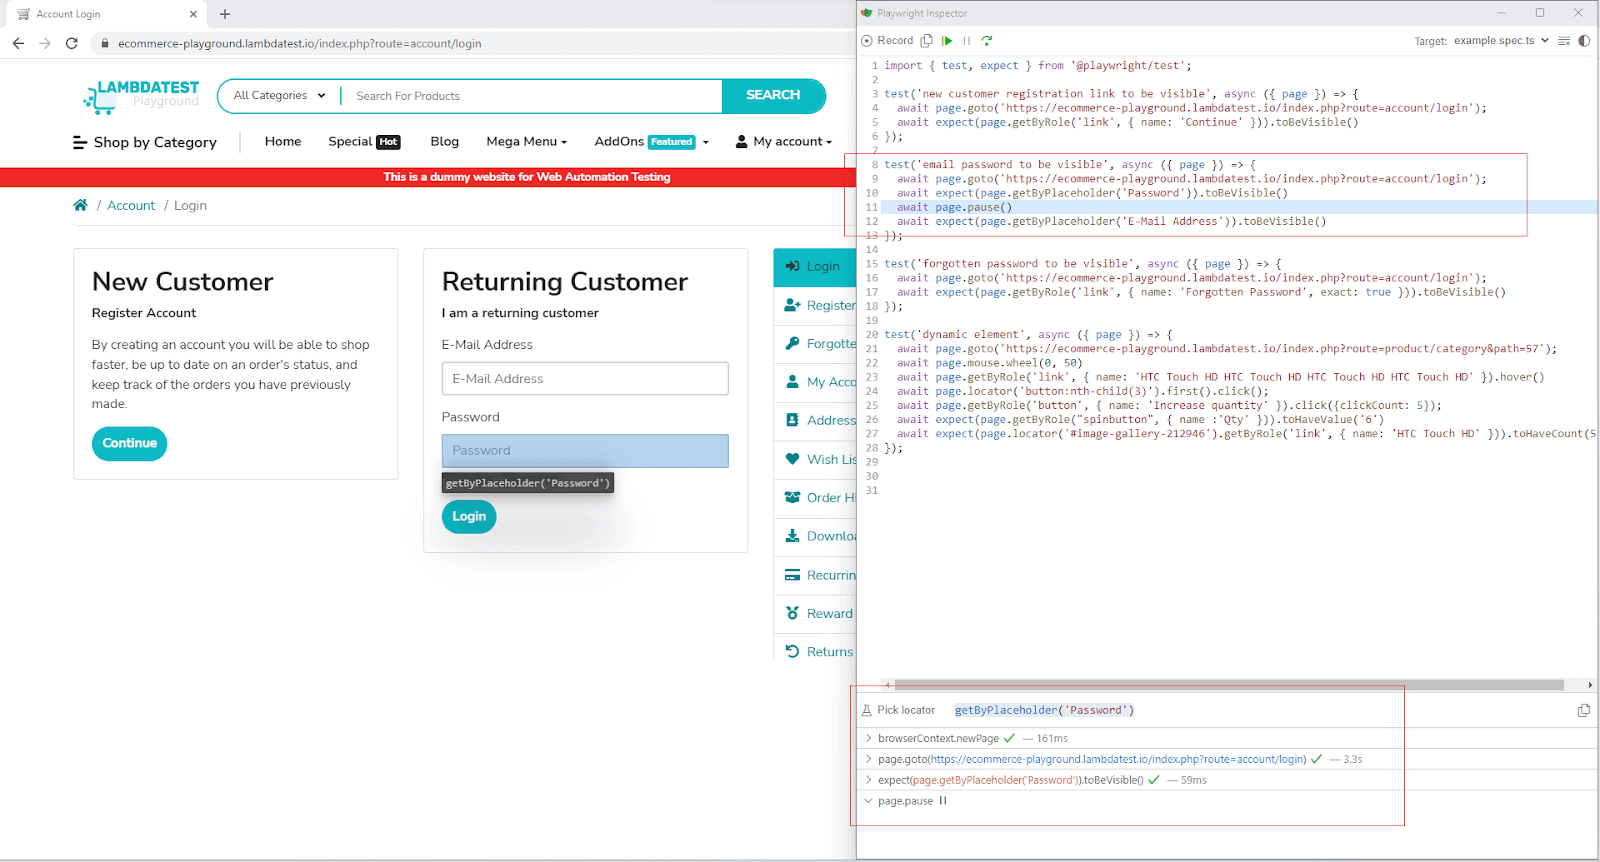
To demonstrate this, let’s add await page.pause() to the test(’email password to be visible’, async ({ page }) after the Password email assertion. Shown below is the modified implementation:
|
1 2 3 4 5 6 |
test('email password to be visible', async ({ page }) => { await page.goto('https://ecommerce-playground.lambdatest.io/index.php?route=account/login'); await expect(page.getByPlaceholder('Password')).toBeVisible() await page.pause() await expect(page.getByPlaceholder('E-Mail Address')).toBeVisible() }); |
Let’s now run a single test in debug mode
|
1 |
npx playwright test -g “email password to be visible” -- debug |
And as expected the test control execution has stopped at the first instance of await page.pause().
Debug Tests on Mobile Viewport
The TypeScript and JavaScript API of Playwright Inspector supports debugging tests on all or a single browser or even on mobile viewports. The configuration for setting the allowed browsers and mobile viewports needs to be done in the playwright.config.ts file.
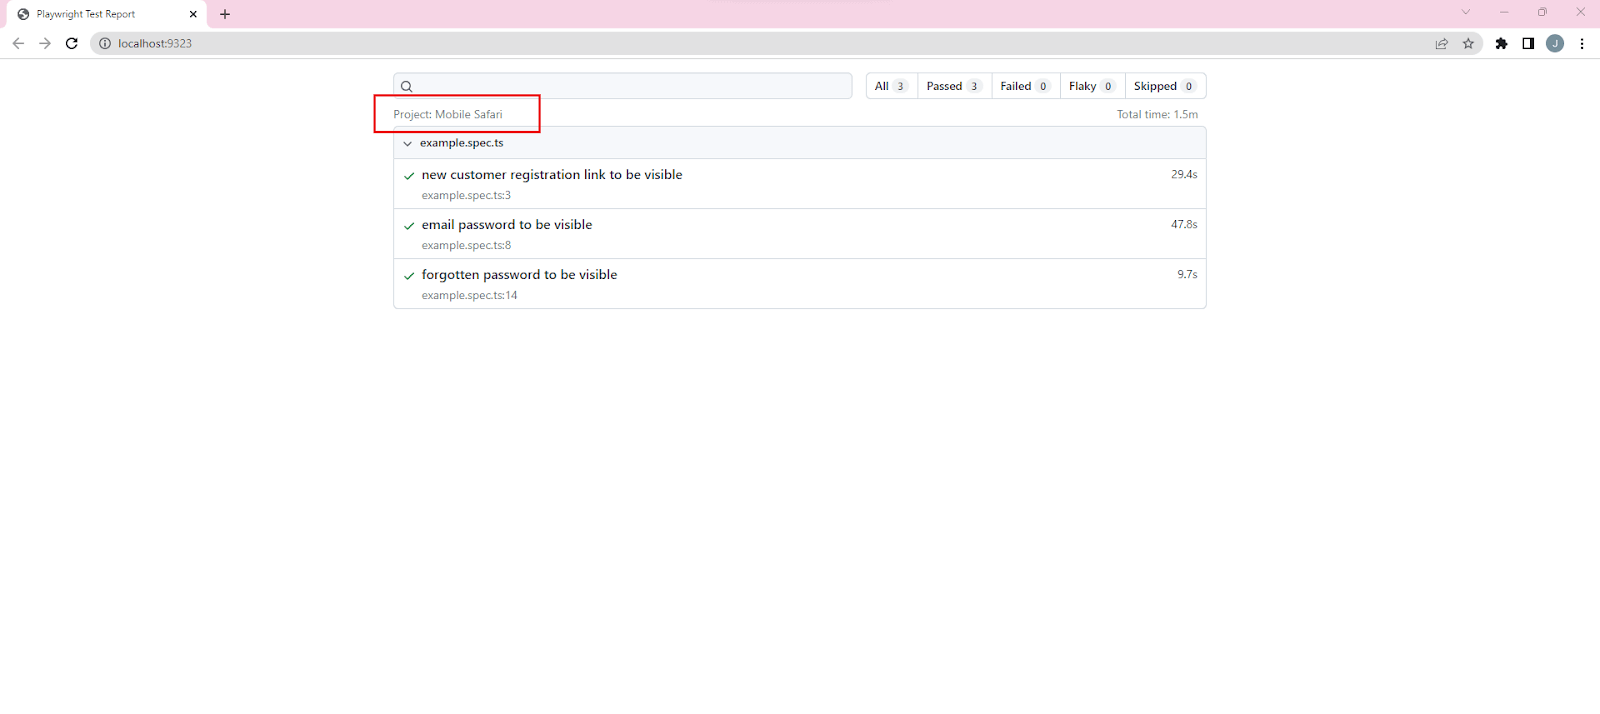
Consider, for example, that we want to debug the tests written in file example.spec.ts only on Mobile Safari.
Modify the playwright.config.ts to include the Mobile Safari viewport and the device as iPhone 12. The browsers and device settings are done under the projects list, as shown below.
Shown below is the debug output:
And if we now use the npx playwright show-report command, the output clearly shows the viewport configuration and numbers of tests run.
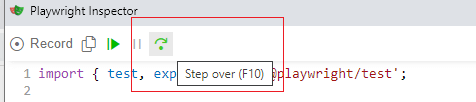
Stepping Over Tests
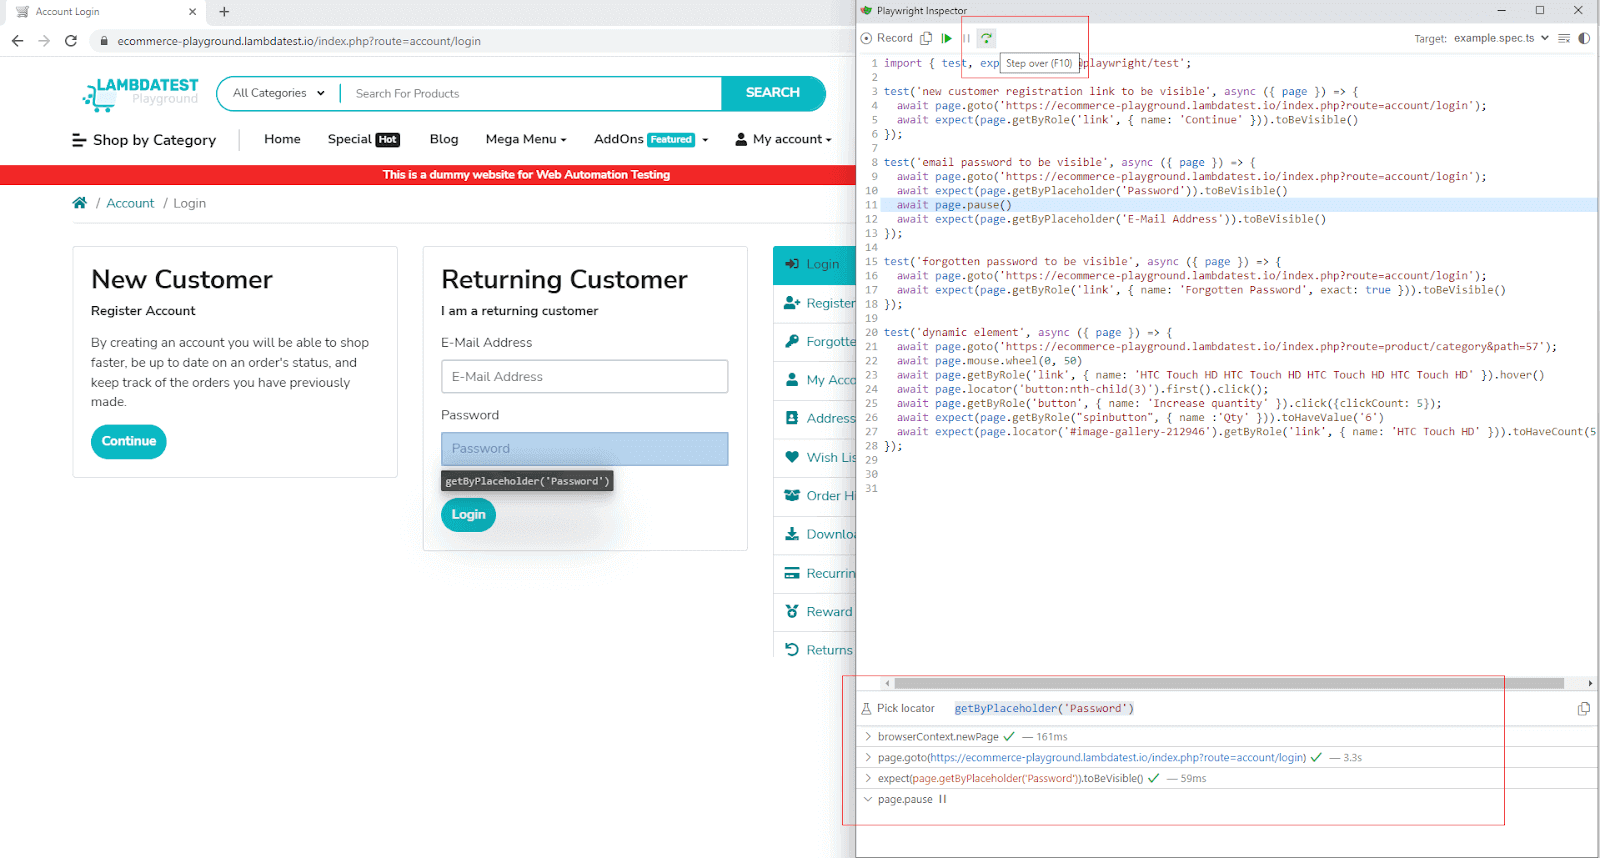
The Playwright Inspector allows stepping over tests using the top menu. We can either click the Step over button or use the keyboard shortcut F10.
The current action is shown in the Playwright Inspector, and the selected element is highlighted in the browser window. The second half of the Playwright Inspector also shows the actionability log indicating the executed lines and the currently executing line.
Debug Dynamically Loading Elements
In the second test scenario, we wrote a test case for dynamically loading elements using the TypeScript API of Playwright. Dynamically loading elements make the perfect candidate for debugging as there is a chance of flakiness in such tests.
Debugging a single test can be started by firing the below command where the -g flag indicates we wish to run the single test specified by its name.
|
1 |
npx playwright test -g "dynamic element" --debug |
We use the step over (F10) button and stop first after the scroll. The actionability logs clearly show the progress so far.
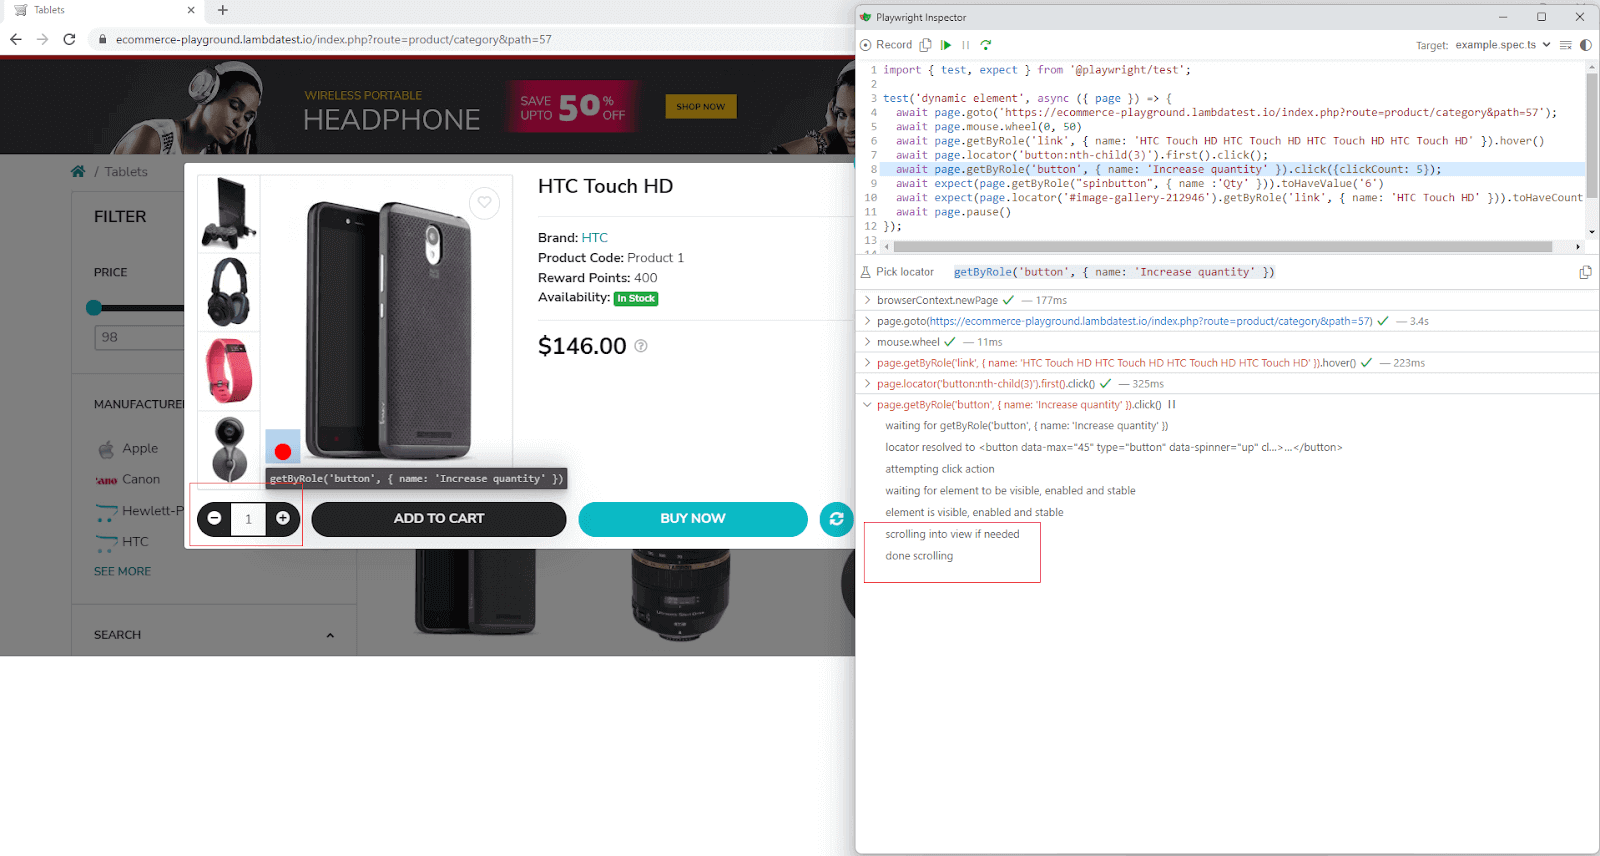
Before completing the click() action on the increase quantity button, we can see the count is 1. After stepping over, the count becomes 6, which is clear to see.
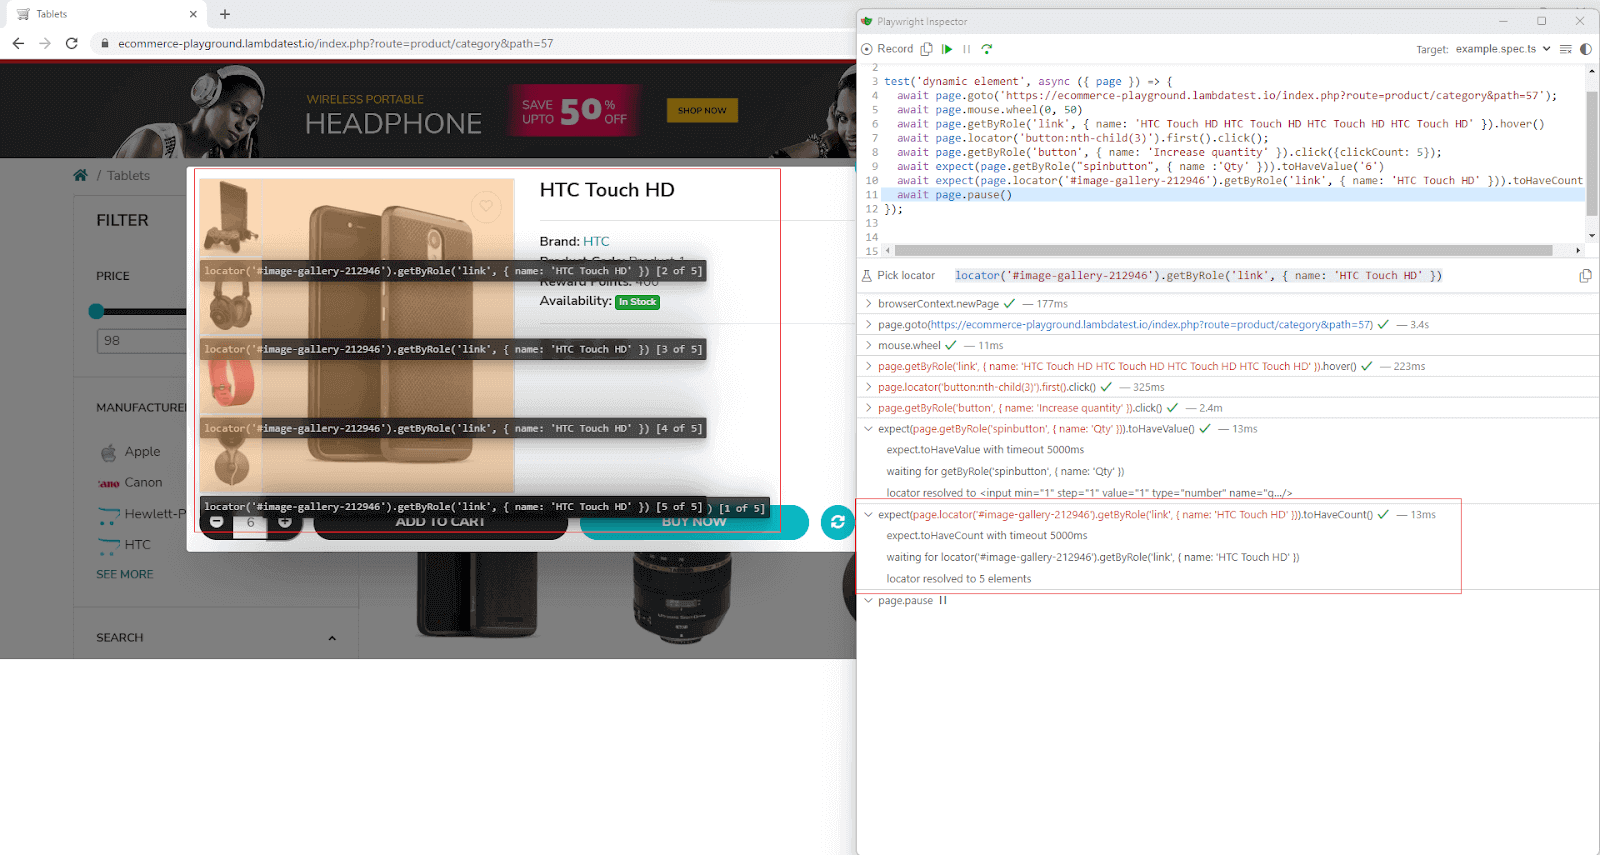
While the debugging provided simple insights, it’s very effective in the next line, where we are trying to verify that 5 images exist in the gallery. The debugging screen clearly shows the matched elements by the locator.
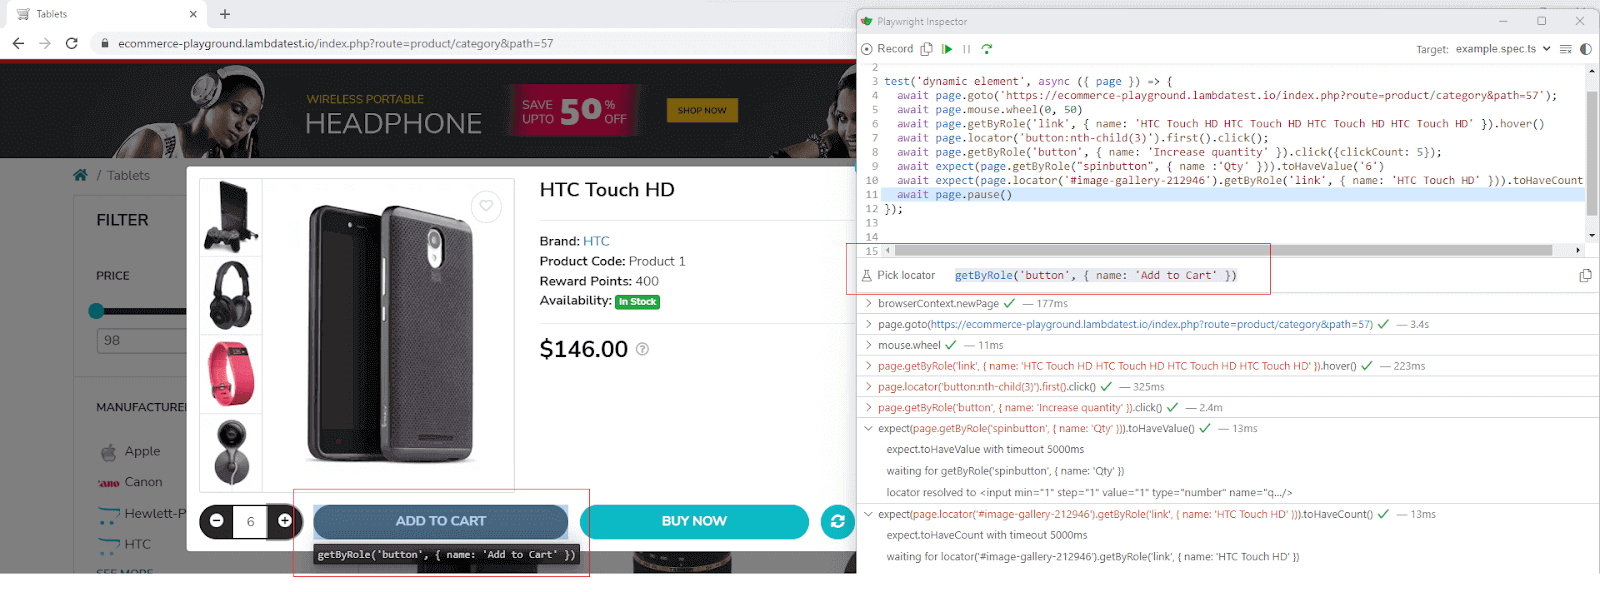
We can also use the debugging screen to locate other elements on the modal; for example, we want to find the locator for the ‘ADD TO CART’ button. We can click the ‘Pick Locator’ to enable the live locator. Once enabled, we click on the ‘ADD TO CART’ to let Playwright Inspector provide the locator in the text field next to ‘Pick Locator’.
This is a simple yet effective demo of live debugging of tests and how the Playwright Inspector can help make the life of automation teams build and improve the existing tests and test suites.
However, you can further scale your Playwright testing experience by running tests on the cloud-based grid. Digital experience testing platforms like LambdaTest lets you perform automation testing with Playwright on an online browser farm of 50+ real browsers and OS combinations.
It also allows you to achieve faster release cycles by executing Playwright tests in parallel.
Check our documentation: Getting Started with Playwright Testing
Looking to showcase your skills as a Playwright automation tester? LambdaTest’s Playwright 101 certification program is tailored for developers aiming to demonstrate their expertise in utilizing Playwright end to end testing of contemporary web applications.
Conclusion
This blog provides a glimpse into the world of test generation and debugging using the Playwright Inspector tool. However, there is much more to explore beyond the surface. Whether you lean towards Python or TypeScript, Playwright Inspector offers seamless integration with these widely used programming languages, empowering you with extensive test automation and debugging capabilities.
We witnessed the utilization of the Playwright Inspector tool with TypeScript. The versatility of Playwright Inspector, accommodating multiple programming languages according to the expertise and preferences of QA and automation teams, positions Playwright as an exceptional choice for automating applications across the board.
Daily usage, more experience, and experimenting with the Playwright Inspector tool can improve the ability to build robust and resilient test automation suites for any web application. Playwright Inspector tool also matures with each new version that is released.
Playwright Inspector is an indispensable tool for developers and QA professionals who must quickly create and debug automated tests. Its user-friendly interface makes it easy to write and run tests and even helps debug them.
One of the key advantages of Playwright Inspector is its ability to run tests on various devices and viewports. This means we can easily test our web application across different devices, screen sizes, and resolutions, which is crucial for ensuring a seamless user experience.
Additionally, the tool’s live element location feature makes it easy to identify and fix any issues with our website’s elements. So, if you’re not already using Playwright Inspector, it’s worth trying.
Frequently Asked Questions (FAQs)
What is the Playwright Inspector for Windows?
The Playwright Inspector for Windows is a powerful tool provided by the Playwright framework. It is a dedicated development tool that allows developers and QA professionals to inspect and debug their Playwright scripts interactively. The Playwright Inspector provides a graphical user interface (GUI) that enables users to record and replay browser interactions, inspect element properties, and generate reliable selectors for element identification.
With the Playwright Inspector, users can view and analyze the DOM (Document Object Model) structure of web pages, monitor network requests, and debug Playwright scripts step-by-step. It offers a comprehensive set of features for inspecting, debugging, and troubleshooting web applications, making it easier to identify and fix issues during test automation or web development processes.
How do you open the inspector in Playwright?
To open the Playwright Inspector, follow these steps:
- Install Playwright: Make sure you have Playwright installed in your project. You can install it via npm.
- Launch the Inspector: In your code, import the Playwright module and launch the Inspector by calling the playwright.selectors() function and invoking the inspect() method.
- Interact with the Inspector: Once the Inspector is launched, a new browser window will open, providing a graphical interface to inspect and interact with web pages. You can inspect the DOM elements, view network requests, debug scripts, and generate selectors for automation.


Author’s Profile
Jaydeep Karale
Jaydeep is a software engineer with 10 years of experience, most recently developing and supporting applications written in Python. He has extensive with shell scripting and is also an AI/ML enthusiast. He is also a tech educator, creating content on Twitter, YouTube, Instagram, and LinkedIn. Link to his YouTube channel- https://www.youtube.com/@jaydeepkarale
Blogs: 6
Got Questions? Drop them on LambdaTest Community. Visit now


