
How To Reduce Page Load Time In JavaScript
Solomon Eseme
Posted On: July 4, 2023
![]() 233252 Views
233252 Views
![]() 17 Min Read
17 Min Read
Page speed is a significant challenge in modern web applications. It is an important part of any user’s experience.
According to Forbes, 40% of people bounce from a website that takes more than 3 seconds to load. It is also important to note that a website that achiеvеs a loading timе of just 1 sеcond еxpеriеncеs a convеrsion ratе 5x highеr comparеd to a wеbsitе that takеs 10 sеconds to load.
This shows that users care more about page speed than the new shining design added to the website. To understand how your users will interact with your web pages, you need to further test websites under different network conditions, different screen sizes, browsers, and platforms.
This information will expose how users will interact with your webpage, and it will also show the UI components that need improvement even before moving your webpage to the production environment.
This blog will explore how to reduce page load time in JavaScript and the tips you can implement to increase your page speed.
TABLE OF CONTENTS
What is Page Load Time?
Page load time is the average time it takes for a page to appear on your screen. It is calculated from when the page link is clicked or loaded to when it is completed. In enterprise applications, reducing the amount of time it takes for a page to load is an important investment, as we have seen in examples of how it could minimize conversion rate and affect business revenue.
Why Reduce Page Load Time in JavaScript?
As we have discussed above, there are financial and other implications, such as a drop in traffic, drop in conversions, or increased bounce rate, etc., for not reducing the page load time. Below are some benefits why you should reduce the page load time of your software application.
- Improve user experience: Faster page loading times lead to improved user experience, as users can find the information they need quickly and easily.
- Increase conversion rates: When users can load a page quickly, they are more likely to stay on the page and complete the desired action.
- Improve SEO rankings: From Search Engine Journals, search engine algorithms take page loading times into account when ranking websites, so faster page loading times can help improve SEO rankings.
- Reduce server load: Faster page loading times can reduce the load on the server, leading to improved performance and reliability.
- Reduce bounce rates: Faster page loading times can reduce bounce rates, as users are more likely to stay.
When a website takes a long time to load, users may be quick to abandon it and switch to a faster-performing one. On the other hand, a website with a fast loading speed will give the impression of being user-friendly and appealing, thus increasing the potential for more website traffic.
People who come to the website would likely enjoy looking at other content as well. The more people who look at the website’s content, the lower the bounce rate will be. The bounce rate is the percentage of people who leave the website after viewing only one page. The lower the bounce rate, the higher the quality of the website, both in terms of content and performance.
In the next section of this tutorial on how to reduce page load time in JavaScript, we will explore the different strategies you can implement to reduce the page load time of your software application.
 Note
NoteTest your web & mobile apps under varying network conditions. Try LambdaTest Today!
How to Reduce Page Load Time in JavaScript?
Different strategies can be used to reduce page load time. In this section on how to reduce page load time in JavaScript, we will elucidate some strategies you can use to reduce page load time.
Minimize HTTP Requests
One of the major causes of slow page load time is the number of HTTP requests the page has to complete before painting the page to the screen.
The larger the number of requests, the more the page loads slowly, especially if the requests contain large data to load, such as large images, videos, or HTTP payloads.
Therefore, to reduce your page load time, you need to inspect the different HTTP requests and the number of these requests your page is loading and reduce it.
The most effective way to reduce the number of requests is to combine all JavaScript resources into one, and you can do that with different applications, libraries, and online tools. However, we will demonstrate how to automate the building process using Apache Ant.
In Ant, the concat task can be used to join multiple files together. It is important to remember that the JavaScript files must be combined in the correct order to ensure that any dependencies are respected. To specify the order in which the files should be combined, you can use either a filelist or a combination of fileset elements.
Here is an example of how this could be done.
|
1 2 3 4 5 6 7 8 9 |
<target name="js.concatenate"> <concat destfile="${bld.dir}/result.js"> <filelist dir="${src.dir}" files="script1.js, script2.js"/> <fileset dir="${src.dir}" includes=".js" excludes="script1.js, script2.js"/> </concat> </target> |
Ant is instructed by this code to generate a file called result.js in the build directory. The contents of this file will be the combination of script1.js, then script2.js, and then all the files in the src directory in alphabetical order.
Enable Compression
You can use HTTP transfer encodings such as brotli or gzip to compress JavaScript assets in transmission when you enable compression in your request and response to the live cycle.
This process allows efficient transmission of files and therefore results in a faster page load time. Generally, the compression ratio can reach 75%, that is, KB; the compression size is only 25 kB.
Using a Content Delivery Network
Content Delivery Network (CDN) is a great way to reduce the latency of your users and deliver content to them faster because the content will be served from a location closer to them.
In addition, distributing static assets with a Content Delivery Network (CDN) can serve website visitors from a place closer to them geographically and also cache the content for the user during revisit.
Below are some of the CDN you can choose from to host your static files.
- Akamai
- Cloudflare
- Amazon CloudFront
- Microsoft Azure CDN
- Google Cloud CDN
- Fastly
- Level 3
- Limelight Networks
- CacheFly
- EdgeCast
Minify Resources
Minifying resources is another important strategy used to reduce the code size of your application without compromising any of its functionality. You can use different modification tools to minify the code, such as Closure Compiler, JSMin, or Uglify.
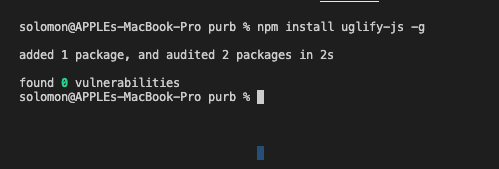
To minify a large JavaScript file on the go, you can install the uglify library globally using the command below:
|
1 |
npm install uglify-js -g |
Here’s a screenshot of a successful installation.
Next, you can use this command below to minify your JavaScript files as shown below:
|
1 |
uglifyjs jquery-3.2.1.js --output jquery-3.2.1.min.js |
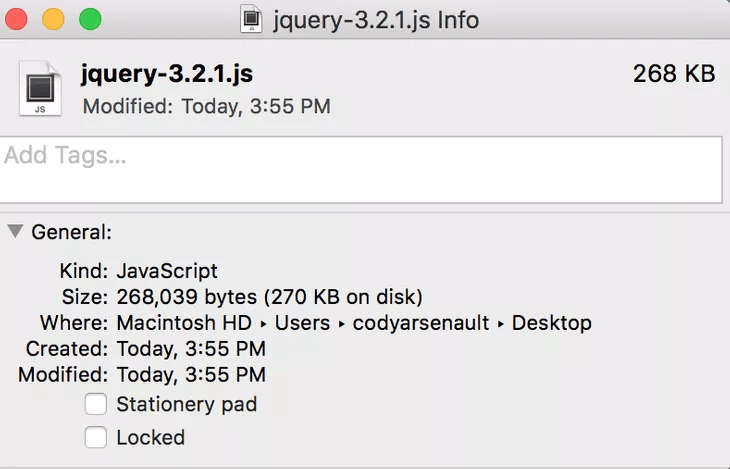
The original file size before minifying with the Uglify library.
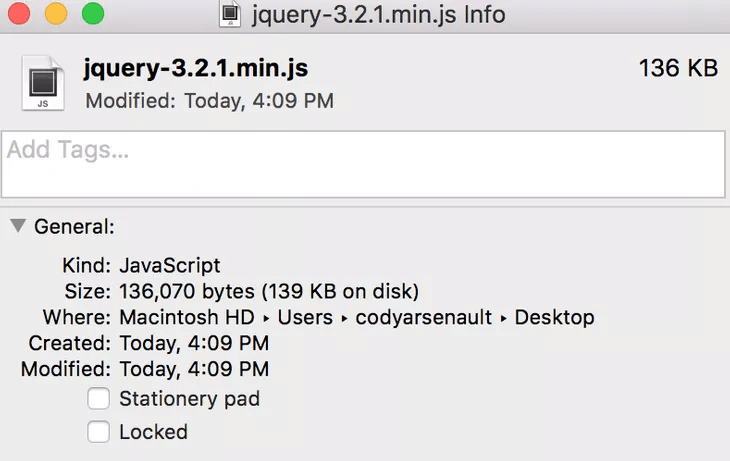
The current file size after minifying with the Uglify library. UglifyJS default settings determine the name of the input file and the output file. Already, there is a significant decrease in size; the original file was 268 KB, but after running it through UglifyJS, it is now only 136 KB.
NoteMinify JavaScript codes at your fingertips. Try Free JavaScript Minifier
Optimize Images
With more than 3.2 billion photos uploaded to the Internet daily, according to Photodoto, it is clear that images occupy the majority of your web content and, therefore, should be properly optimized to improve the load time of your web pages.
You can optimize your images in different ways. However, below are some other ways you can optimize your web images.
- Use the correct file format: JPEG for photographs, PNG for graphics and illustrations, and GIF for simple graphics and animations.
- Resize images to the correct dimensions: The larger the image, the more data it contains and the longer it takes to load.
- Compress images: Compressing images reduces the file size without sacrificing quality. Tools like TinyPNG let you reduce the size of images without losing their quality.
Also, to customize the size of the image with CSS and media queries, it is recommended to use a tool to reduce the image rather than doing it in real time with CSS. - Use a content delivery network (CDN): A CDN is a server network that delivers images to users based on their geographic location.
Reduce Redirects
Reducing redirects on a web page can reduce page load time by eliminating the extra time it takes for the browser to make multiple requests to the server.
When a browser requests a page, it must first request the server, then wait for a response. If the response from the server is to redirect to another website, the browser must then make another request to the new page and wait for a response.
This process takes time, and if there are multiple redirects, the page load time can be significantly increased. By reducing redirects, the browser can make fewer requests and receive responses faster, resulting in a faster page load time.
Leverage Browser Caching
Leveraging browser caching is a technique used to reduce page load time by allowing the browser to store certain web page resources locally.
When a user visits a website, the browser will download the resources needed to render the page, such as images, CSS, and JavaScript.
By leveraging browser caching, the browser will store these resources locally. When the user revisits the same page, the browser will not have to download the resources again, thus reducing the page load time.
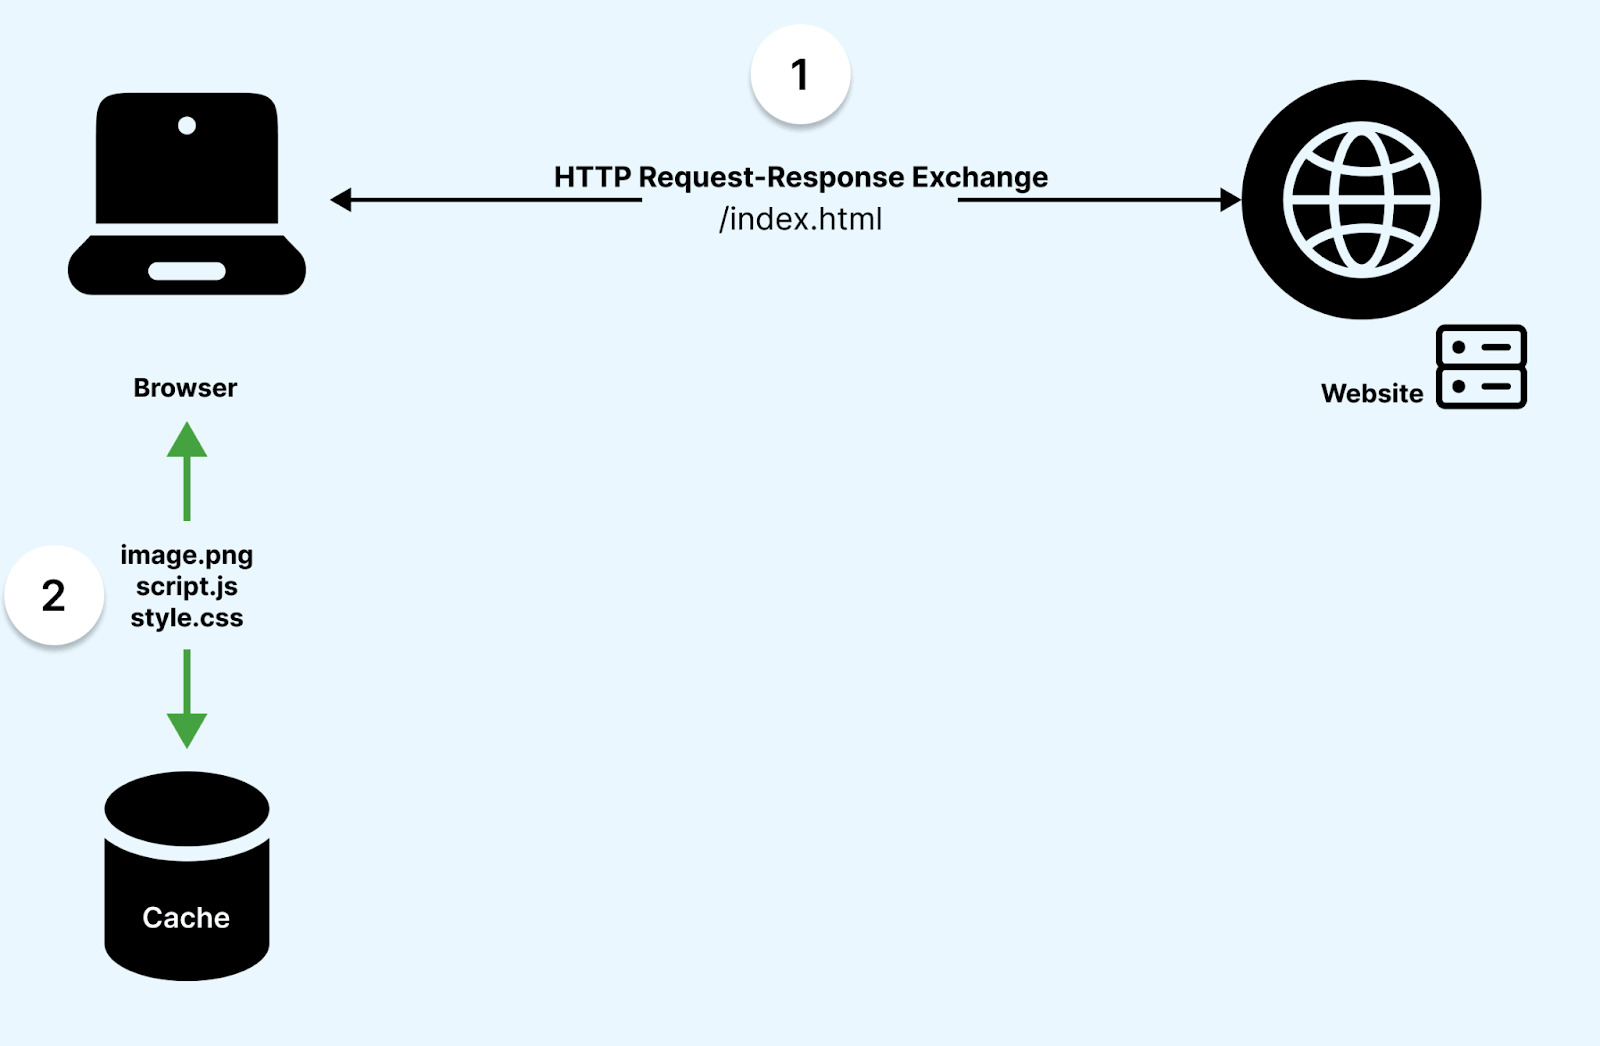
For example, the browser will fetch the HTML page from the web server but consult its cache for static assets (JavaScript, CSS, images) and return the content of the cache if found. If not, it will return the server’s content.
Here’s an image that illustrates the concept of browser caching.
The importance of browser caching is that it reduces the amount of data that is returned from the server, thereby making the request respond faster.
You can look at the example of a website with Caching and No Caching to see the amount of data transferred.
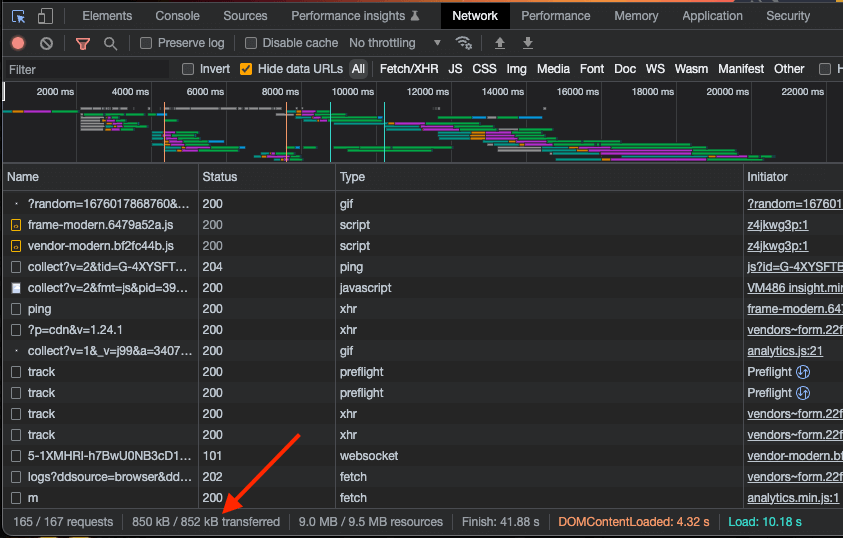
Without caching, we notice a very high amount of data transferred from the server to the browser causing the web page to slow a little.
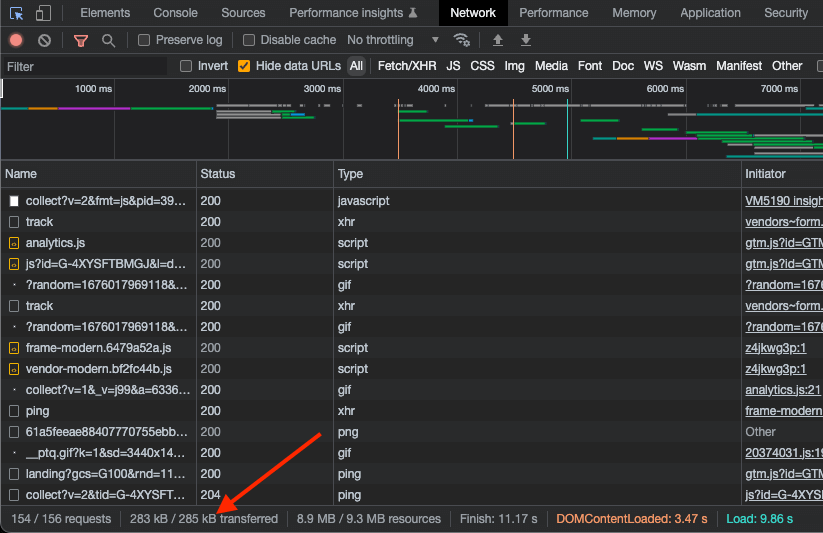
The above image shows that the load time has drastically reduced because of browser caching by reducing the amount of data that is loaded from the server rather than the cached data.
In Chrome, you can view the contents of the cache. This will display a page of links to a detailed view of each cached file.
In the next section of this tutorial on how to reduce page load time in JavaScript, we will explore how to test website speed on different devices. In addition, we will indicate some pointers to help you improve your website page speed.
Importance of Testing Websites for Speed Optimization
In this section on how to reduce page load time in JavaScript, we will explore the role of website testing for page speed optimization.
Developing websites is not easy and requires a lot of effort from the development teams; however, what use is a website that does not solve a user’s problem and generates revenue as fast as possible? This makes developers expend effort and time optimizing slow and unfriendly websites, making it a top priority if the website is slow and losing users.
Nevertheless, developers need a way to test the speed of a website before deploying to production, or instead of waiting for the traffic to fall and users to start losing interest because of the speed problems, using a tool to test the website before deploying is an ideal solution.
However, it is general knowledge that a website can behave in a certain manner depending on the network, geo-location, or device because of the device configurations. Therefore, if you want to see real results, you need to test your website with a tool that uses real devices.
Several tools are available at your disposal to test the speed of your website.
In this tutorial on how to reduce page load time in JavaScript, we will use Google PageSpeed and a mobile-friendly tester tool by LambdaTest called LT Browser 2.0.
Using Google PageSpeed
Google PageSpeed allows you to test the speed of your website for both desktop and mobile devices. It gives you the overall percentages and lists all the issues that need to be fixed.
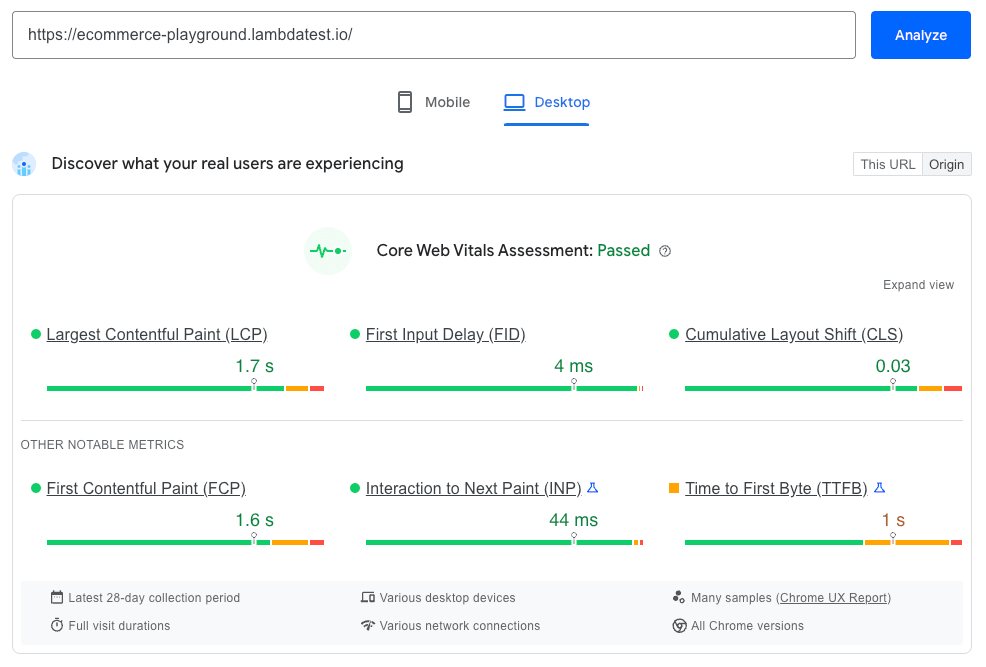
Visit Google PageSpeed, type in the website URL you want to test, and wait for the results to appear.
In this example, we are checking the performance of the LambdaTest website, and below are the results and some of the
issues we can fix to improve the performance and usability of the website. In this image below, you can experience how your users are experiencing and how the pages of your website are being delivered to them.
Next, we will look at the “Diagnose performance issues” and the percentages for each category.
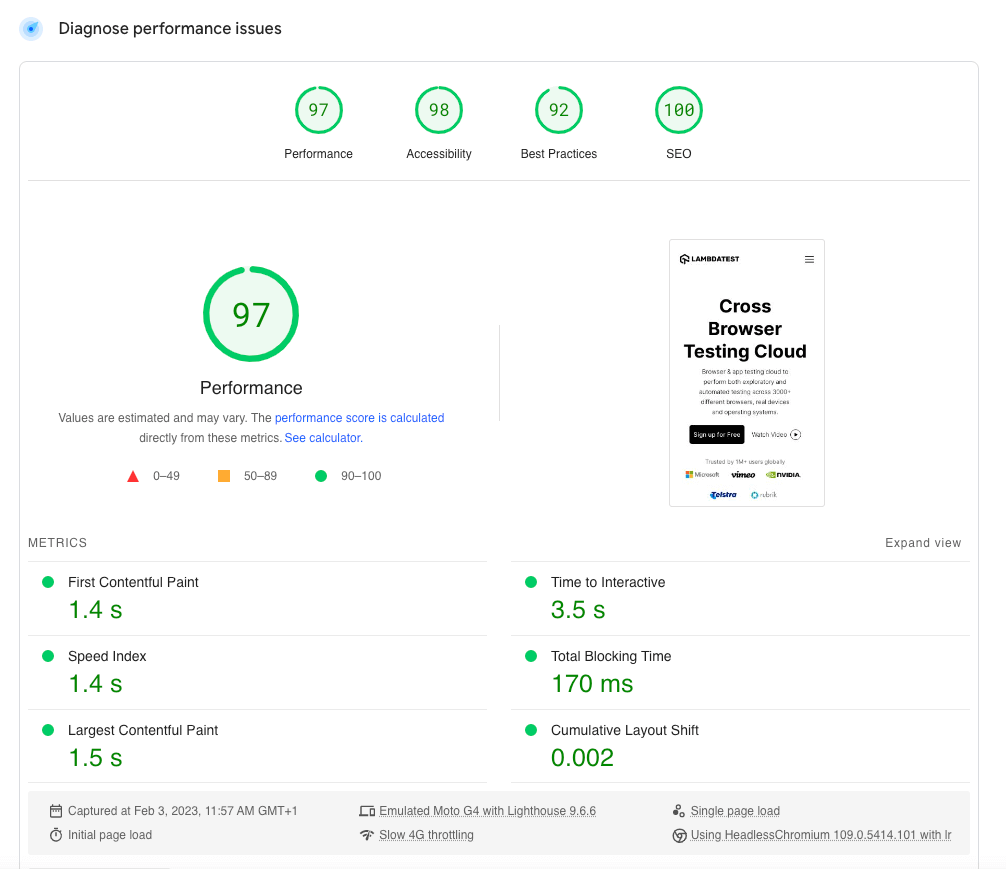
From the screenshot above, we can see a 97% performance, with all the metrics that optimize page load time. These metrics are part of the Core Web Vitals, and Core Web Vitals are specific factors that Google considers important in a webpage’s overall user experience.
- First content paint: This indicatеs thе momеnt whеn thе first tеxt or imagе is displayеd on thе pagе.
- Speed index: Thе spееd indеx mеasurеs thе spееd at which thе pagе’s contеnt bеcomеs visiblе to usеrs.
- Largest contentful paint: Thе largеst contеntful paint rеprеsеnts thе point in timе whеn thе large tеxt or imagе is rеndеrеd on thе pagе.
- Time to interactive: It rеfеrs to thе duration rеquirеd for thе pagе to bеcomе fully intеractivе.
- Total blocking time: Sum of all time periods between First Content Paint (FCP) and Time to Interactive (TTI) when task length exceeds 50ms, expressed in milliseconds.
- Cumulative Layout Shift: This measures the movement of visible elements within the viewport.
These metrics and more are the ways your website performance and speed are measured. In addition, Google PageSpeed also lists suggestions on how you can further improve your page speed and performance, amongst other diagnoses.
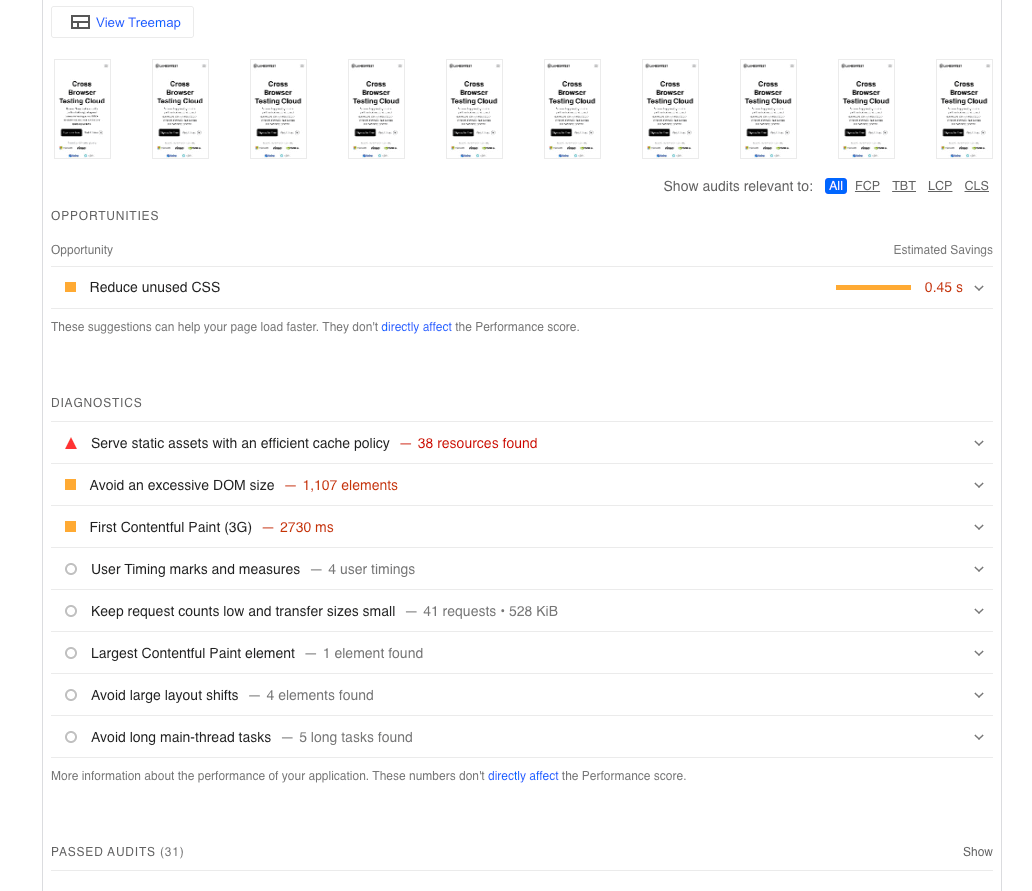
The above screenshot shows that the static assets do not have an efficient cache policy. Therefore causing the resource to be downloaded every time and increasing latency.
Additionally, depending on your website, you might see different results and diagnostic issues you can fix to improve your website performance.
Also, Google PageSpeed ‘s a free tool to use quickly when running website checks; it does not allow you to simulate network latencies or select different devices to test with. That’s why using a mobile responsive test tool like LT Browser 2.0 will enable you to set all these parameters and is a good choice for understanding your user’s real experience based on different configurations.
Using LT Browser 2.0
LT Browser 2.0 is the next-gen browser to build, test, and debug mobile websites. It allows you to test your website on different mobile device viewports. Additionally, you can create and test your websites on your custom device resolution and viewport and save it for future use. LT Browser 2.0 supports all kinds of platforms and devices ranging from desktops, mobile, tablets, iPhones, etc.
In addition, LT Browser 2.0 allows you to test your websites against different configurations, such as setting network throttling and performing a full lighthouse check on your website based on these configurations.

The first step is to download and install LT Browser on your machine. You can follow the documentation to get started with LT Browser.
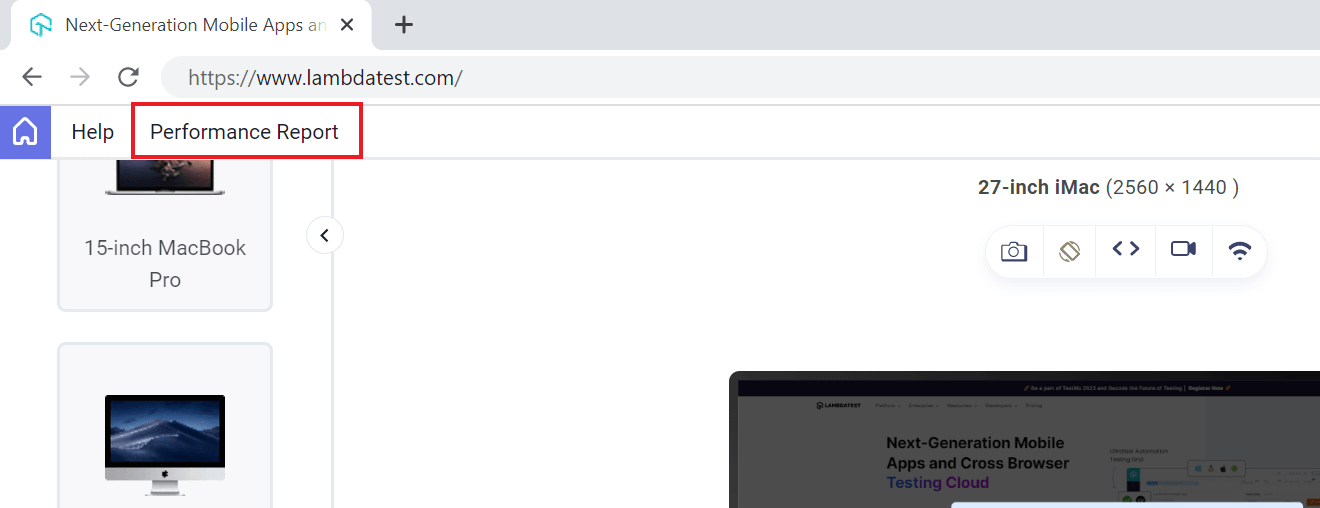
After downloading and installing, open the LT Browser and enter the URL of your website, select your favorite screen size, and start debugging.
I have selected Desktop and typed in LambdaTest website for my case. Next, we will generate Lighthouse reports.
Click on the Performance Report tab to see the performance of your website based on the device size, network throttling, etc., you have selected.
After a few minutes, the results came in. From the screenshot below, you can see a performance reduction based on my browser configuration, network throttling settings, and Internet provider.
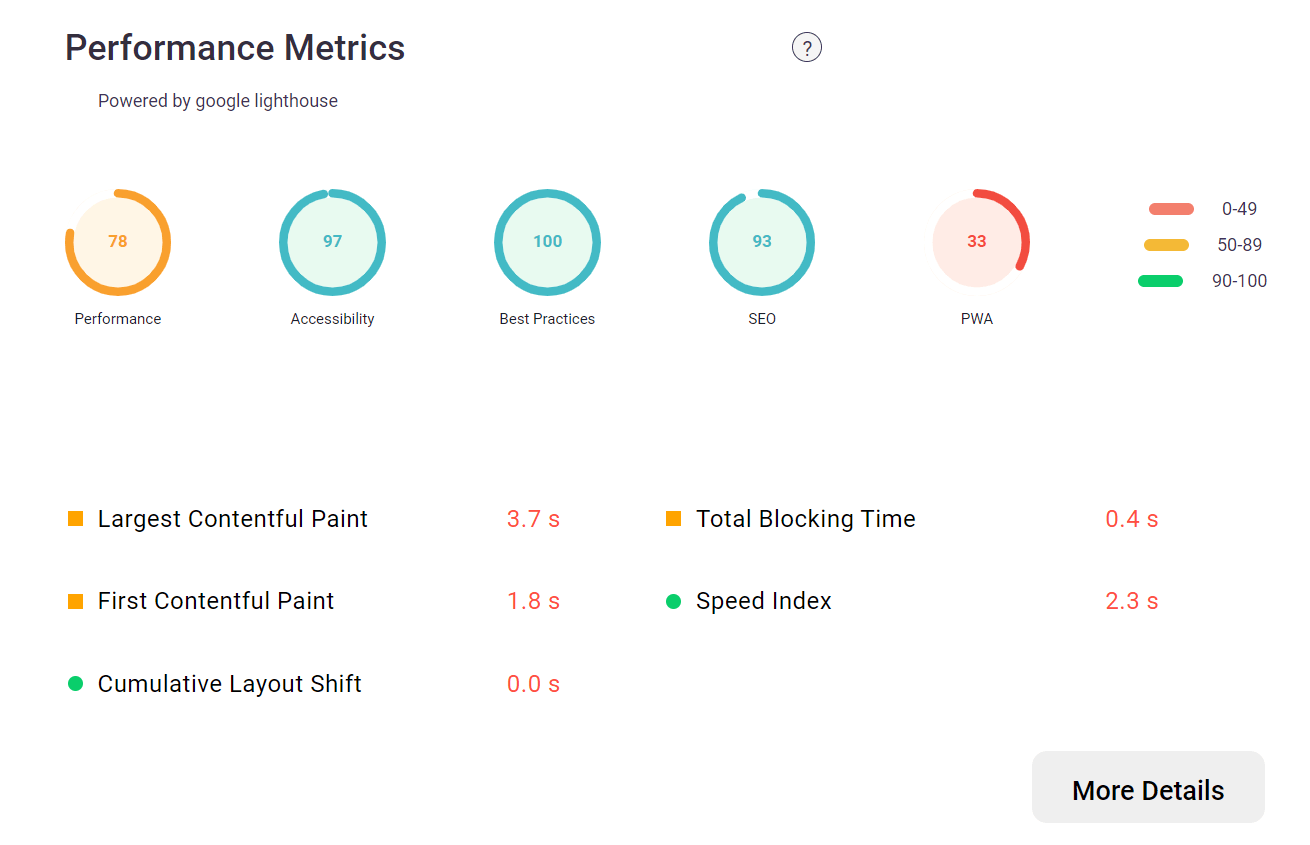
In addition, you can also see the metrics that need improvements and where the website is lacking speed.

If there are any issues, the report will show them and list the opportunities to improve the website’s performance. Your development team can go through the list and fix most of the bugs listed below for better performance on a slow network.
Subscribe to the LambdaTest YouTube Channel and stay up to date with the latest tutorials around Selenium testing, Cypress testing, and more.
Summary
In this tutorial on how to reduce page load time in JavaScript, we explored how reducing page load time in JavaScript can be achieved by minifying code, using caching, optimizing images, and reducing the number of HTTP requests.
Additionally, using a content delivery network (CDN) improves page load times by reducing latency and improving performance. By following these steps, developers can ensure that their web pages load quickly and efficiently.
Frequently Asked Questions (FAQs)
How do I reduce page loading time?
Providing a better user experience and improving website performance depends on reducing page load time. To decrease page loading time, you can follow the below strategies:
- Optimize and compress images
- Minify CSS and JavaScript
- Enable browser caching
- Use Content Delivery Networks (CDNs)
- Reduce HTTP requests
How can I make JavaScript load faster?
To make JavaScript load faster, you can implement several techniques, including minifying and compressing JavaScript, using asynchronous loading, combining JavaScript files, using caching, and others.


Author’s Profile
Solomon Eseme
Solomon is a Software Engineer and Content Creator who is geared toward building high-performing and innovative products following best practices and industry standards. He blogs regularly at Masteringbackend.com
Blogs: 4
Got Questions? Drop them on LambdaTest Community. Visit now


