
16 Top Code Coverage Java Tools [2024]
Sushrut Kumar Mishra
Posted On: March 13, 2024
![]() 191650 Views
191650 Views
![]() 40 Min Read
40 Min Read
Writing code and maintaining code coverage is one of the crucial responsibilities. Developers can identify what part of their code is executed when someone runs the application. It results in increased quality of bug-free codes.
In this article on top code coverage Java tools, we will discuss some of the best code coverage tools available for the Java language.
Before diving in, let us understand what code coverage is and how it is measured. We start with introducing each tool, followed by how to use them in your project, their advantages and disadvantages, and their future scope. In the end, we will compare all these tools based on their style of reports, prices, and other factors, so that you can choose the best tool for your project.
TABLE OF CONTENTS
What is Code Coverage?
Code coverage measures the amount of source code of a software application when it is executed. It is calculated by comparing the number of lines, statements, branches, or functions executed during testing to the total number of elements present in the code.
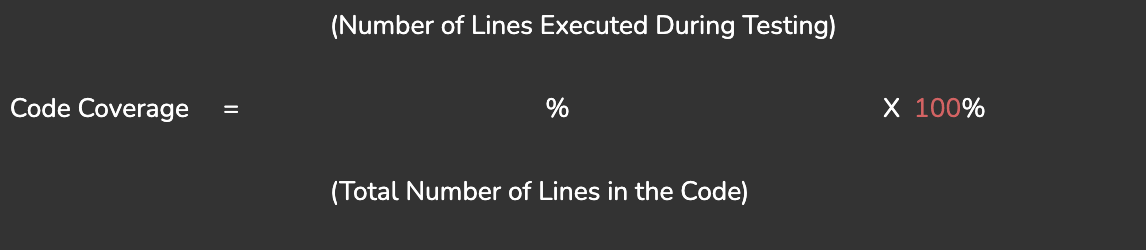
For example, an application consists of 100 lines of code, and during testing, assume that 70 lines of code are executed, then code coverage is 70%.
The number of lines can also be statements, branches, or functions according to the requirement. They are used to measure the amount of bug-free code and generate reports in different forms like HTML, XML, CSV, and PDF, which help developers to identify areas of the code that need improvement. Code coverage also has subsets, like line coverage, statement coverage, branch coverage, and path coverage. Each subset of coverage ensures the quality of a different code aspect and provides insights into the quality of an application.
Why use Code Coverage Tools?
It’s needless to say, how important part of software development is code coverage. It is a trusty companion that helps you ensure your code is functioning exactly as it should. Here are some reasons why code coverage tools are so crucial:
- Code quality: Developers can acquire insights into the quality of their code by measuring the code coverage. Elevated code coverage implies that more code paths have been tested, reducing the possibility of undiscovered errors. Code coverage tools facilitate developers to write testable code, improving code quality and maintainability.
- Untested code: Code coverage tools help determine areas of code that have not been executed during testing. This helps developers to identify portions that may contain undetected bugs. By identifying which parts of the code are untested, developers can create targeted test cases to ensure wide coverage.
- Measure Effectiveness: Tools for measuring code coverage offer metrics for gauging the efficiency of test suites. They can display the proportion of code covered by tests, which shows how effectively the tests exercise the codebase. With the aid of this data, developers may evaluate how thorough their testing was and pinpoint areas that need more testing.
- Testing Priorities: Tools for code coverage can help developers prioritize their testing activities. Developers can more effectively manage resources and ensure that crucial components of the software are adequately tested by concentrating on areas of the code with low coverage. This method reduces risks and aids in early bug detection.
Many people, including testers and developers, use code and test coverage synonymously. But while these terms are closely related, there are still some differences. you can read more depth code coverage vs test coverage.
Code coverage is a non-negotiable step in the software development life cycle(SDLC), and you need code coverage tools to check your code thoroughly. Hence, it’s evident that you need to use code coverage tools. Let’s discuss some of the code coverage Java tools.
Best Code Coverage Java Tools
Code coverage Java tools play a vital role in software development by providing beneficial insights into the effectiveness of testing efforts. Several code coverage Java tools allow developers to analyze the extent to which their code is being tested. Here are a few popular ones:
1. JaCoCo
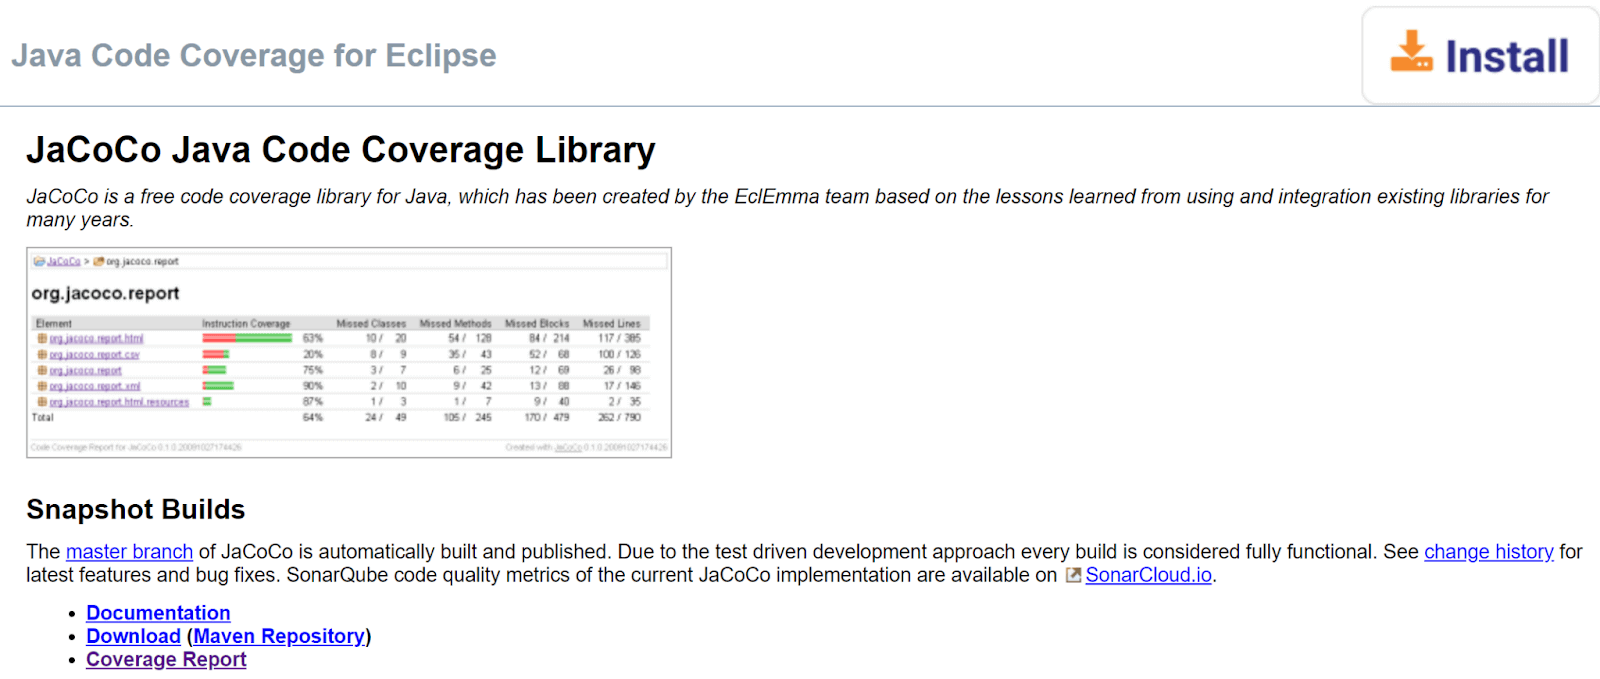
JaCoCo is the most widely used code coverage Java tool, which provides detailed information on the application code coverage. It can be used with various IDEs, build tools, and continuous integration servers.
It also supports instruction coverage, line coverage, branch coverage, and method coverage. JaCoCo is a powerful code coverage Java tool that can help you achieve exceptional software quality. It is the go-to tool for Java developers who want to ensure their code is of the highest caliber because of its advanced features.
And let’s not forget JaCoCo’s exceptional burstiness – its ability to produce sentences of varying lengths and complexity. From concise summaries to in-depth analyses, JaCoCo’s code coverage reports are unparalleled.
So whether you’re a seasoned Java developer or just starting, JaCoCo is the perfect tool to help you achieve your coding goals. With its advanced features of powerful reports and exceptional burstiness, JaCoCo is sure to take your code coverage to the next level.
Run your Java automated scripts on 3000+ browser environments. Try LambdaTest Now!
How to use JaCoCo?
To use JaCoCo as a code coverage Java tool in your project, you can download the JaCoCo plugin for your IDE or build tool. For example, using Eclipse, you can install the JaCoCo plugin from the Eclipse Marketplace. Once the plugin is installed, you can configure your project to use JaCoCo for code coverage.
Step 1: Install JaCoCo from its official website, or you can add its dependency to your project.
|
1 2 3 4 5 6 |
<dependency> <groupId>org.jacoco</groupId> <artifactId>org.jacoco.agent</artifactId> <version>0.8.7</version> <scope>test</scope> </dependency> |
Step 2: Add the following plugin to your build file, pom.xml file.
|
1 2 3 4 5 6 7 8 9 10 11 12 13 14 15 16 17 18 19 20 21 22 23 |
<build> <plugins> <plugin> <groupId>org.jacoco</groupId> <artifactId>jacoco-maven-plugin</artifactId> <version>0.8.7</version> <executions> <execution> <id>prepare-agent</id> <goals> <goal>prepare-agent</goal> </goals> </execution> <execution> <id>report</id> <goals> <goal>report</goal> </goals> </execution> </executions> </plugin> </plugins> </build> |
And that is all you need, now you can generate code coverage reports using JaCoCo. Now let’s discuss the pros and cons of using JaCoCo as a code coverage Java tool,
Pros of JaCoCo code coverage Java tool:
- JaCoCo is free and open-source.
- Supports different types of coverage, including line coverage, branch coverage, instruction coverage, and method coverage.
- It can be integrated with popular build tools such as Maven and Gradle.
- Provides accurate and reliable coverage reports.
- It generates reports in different formats like HTML, XML, and CSV.
Cons of JaCoCo code coverage Java tool:
- It does not support path coverage, although it supports various other types of coverage.
- It provides limited support for code coverage of multi-threaded applications.
- It has little to no support for distributed testing.
Future Scope:
JaCoCo is actively maintained and updated, so it will likely continue to be a popular code coverage Java tool. There may be improvements to its performance and support for coverage of multithreaded applications.
2. Cobertura
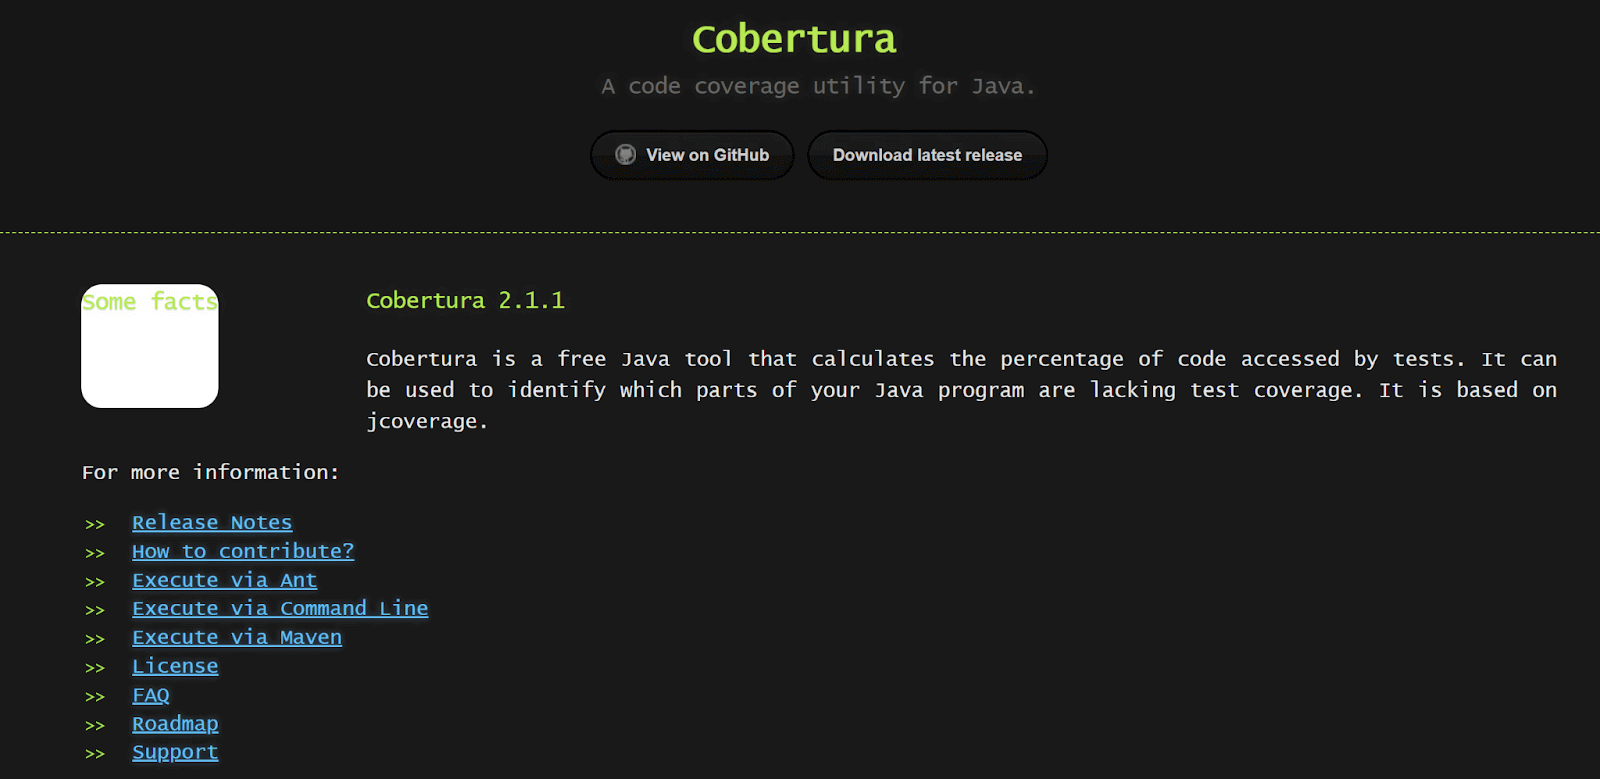
Cobertura is a powerful code coverage Java tool that has gained significant popularity in the software development community. With its ability to track code coverage at a granular level, Cobertura helps developers identify areas of their codebase that may be under-tested and improve the overall quality of their code. It is commonly helpful in complex projects where bugs and errors significantly damage software applications.
The reporting features of Cobertura help developers identify the lines of code that were executed and failed during tests. This information can be used to find code that needs to be tested more and to keep track of how far along the way is a desired percentage of code coverage.
How to use Cobertura?
You can use Cobertura by adding the Cobertura app to your IDE for writing code. If your IDE is Eclipse, you can get the Cobertura tool from the Eclipse marketplace. After installing the tool, you can set up your project so that it uses it for code coverage. Here’s how it works:
Step 1: Add the Cobertura plugin to your project’s POM file.
|
1 2 3 4 5 6 7 8 9 |
<build> <plugins> <plugin> <groupId>org.codehaus.mojo</groupId> <artifactId>cobertura-maven-plugin</artifactId> <version>2.7</version> </plugin> </plugins> </build> |
Step 2: Run the Cobertura plugin from the command line.
|
1 |
mvn cobertura:cobertura |
Step 3: You can check the generated Cobertura report in the below directory:
|
1 |
/target/site/cobertura/index.html |
Cobertura is now set up in your project. Let’s discuss its pros and cons.
Pros of Cobertura code coverage Java tool:
- It provides accurate code coverage measurement.
- It is compatible with popular testing frameworks such as JUnit and TestNG.
- It provides detailed coverage reports that show how much of your code is executed.
- It can measure coverage for lines, branches, and methods.
- Easy to use and integrate with Maven-based projects.
Cons of Cobertura code coverage Java tool:
- It can slow down the test execution process due to the bytecode instrumentation.
- Does not measure functional testing or performance testing.
- It can be difficult to configure for non-Maven projects.
- Cobertura may not always provide complete coverage analysis. There may be some situations where code is not adequately instrumented, or certain types of code are not detected by the tool, which can result in inaccurate or incomplete coverage reports.
- It only supports Java-based applications for coverage analysis.
Future Scope:
Cobertura is a mature code coverage Java tool many companies have used over the years. However, there is always a place for improvement, no matter how perfect the tool is. Some areas where Cobertura could be improved:
- Support for non-Maven projects.
- Integration with more testing frameworks.
- Better support for measuring coverage of multi-threaded code.
- Improved performance during test execution.
3. Emma
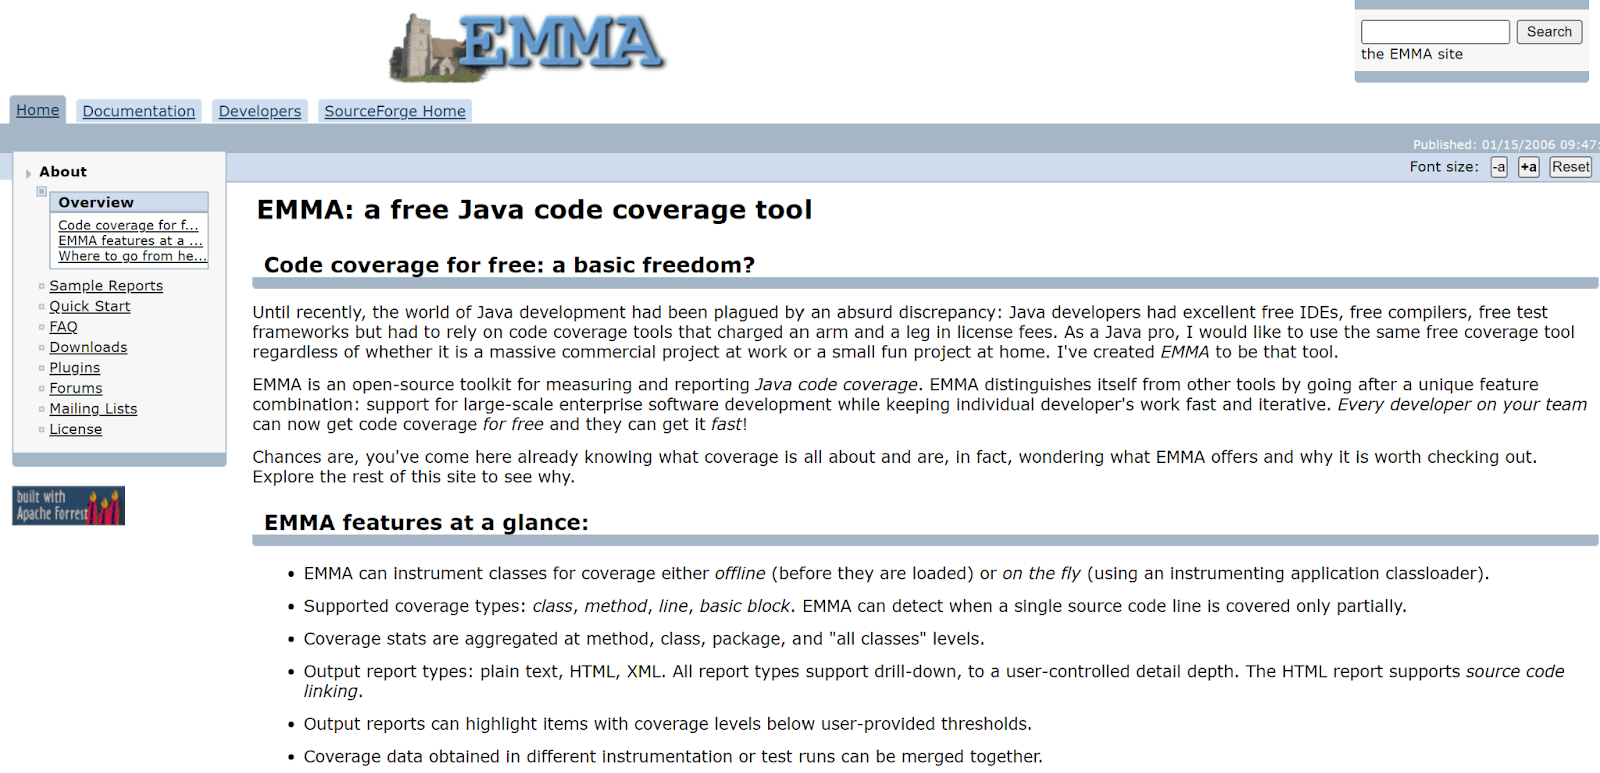
Emma is a powerful and widely used code coverage Java tool that helps developers and software engineers to measure the effectiveness and completeness of their software testing efforts.
It enables developers to detect and eliminate bugs in their code, as it always delivers high-quality software products. This innovative tool has a cutting-edge algorithm that analyzes the code and identifies areas that need more testing and improvement, allowing developers to focus their efforts on those critical areas.
Furthermore, Emma provides comprehensive reports that give developers insights into the overall quality of their codebase, enabling them to make informed decisions and take corrective actions where necessary.
With its exceptional accuracy and reliability, Emma has become popular among developers worldwide. Apart from Java language, Emma also supports other programming languages with different forms of coverage reports.
How to use Emma?
Step 1: To use Emma, first, you need to add this plugin to your pom.xml file.
|
1 2 3 4 5 6 7 8 9 10 11 12 13 14 15 16 17 18 19 20 21 22 23 24 25 26 |
<build> <plugins> <plugin> <groupId>org.codehaus.mojo</groupId> <artifactId>emma-maven-plugin</artifactId> <version>2.1.5320</version> <configuration> <classpathPrefix>${basedir}/src/main/java</classpathPrefix> </configuration> <executions> <execution> <phase>test</phase> <goals> <goal>instrument</goal> </goals> </execution> <execution> <phase>test</phase> <goals> <goal>report</goal> </goals> </execution> </executions> </plugin> </plugins> </build> |
Step 2: Compile your code with Emma.
|
1 |
javac -cp emma.jar MyClass.java |
Step 3: Run your code with Emma.
|
1 |
java -cp .:emma.jar -javaagent:emma.jar MyClass |
Step 4: Generate the coverage report.
|
1 |
java -cp emma.jar emma report -r html -in coverage.em,ma -sp src -sp test -in coverage.em,ma |
Pros of Emma code coverage Java tool:
- Emma is easy to use and configure, which makes it a popular choice for developers.
- Emma provides a detailed report showing the coverage of each class and method, making it easy to identify areas of your code that need more testing.
- Emma integrates with popular build tools like Maven and Ant.
- It is free and open-source.
Cons of Emma code coverage Java tool:
- Emma’s report generation can be slow for large codebases.
- Emma’s bytecode instrumentation can sometimes cause issues with code that relies heavily on reflection.
Future Scope:
Emma is a mature and stable code coverage Java tool that has been used for many years. Some potential areas for the future development of Emma are mentioned below.
- Better integration with modern development tools like IntelliJ Idea and VSCode.
- Provide improved support for multi-threaded code, which makes Emma stand out among others.
- More advanced reporting and visualization options.
4. OpenClover
OpenClover is a powerful code coverage Java tool designed for software developers and testers to ensure the quality of their code. It provides valuable insights into the codebase by measuring the percentage of code executed during testing. OpenClover can identify areas of code that have not been tested and pinpoint potential bugs and defects that may exist in your software applications.
It has gained significant popularity among developers due to its ability to provide comprehensive coverage reports and visualize the coverage data in a user-friendly manner. Along with the Java programming language, OpenClover supports other languages like Java, Groovy, Kotlin, and more, making it a more versatile tool.
OpenClover is compatible with popular software building tools like Jenkins, Bamboo, and Eclipse. Developers can seamlessly integrate code coverage testing with OpenClover into their existing workflows. Features of OpenClover, like its user-friendliness, wealth of valuable data, and comprehensive code coverage analysis, make it one of the most reliable choices. If you’re looking for an efficient and effective code coverage Java tool, OpenClover is worth considering.
How to use OpenClover?
Step 1: Download and install the OpenClover plugin in your IDE. It supports various IDEs such as Eclipse, IntelliJ, and NetBeans. You can download the plugin from the Atlassian website or your IDE’s plugin repository.
Step 2: In your pom.xml file, add the OpenClover plugin to the build section and configure it to use your testing framework.
|
1 2 3 4 5 6 7 8 9 10 11 12 13 14 15 16 17 18 19 20 21 22 |
<build> <plugins> <plugin> <groupId>com.atlassian.maven.plugins</groupId> <artifactId>maven-clover2-plugin</artifactId> <version>4.0.6</version> <configuration> <testFailureIgnore>true</testFailureIgnore> <testFramework>JUNIT4</testFramework> </configuration> <executions> <execution> <goals> <goal>instrument</goal> <goal>test</goal> <goal>clover</goal> </goals> </execution> </executions> </plugin> </plugins> </build> |
Step 3: Once you have configured your project, you can run your tests as usual. OpenClover will instrument your code and generate coverage reports.
Pros of OpenClover code coverage Java tool:
- OpenClover provides detailed reports that show which lines of code are executed during testing.
- It integrates well with other Atlassian tools such as JIRA, Bamboo, and Bitbucket
- OpenClover allows developers to customize their reports by including/excluding certain files or classes from the report, highlighting coverage thresholds, and more.
Cons of OpenClover code coverage Java tool:
- It is not free. However, it also offers a free trial period, and Atlassian also provides discounts for academic institutions and non-profit organizations.
- OpenClover’s code instrumentation technique adds additional code to the source code, which can increase the size of the compiled code and slow down the build process.
Future Scope:
OpenClover has been around for a long time, and many people use it. Atlassian keeps working on the product and making it better. Recent changes have focused on making it easier to use with other Atlassian tools and working better with newer versions of Java. The latest version of OpenClover, version 5.7.2, was released in December 2021.
Looking to the future, code coverage Java tools still have room for improvement. OpenClover could probably do a better job of supporting more testing tools. JUnit and TestNG frameworks are currently the most popular frameworks supported. Performance is another area that could be better.
5. SonarQube

SonarQube is a widely used code coverage Java tool that helps software developers ensure code efficiency and improve the general speed of the software. SonarQube’s ability to give developers comprehensive detail about code coverage is one of its most important features. This helps developers find and fix problems and loopholes in their code.
It is a perfect code coverage Java tool for developers working on complex projects or large-scale apps. It has features like real-time analysis, custom screens, and advanced reports, which help developers break down their complex projects and measure code coverage in chunks.
This makes it a flexible and valuable tool for any software development team. SonarQube also has an easy-to-use interface that lets writers quickly and easily move around in their code and find problems.
How to use SonarQube?
To use SonarQube as a code coverage Java tool in your application, you need to download and install it on your machine. Follow the steps below:
Step 1: Download SonarQube from the official website. Once you download SonarQube, open the installation file and follow the installation instructions to set up SonarQube on your machine.
Step 2: Once SonarQube is installed on your machine, you can create a new project in the SonarQube dashboard.
Step 3: After creating the project, you must configure it to run the code coverage analysis. You’ll need to add the SonarQube plugin to your build tool to do this. If you’re using Maven, you can add the following configuration to your pom.xml file:
|
1 2 3 4 5 6 7 8 9 |
<build> <plugins> <plugin> <groupId>org.sonarsource.scanner.maven</groupId> <artifactId>sonar-maven-plugin</artifactId> <version>3.6.0.1398</version> </plugin> </plugins> </build> |
Step 4: Run the analysis.
Once your project is configured, you can run the code coverage analysis by executing the following command in your project directory:
|
1 |
mvn sonar:sonar -D sonar.host.url=<SonarQube server URL> |
Pros of SonarQube code coverage Java tool:
- Provides a comprehensive dashboard that shows code coverage and other metrics more efficiently.
- Supports various programming languages and can be used in various development environments.
- It can be integrated with popular build tools like Maven and Gradle.
Cons of SonarQube code coverage Java tool:
- SonarQube may not give apt results for large datasets.
- The tool may require significant resources to run on larger codebases.
- Setting up and configuring SonarQube may require some technical expertise.
Future Scope:
SonarQube is constantly evolving and improving. Some of the upcoming features include improved GitHub integration and other version control systems, enhancements to the code analysis algorithms, and new visualization tools for displaying code quality metrics.
6. JMockit
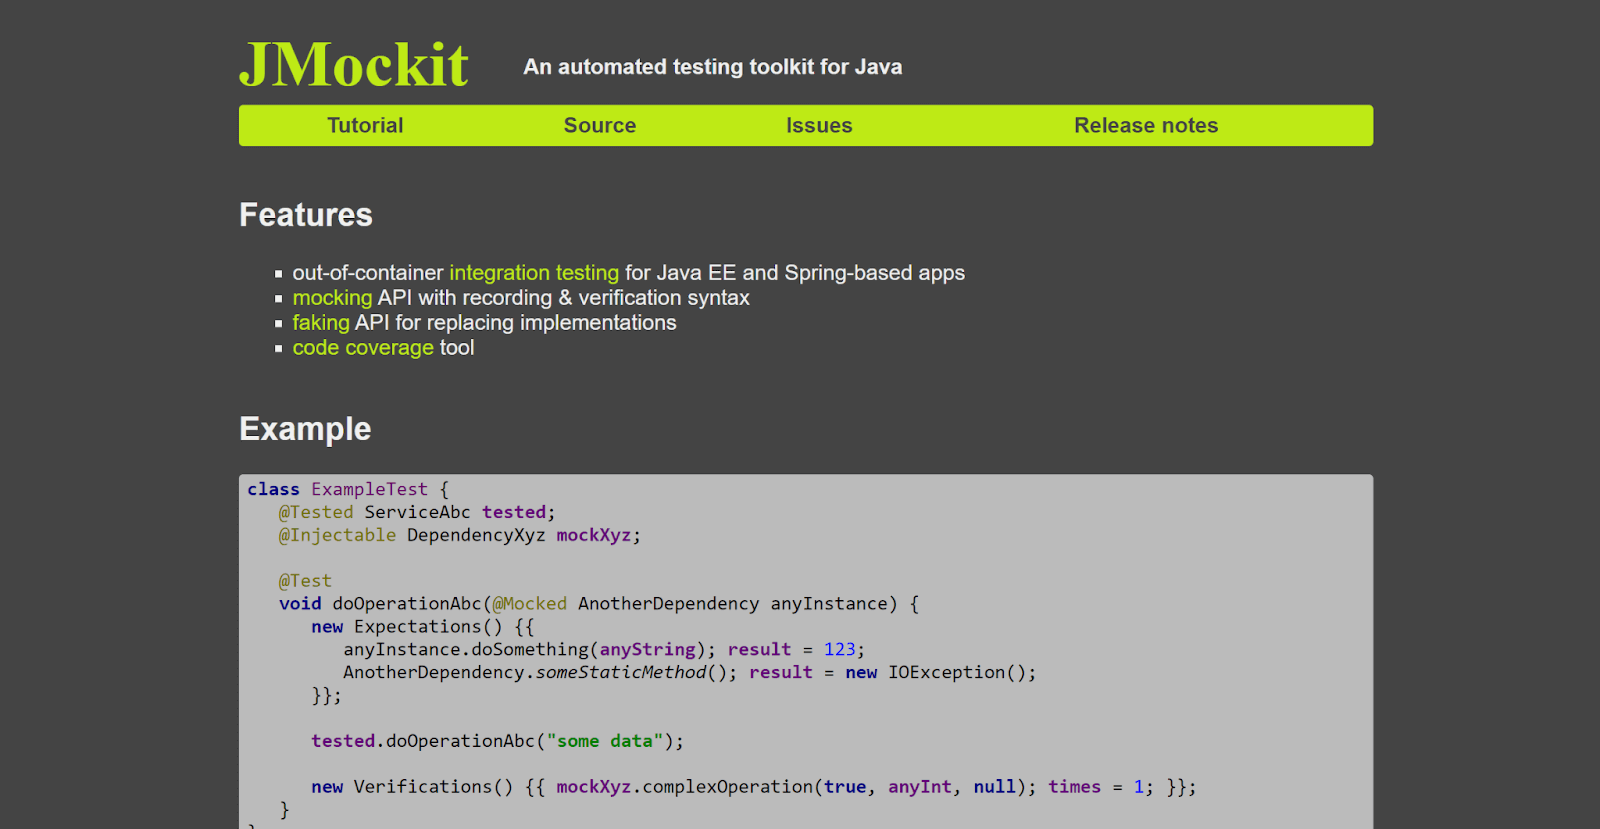
JMockit is a game-changing code coverage Java tool that offers developers incredible freedom and endless possibilities. This powerful tool is handy for testing complex Java applications due to its advanced coverage measurement and mocking/stubbing capabilities.
Additionally, it is open-source, and developers can easily customize it to fit their unique needs and preferences.
JMockit’s ability to measure code coverage in different chunks for test methods or scenarios sets it apart. This feature allows developers to focus on the areas of their code that need the most work. With other code coverage Java tools, it can be tough to identify specific parts of code that require fixing. But with JMockit, developers can easily pinpoint the areas that need improvement and make their code the best it can be.
How to use JMockit?
To use JMockit, you can download the latest version of the JMockit library from the official website or Maven Central.
Step 1: Add this dependency to your pom.xml file.
|
1 2 3 4 5 6 |
<dependency> <groupId>org.jmockit</groupId> <artifactId>jmockit-coverage</artifactId> <version>1.23</version> <scope>test</scope> </dependency> |
Step 2: Run your tests.
|
1 2 3 4 5 6 7 8 9 10 11 12 13 |
@RunWith(JMockit.class) public class MyTestClass { @Test public void myTest() { // your test code here } @Test public void myOtherTest() { // your other test code here } } |
Step 3: After running your tests with JUnit, you can generate a coverage report using the following command
|
1 |
java -javaagent:jmockit.jar=coverage=.* MyClassTest |
Here are some of the pros and cons of JMockit:
Pros of JMockit code coverage Java tool:
- Offers granular code coverage measurement, i.e., measure code coverage for specific test scenarios.
- Provides powerful mocking and stubbing capabilities, which can help developers test complex code scenarios in isolation.
- As an open-source tool, JMockit is freely available and can be customized to suit the needs of a project.
- Actively maintained and updated, ensuring it remains a relevant tool for modern Java development.
Cons of JMockit code coverage Java tool:
- JMockit isn’t as widely used or supported as other code coverage Java tools.
- May not offer the same level of performance or speed as other coverage tools, which could be a concern for large codebases or complex testing scenarios.
- Its advanced features and capabilities may require a steeper learning curve than other code coverage Java tools, which could be a potential disadvantage for developers new to testing or development.
Future Scope:
JMockit coverage seems to have a bright future ahead as it keeps evolving and adapting to the changing needs of Java developers. The tool has a lot of potential areas where it could be developed in the future.
For instance, it could be integrated with Continuous Integration and Continuous Delivery (CI/CD) pipelines to make code coverage measurement automatic during build and deployment processes. Also, if it has better visualization and reporting capabilities, it would be easier for developers to understand their code coverage data. While JMockit currently focuses on Java development, there’s a chance it could expand its capabilities to support other programming languages and frameworks in the future.
7. NCover
NCover is another code coverage Java tool for developers, which helps them focus on their code quality. It provides advanced features like a user-friendly interface, code test optimization, and identifying potential issues.
One of the primary strengths of NCover is its ability to provide users with detailed insights into their code coverage metrics at various levels, such as classes, methods, and individual lines of code. This level of granularity enables developers to identify areas where their code coverage may be lacking and make improvements to their test suite accordingly.
NCover integrates seamlessly with popular Java development environments like Eclipse, IntelliJ, and NetBeans, allowing developers to incorporate code coverage analysis into their existing workflow easily. Additionally, the software supports a wide range of automation testing frameworks, including JUnit, TestNG, and Cucumber, making it highly versatile and adaptable to individual user needs.
How to use NCover?
To use NCover as a code coverage Java tool in your application, you need to follow the steps below:
Step1: Add the NCover dependency. The first step is to add the NCover dependency in your Build Configuration Maven (pom.xml):
|
1 2 3 4 5 |
<dependency> <groupId>com.ncover</groupId> <artifactId>ncover</artifactId> <version>3.4.18</version> </dependency> |
Step 2: After adding the dependency, you need to configure the NCover plugin in your pom.xml.
|
1 2 3 4 5 6 7 8 9 10 11 12 13 14 15 16 17 |
<build> <plugins> <plugin> <groupId>com.ncover</groupId> <artifactId>ncover-maven-plugin</artifactId> <version>3.4.18</version> <executions> <execution> <phase>test</phase> <goals> <goal>coverage</goal> </goals> </execution> </executions> </plugin> </plugins> </build> |
Step 3: Now you have configured NCode into your project, run your tests and analyze your coverage report to identify which parts of your codebase are covered by your tests and which parts are not.
Pros of NCode code coverage Java tool:
- It provides complete insights to code coverage, by allowing developers to identify areas of their source code that are not being tested and optimize their tests accordingly.
- It is highly configurable and helps developers to choose which coverage metrics to measure and which parts of their codebase to exclude from coverage analysis.
- It is compatible with a wide range of development environments, including Java and .NET.
- And obviously, its user-friendly interface makes it easy to use for both beginners and advanced users.
Cons of NCode code coverage Java tool:
- NCover has advanced features, but it can be costly to implement in enterprise applications.
- To use NCover effectively, it requires a significant amount of configurations.
- It may slow down the performance of your tests or applications due to the overhead of collecting coverage data.
Future Scope:
Looking towards the future, NCover is likely to continue to evolve and improve as new technologies emerge and new features are added. Some potential future directions for NCover might include deeper integration with cloud-based testing environments, improved support for mobile and web-based applications, and enhanced reporting and visualization capabilities.
8. Vector Software
Vector Software is another popular code coverage Java tool. Just like all other tools it also helps developers to identify how much of their code is executed and suggests what parts of their code need to be improved.
But what makes it different from other tools is its high degree of burstiness, meaning it quickly analyzes large amounts of code, which save developers valuable time. The tool supports a wide range of programming languages and integrates with various development environments.
Vector Software provides detailed reports on code coverage, allowing developers to identify areas of code that need more attention and gain insight into potential performance issues. The tool is commonly used in industries such as aerospace, automotive, and medical device manufacturing, where software quality is critical to safety and reliability.
How to use Vector Software?
Follow the below steps to have Vector Software as a code coverage tool in your project.
Step 1: Download VectorCAST on your machine from their official website. You can find installation instructions on their website.
Step 2: Open VectorCAST and create a new project. Specify the Java project directory and any additional dependencies or libraries needed to build the code.
Step 3: Configure your Project. You need to specify code coverage options and test cases of your project.
Step 4: Add the VectorCAST Plugin. Add the plugin into your build configuration pom.xml in case you’re using Maven as a build tool.
|
1 2 3 4 5 6 7 8 9 10 11 12 13 14 15 |
<plugins> <plugin> <groupId>com.vectorcast.plugins</groupId> <artifactId>vectorcast-maven-plugin</artifactId> <version>1.0.0</version> <executions> <execution> <phase>test</phase> <goals> <goal>run</goal> </goals> </execution> </executions> </plugin> </plugins> |
It specifies that the plugin should run during the test phase of the build process.
Step 5: Run the Analysis. Select the code coverage analysis option from the VectorCAST menu. It executes your test cases and generates a code coverage report of your application.
You can use this report to identify areas of your Java code that require additional testing and to make informed decisions about code optimization and testing.
Pros of Vector Software code coverage Java tool:
- Comprehensive testing capabilities.
- Easy integration with popular development environments and automated testing tools.
Cons of Vector Software code coverage Java tool:
- Expensive licensing and maintenance costs.
- The steep learning curve for new users.
- Limited support for certain programming languages and environments.
Future Scope:
As software development evolves, Vector Software will likely continue to focus on developing new features and capabilities to support emerging programming languages and frameworks. Additionally, there is likely an increased focus on cloud-based testing and analysis solutions, which can provide scalability and cost-efficiency benefits for large-scale software projects.
9. Testwell CTC++

This is another powerful code coverage Java tool that ensures the reliability and quality of the software. It also helps developers identify the parts of the code which need improvement, just like any other code coverage Java tool.
But what makes it different from other tools is its dynamic analysis and performance profiling. These advanced features provide in-depth insights into their code’s performance and behavior.
Additionally, Testwell CTC++ integrates easily with popular development environments, making the life of a developer easy. Whether you’re developing enterprise software, mobile applications, or web applications, Testwell CTC++ is a powerful tool that can help you ensure the reliability and quality of your code.
How to Use Testwell CTC++?
Step 1: Download the Testwell CTC++ agent from the official website.
Step 2: Now add the downloaded (jar) agent to your project’s classpath.
Step 3: Set up your source code directory and where the output report should be created.
Step 4: Once you have configured it, it’s time to run your tests, and the Testwell CTC++ agent automatically does its job and generates a coverage report.
Here’s an example of how to add the Testwell CTC++ agent to your project’s dependencies using Maven:
|
1 2 3 4 5 |
<dependency> <groupId>com.testwell</groupId> <artifactId>ctc</artifactId> <version>1.0</version> </dependency> |
And here’s an example of how to configure the CTC++ agent in your project:
|
1 2 3 4 5 6 7 8 9 10 11 12 13 14 15 16 17 18 19 20 21 22 23 |
import com.testwell.ctc.CtcConfig; public class Main { public static void main(String[] args) { // Set up CTC++ configuration CtcConfig config = new CtcConfig(); config.setIncludeDirs("src"); config.setCtcOutputDir("ctc_output"); // Enable CTC++ coverage analysis config.enableCoverage(); // Run your tests runTests(); // Generate the code coverage report config.generateReport(); } private static void runTests() { // Your test code goes here } } |
Pros of Testwell CTC++ code coverage Java tool:
- It provides advanced features like dynamic analysis and performance profiling which help developers identify areas of their code that are not being tested.
- Apart from Java, Testwell also supports multiple programming languages, making it a versatile tool for development teams.
- It can be integrated with popular development tools like Jenkins, Visual Studio, and Eclipse.
Cons of Testwell CTC++ code coverage Java tool:
- It is expensive if you have a small team working on a project.
- The setup process of Testwell CTC++ itself can be complex and time-consuming.
- The code coverage reports generated by Testwell CTC++ can be difficult to interpret, especially for developers new to the tool.
Future Scope:
As software development evolves, Testwell CTC++ will likely continue to focus on developing new features and capabilities to support emerging programming languages and frameworks.
In the future, Testwell CTC++ could potentially integrate with other development tools such as GitHub, Bitbucket, and GitLab, providing developers with a more seamless workflow for code coverage analysis.
10. Parasoft Jtest

Parasoft Jtest is a popular code coverage Java tool. Apart from identifying potential bugs, it is comprehensive reporting, and advanced testing is phenomenal.
Using these advanced features, Jtest can help development teams detect and resolve bugs and errors more efficiently. Jtest provides code coverage analysis, static analysis, unit testing, and peer code review capabilities, making it a versatile tool for development teams.
With Jtest, developers can ensure that their code is thoroughly tested and meets the highest quality standards. Whether working on large-scale enterprise applications or smaller projects, Jtest can help developers write better code and deliver higher-quality software.
How to use Parasoft Jtest?
Step 1: Visit Parasoft Jtest’s official website to download and configure Parasoft on your local machine.
Step 2: Once you have installed Parasoft Jtest into your local machine, you can create a new project in the software.
Step 3: Import your source code into the Parasoft Jtest.
Step 4: After importing your code, you can configure the code coverage analysis settings. To do this, go to the “Code Coverage” tab and select the type of coverage analysis you want to perform.
Step 5: Once you have configured the code coverag.
e settings, you can run the analysis. Parasoft Jtest will then analyze your code and provide a report detailing the coverage results.
Make sure you have added the following dependencies to your build file.
|
1 2 3 4 5 6 |
<dependency> <groupId>junit</groupId> <artifactId>junit</artifactId> <version>4.13.2</version> <scope>test</scope> </dependency> |
|
1 2 3 4 5 |
<dependency> <groupId>commons-io</groupId> <artifactId>commons-io</artifactId> <version>2.11.0</version> </dependency> |
Pros of Parasoft Jtest code coverage Java tool:
- It provides not only comprehensive analysis of Java code, but also code coverage, code quality, security, and performance analysis. It helps developers find and fix code issues, leading to better-quality software.
- Parasoft Jtest integrates with popular integrated development environments (IDEs) such as Eclipse and IntelliJ IDEA, making it easy to use for developers.
- Parasoft Jtest allows developers to customize rules and policies to match their specific coding standards, making enforcing best practices easy and ensuring compliance with industry standards.
Cons of Parasoft Jtest code coverage Java tool:
- Parasoft Jtest is a commercial tool with a high cost, making it unaffordable for some small businesses or individual developers.
- Parasoft Jtest has a complex user interface and requires a good understanding of Java programming, making it challenging for beginners to use effectively.
- Parasoft Jtest can be resource-intensive, requiring a powerful computer and significant processing power to run effectively. This can make it difficult to use for developers with older or slower machines.
Future Scope:
The future scope of Parasoft Jtest is promising, as it may evolve to support cloud and container environments, incorporate AI capabilities for more efficient testing and analysis, better integrate with DevOps processes, and provide more robust security analysis capabilities to help developers find and fix security vulnerabilities.
11. Codecov
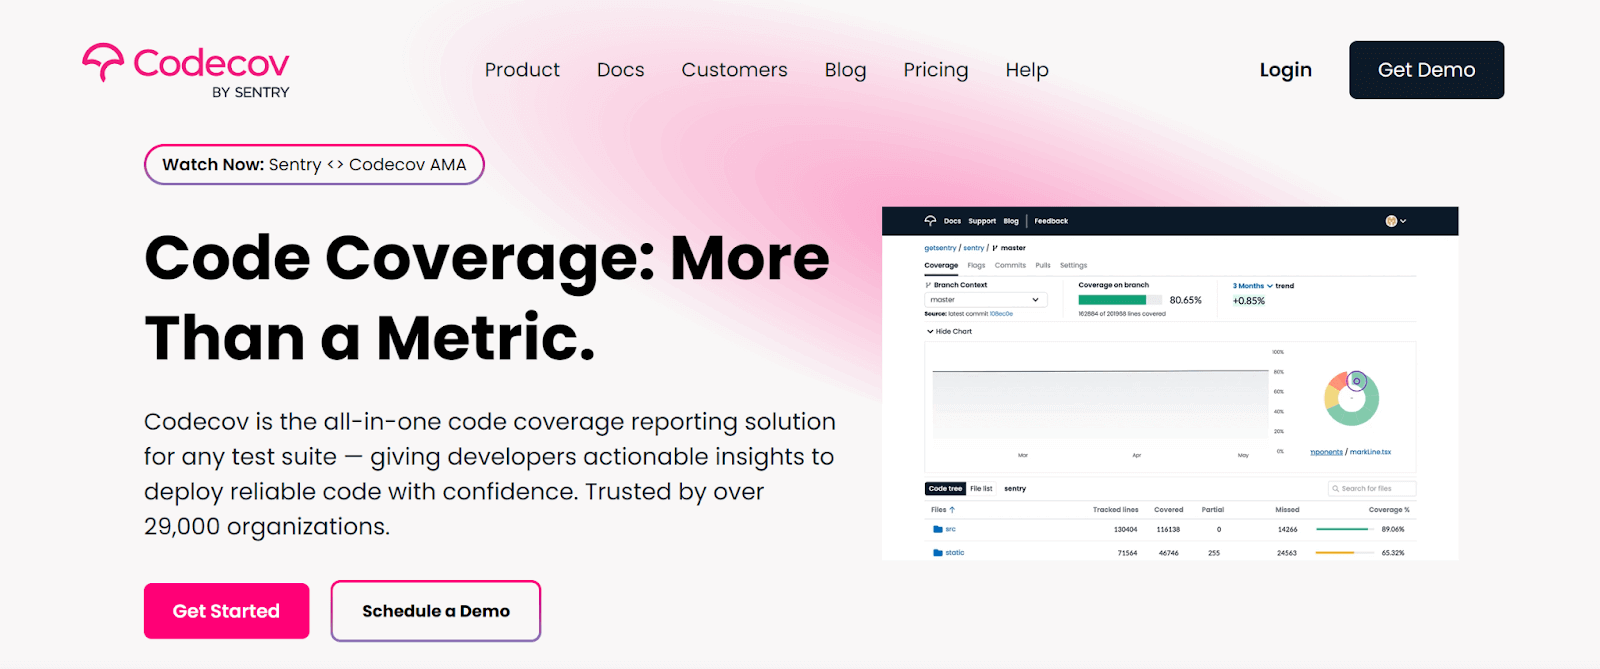
Among software developers, Codecov is a popular code coverage Java tool that measures how much of their code is executed and suggests what parts of their code need to be improved.
Compared to other code coverage Java tools such as JaCoCo and Cobertura, Codecov has several unique features. So the features that make Codecov unique are real time-feedback and multiple integration support.
Real-time feedback on code coverage during the test runs allows developers to identify which parts of their code need more attention quickly.
Integrations with a wide range of popular tools and services, including GitHub, GitLab, and Bitbucket. This makes it easy for developers to incorporate Codecov into their existing workflows and automate their testing processes.
The key component which separates Codecov from other tools is it uses ML algorithms to analyze the code coverage data and provide more accurate insights into code quality, which in turn helps developers to gain a complete understanding of their codebase and identity areas that need to be improved.
It also offers features like generating visually appealing reports and, over time, code coverage.
How to use Codecov?
Step 1: Configure Codecov. Add the Codecov dependency to your build file (pom.xml).
|
1 2 3 4 5 |
<dependency> <groupId>com.codecov</groupId> <artifactId>codecov-maven</artifactId> <version>0.2.13</version> </dependency> |
Step 2: Add a plugin and run your automated tests.
|
1 2 3 4 5 6 7 8 9 10 11 |
<build> <plugins> <plugin> <groupId>org.apache.maven.plugins</groupId> <artifactId>maven-surefire-plugin</artifactId> <version>2.22.2</version> <configuration> <argLine>-javaagent:${settings.localRepository}/org/jacoco/org.jacoco.agent/0.8.2/org.jacoco.agent-0.8.2-runtime.jar=destfile=target/jacoco.exec</argLine> </configuration> </plugin> </plugins> </build> |
This will generate a JaCoCo report in the target/site/jacoco directory.
Step-3: Upload the generated report into JaCoCo or Cobertura using Bash.
|
1 |
bash <(curl -s https://codecov.io/bash) -t <your_token> -f target/site/jacoco/jacoco.xml |
Once all the steps are done, you can analyze your report.
Note: You should make sure to keep your Codecov token secure and not share it publicly.
Pros of Codecov code coverage Java tool:
- Provides a user-friendly interface for visualizing code coverage data.
- Integrates with a wide range of build tools and test frameworks.
- Offers a variety of features such as pull request and branch analysis, coverage diff, and trend reports.
Cons of Codecov code coverage Java tool:
- Requires uploading code coverage reports to the Codecov servers, which may not be desirable for all users.
- Can be expensive for large organizations with many contributors or repositories.
- Limited customization options for reports and analysis compared to other code coverage Java tools.
Future Scope:
In the future, Codecov could continue to expand its integrations with different build tools and test frameworks, making it more accessible to a wider range of developers. Additionally, there is potential for Codecov to improve its analysis capabilities, such as providing more detailed and actionable insights into code quality and test coverage.
12. RKTracer
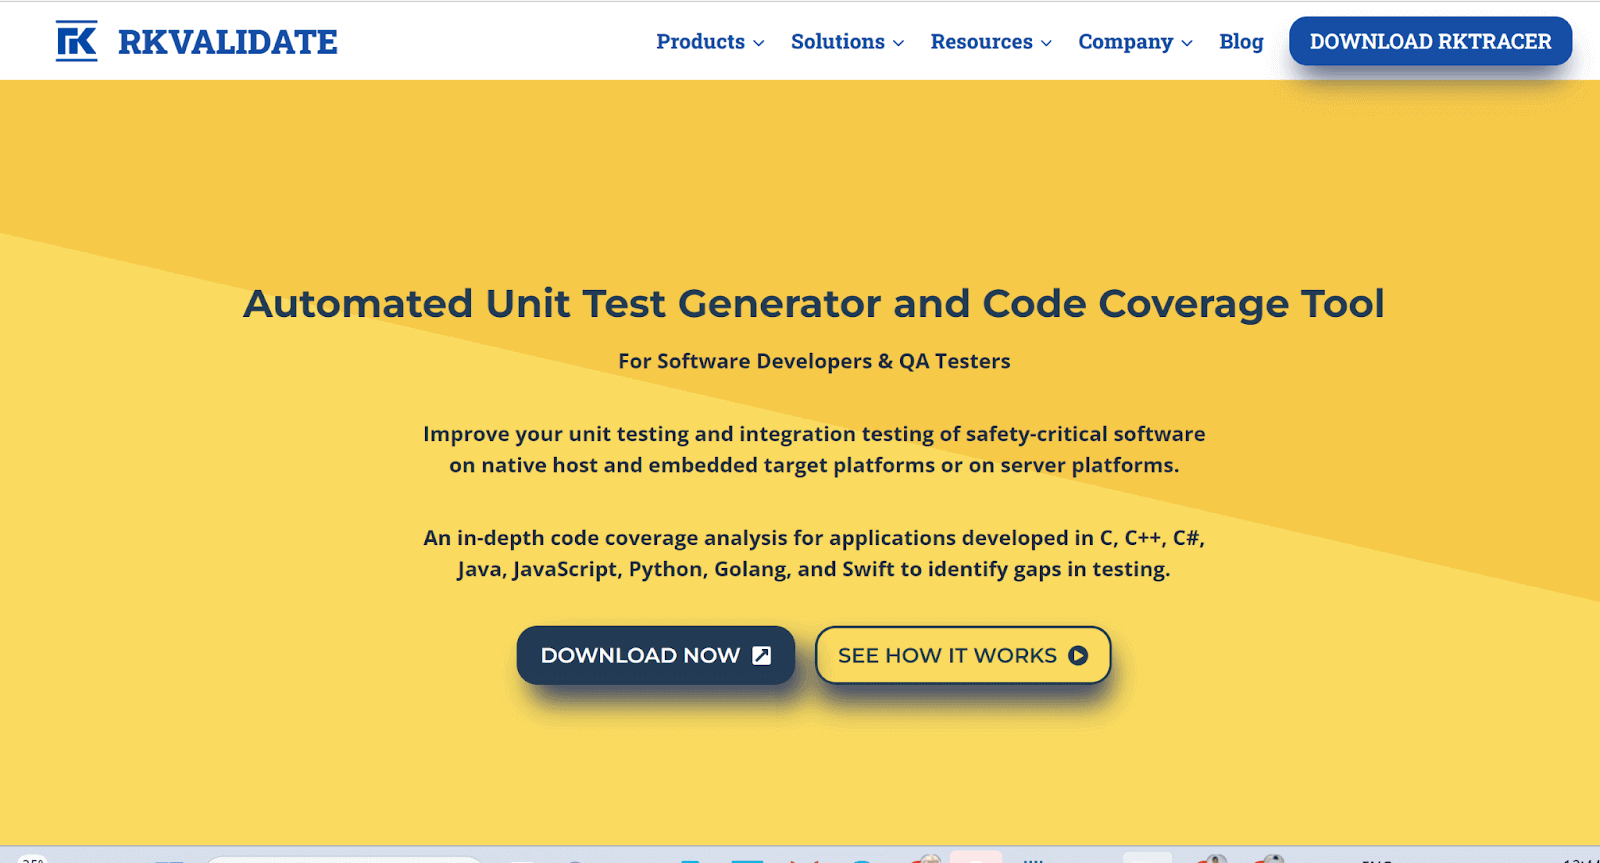
Among software engineers RKTracker is one famous tool for code coverage, and it is a go-to tool for Java developers because it is explicitly designed for Java-based applications. Unlike all other tools, RKTracker uses a unique approach to collect code coverage information, making it a powerful tool.
It uses a technique called “Path Profiling,” which tracks the execution paths of an application. This allows RKTracker to provide more accurate and granular code coverage data than traditional line-based coverage tools, which only measure whether or not a line of code has been executed.
RKTracker can provide a nuanced and detailed understanding of code coverage, helping developers to identify areas where more testing is needed.
How to use RKTracer?
Step 1: Download RKTracker from the official website.
Step 2: You need to add the RKTracker agent into the JVM startup arguments to instrument your Java code.
Step 3: Once the code is instrumented, run your tests.
Step 4: Analyze the code coverage reports.
Note: Due to the collection of path profiling data, it may have a performance impact on your application, so it’s essential to perform performance testing of your application while using RKTracker.
Pros of RKTracker code coverage Java tool:
- It provides detailed code coverage reports covering even minute details.
- Able to integrate with popular Java build tools and development environments to make the setup process easier.
- Can be useful in identifying areas where more testing is needed, helping you improve the quality of your code.
Cons of RKTracker code coverage Java tool:
- Can have a performance impact on your application due to the collection of path-profiling data.
- It requires additional setup and configuration, especially when the project is complex.
- The detailed code coverage reports may be overwhelming for smaller projects or those with limited testing needs.
Future Scope:
As RKTracker primarily focuses on path profiling, it can become a popular code coverage Java tool. In the future, it will continue to develop and refine its features to better meet the needs of developers. Additionally, RKTracker may expand its capabilities to support other programming languages and platforms, increasing its usefulness as a code coverage Java tool.
13. CodeCover
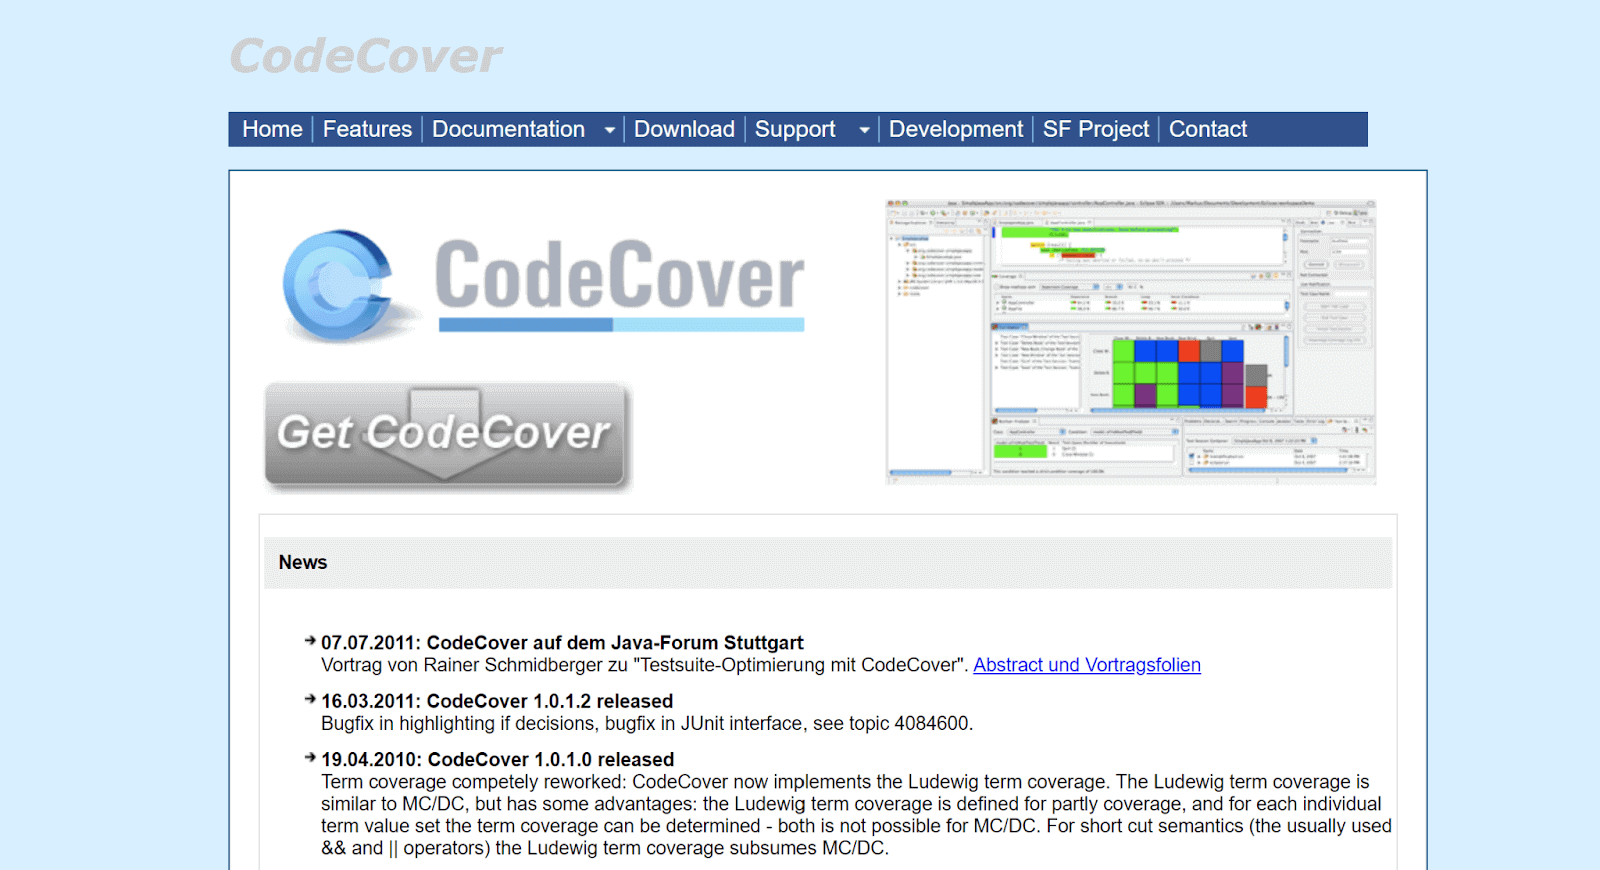
Like other code coverage Java tools, CodeCover analyzes your code and identifies the potential areas that need attention and improvement. It is different from other tools available for Java as it offers advanced features such as support for multi-threaded applications and coverage tracking for web applications.
It is considered unique based on its key feature, which is its ability to support multi-threaded applications. This means that it can accurately track the execution of code across multiple threads, helping developers to identify potential race conditions and other concurrency issues.
One exciting and notable feature of CodeCover is it provides coverage tracking for web applications. This means it can monitor the execution of code triggered by events such as HTTP requests, allowing developers to ensure that their web applications are thoroughly tested.
How to use CodeCover?
Step 1: Get CodeCover. You can download and install it from its official website.
Step 2: Set it up. Tell CodeCover where your source code is located so it can work its magic.
Step 3: Run those tests. Once your CodeCover setup is done, use your favorite Java testing frameworks, like JUnit or TestNG, to run your tests.
Step 4: Open up the generated report in your browser to see how much of your code was covered during testing.
|
1 2 3 4 5 6 7 8 9 10 11 |
import org.junit.Test; import org.junit.runner.RunWith; import org.junit.runners.JUnit4; @RunWith(JUnit4.class) public class MyTestClass { @Test public void myTest() { // your test code here } } |
To generate reports, use Code cover CLI,
|
1 |
java -jar codecover.jar -session mysession -report myreport.xml |
Execute this command and the report will be generated in XML format
which you can view in your web browser using the Code Cover web interface.
Pros of Code Cover code coverage Java tool:
- It provides comprehensive code coverage.
- Because of its user-friendly setup CodeCover is easy to use.
- Provides Multi-threaded support.
Cons of Code Cover code coverage Java tool:
- It has limited language support.
- CodeCover is primarily designed for Windows and Linux platforms, which is unsuitable for other OS platforms.
- It does not integrate with popular IDEs, which can make it less convenient for some developers.
Future Scope:
One of the obvious future scopes of CodeCover is expanding its language support. It may also improve its integration with popular IDEs, making it more convenient for developers.
Also, they plan to integrate ML algorithms to analyze the code more efficiently and discover new insights from the code to yield comprehensive results.
Finally, CodeCover may also consider adding support for other types of code analysis, such as static analysis or code profiling, to improve the quality and reliability of software further.
14.Serenity

All the code coverage Java tools that we have discussed up until now have advanced features that make them unique.
Likewise, Serenity is another code coverage Java tool that provides data driven testing, behavior-driven development, and integration with popular testing frameworks such as JUnit and TestNG, besides providing a comprehensive analysis of test coverage in Java applications.
Behavior Driven Development (BDD) allows developers to write tests in plain English using the Gherkin syntax. This makes it easier for non-technical stakeholders to understand what is being tested and how to improve communication and collaboration within development teams.
Data-driven testing allows developers to test their code using multiple sets of data and to ensure that their code behaves consistently under different conditions. This helps to improve the quality and reliability of the code being tested.
How to use Serenity?
Step 1: Get Serenity. You can download and install it from its official website.
Step 2: Add dependencies to your project’s build file pom.xml in case you are using maven as a build tool.
Sure! Here’s an example of how to add Serenity’s dependencies to your project’s build file using Maven:
|
1 2 3 4 5 6 7 8 9 10 11 |
<dependency> <pId>net.serenity-bdd</groupId> <artifactId>serenity-core</artifactId> <version>2.4.4</version> </dependency> <dependency> <groupId>net.serenity-bdd</groupId> <artifactId>serenity-junit</artifactId> <version>2.4.4</version> </dependency> |
Make sure to update the version numbers to the latest version of Serenity. Also, note that the above example is for Maven. If you’re using a different build tool, the syntax for adding dependencies may be different.
Step 3: Write your tests. Make sure to annotate your tests with the “@Serenity” annotation so that Serenity can track the coverage.
Step 4: Check the report. After running your tests, Serenity will generate a report that shows you the code coverage statistics for your project. You can view the report in your web browser.
Pros of Serenity code coverage Java tool:
- Provides a clear and detailed report of code coverage, making it easy to identify areas that need improvement.
- Ability to integrate with popular testing frameworks like JUnit and TestNG, so you can use the testing framework you’re already familiar with.
- Apart from Java, it supports multiple other languages, which makes it versatile.
Cons of Serenity code coverage Java tool:
- It is complex to set up, especially for large projects.
- Detailed report is an advantage and disadvantage because it can be overwhelming, making it difficult to focus on the most important areas for improvement.
- Serenity’s integration with testing frameworks can sometimes cause conflicts or issues with other dependencies or plugins in your project.
Future Scope:
Looking into the future, Serenity has a promising outlook as code coverage becomes an increasingly important aspect of software development.
Serenity could continue to improve its user interface and expand its language and framework support to increase its reach. Additionally, integrating with other tools and incorporating machine learning could enhance the development process even further.
15. Squish Coco
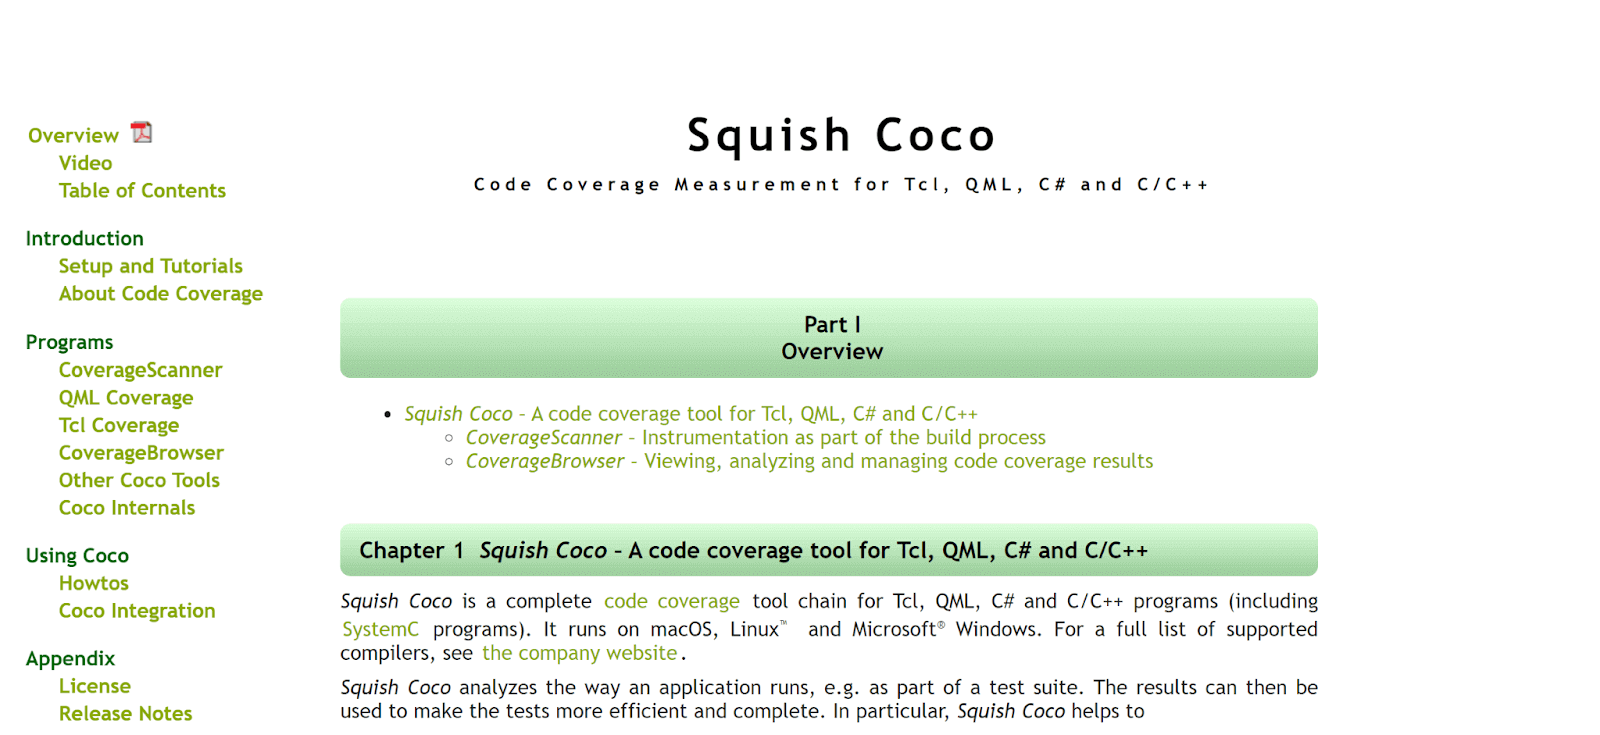
Squish Coco is a code coverage Java tool that aids developers in determining how much of their code has been executed during testing. It operates by instrumenting the code at compile-time by including instructions that keep track of the execution of specific sections of the code.
It records the lines of code that were run during execution and produces reports that display the test coverage. This enables developers to enhance their test suite and guarantee higher code quality by identifying the code areas that are not tested thoroughly.
Pros of Squish Coco code coverage Java tool:
- Squish Coco produces detailed reports on the percentage of code executed and measures code coverage accurately at all application testing tiers.
- Simple to use for developers by integrating with well-known development environments like Eclipse, IntelliJ, and NetBeans.
- Provides an intuitive user interface that makes setting up and configuring code coverage analysis simple.
Cons of Squish Coco code coverage Java tool:
- The programme is not free and requires a license to use, which can be expensive for small teams or individual developers.
- The utility needs a lot of memory and processing power, thus low-end devices might not be able to use it.
- The tool has few reporting options, which might not be enough for big teams or complicated projects.
16. JCov
JCov is a code coverage Java tool that calculates how much of a Java program’s source code is executed during a test run. It aids programmers in determining how much of the code has already been tested and locating any remaining portions. It also alters the bytecode to include new instructions that keep track of the sections of the code executed during the test run.
Pros of JCov code coverage Java tool:
- Find portions of their codebase that are not being thoroughly tested by using JCov’s precise measurement of code coverage.
- JCov integrates seamlessly with JUnit, making it easy to incorporate code coverage analysis into your existing testing workflow.
- It is a lightweight tool that is simple to set up and use.
Cons of JCov code coverage Java tool:
- JCov does not include advanced features like branch coverage or path coverage
- It may not work properly with some Java Virtual Machine (JVM) versions or third-party libraries.
- JCov is no longer being actively maintained, and the community only offers intermittent assistance.
Role of Cloud Testing Platform with Code Coverage Tools
LambdaTest is an AI-powered test orchestration and execution platform that allows you to perform automation testing on an Online Selenium Grid across 3000+ browsers and real devices. It comes with simulations and emulations of devices and gives you a scalable testing framework that lets you do manual and automation testing. With LambdaTest, you can ensure that your web application looks well and responds to all browsers and devices.
You can also Subscribe to the LambdaTest YouTube Channel to get live updates with the latest tutorials around Selenium testing, Cypress testing, CI/CD, and more.
One of the most remarkable features of LambdaTest is its testing on a real device cloud. This feature allows you to test their application in real-time on multiple devices and browsers. It also allow you to perform cross-browser testing, which lets developers test their web applications on multiple browsers and their versions. This ensures that your application runs correctly on different browsers.
Here’s how you can use LambdaTest with code coverage Java tools:
- You can use LambdaTest to run automation tests while integrating code coverage tools like JaCoCo, RKTracer, Serenity, etc. This helps you get detailed reports on code coverage and ensure that your application is thoroughly tested.
- This platform allows you to integrate code coverage tools and helps ensure that your code is being tested on every possible configuration while getting detailed reports on the percentage of code coverage.
In short, LambdaTest provides smooth integration with popular software development and code coverage tools. It helps you ensure that your web application is thoroughly tested on different devices and browsers in real time and provides full coverage.
Conclusion
As already mentioned during the introduction of this blog post, code coverage is one of the most important aspects of software development. It helps individuals and businesses help identify potential issues hiding within the code.
The code coverage Java tools mentioned in this blog post are among the most popular ones. These can assist you in achieving your testing goals by providing you with powerful analysis and reporting capabilities. I’ve also included the pros and cons of each tool to help you make more informed decisions.
However, if you want an all-in-one solution for code coverage, reporting, analytics, cross browser testing, and other testing requirements, LambdaTest is worth considering. With its user-friendly interface and extensive range of features, LambdaTest is a powerful tool that can help you streamline your testing process and improve code quality.
Frequently Asked Questions (FAQs)
Is SonarQube a code coverage tool?
Yes, SonarQube is a free, stand-alone service that measures the quality and coverage of our source code to provide an overview of its overall health.
Why is JaCoCo used?
JaCoCo is an open-source software that may be used to examine the test code coverage of production code. Reports can be produced, and it works well with IDEs like Eclipse IDE. Other IDEs and continuous integration environments can both be integrated.


Author’s Profile
Sushrut Kumar Mishra
Hi, I'm Sushrut, a Developer and a Freelance Technical Writer holding 3+ years of experience in content writing. I help companies and forums grow their business with content creation and developer advocacy.
Blogs: 4
Got Questions? Drop them on LambdaTest Community. Visit now


