16 Tips To Use Chrome DevTools For Cross Browser Testing [2024]
Harish Rajora
Posted On: March 7, 2024
![]() 150961 Views
150961 Views
![]() 15 Min Read
15 Min Read
Google Chrome is the most used browser as of 2024. Google seems to continue to hold its position 1 for at least a couple of years, if not more! Holding the most dominant browser market share makes it an inevitable part of the cross browser testing checklist of every QA manager. One of the most valuable features that have become an indispensable part of every web developer’s and web tester’s daily routing is Chrome Dev Tools.
Being of this importance, it is absolutely necessary for the testers to know how they can leverage Chrome Dev Tools to their full extent and perform better testing. Although developer tools are available in all the major browsers to help their fellow developers debug any cross browser compatibility issues, Google Chrome is always striving to add more features to help professionals get the hang of Chrome Dev Tools more conveniently.
In this post, we will highlight the top 16 tips to use Chrome Dev Tools for cross browser testing. However, if you are just starting out as a web developer or web tester then we will start off with a basic section to help you open the developer tools in your browser.
How To Open The Chrome Dev Tools?
Before working with the different tips for developer tools on Google Chrome, a tester should know beforehand about how to open Chrome Dev Tools. Developer tools in Google Chrome can be accessed by the following methods:
- Open your Google Chrome browser. Go to the website on which you want to debug. Perform a right-click on the screen and go to Inspect.
- Another way to access Chrome Dev Tools is by using the keyboard shortcuts. You can either press Ctrl + Shift + C (Cmd + Option + C) or Ctrl + Shift + J(Cmd + Option + J).
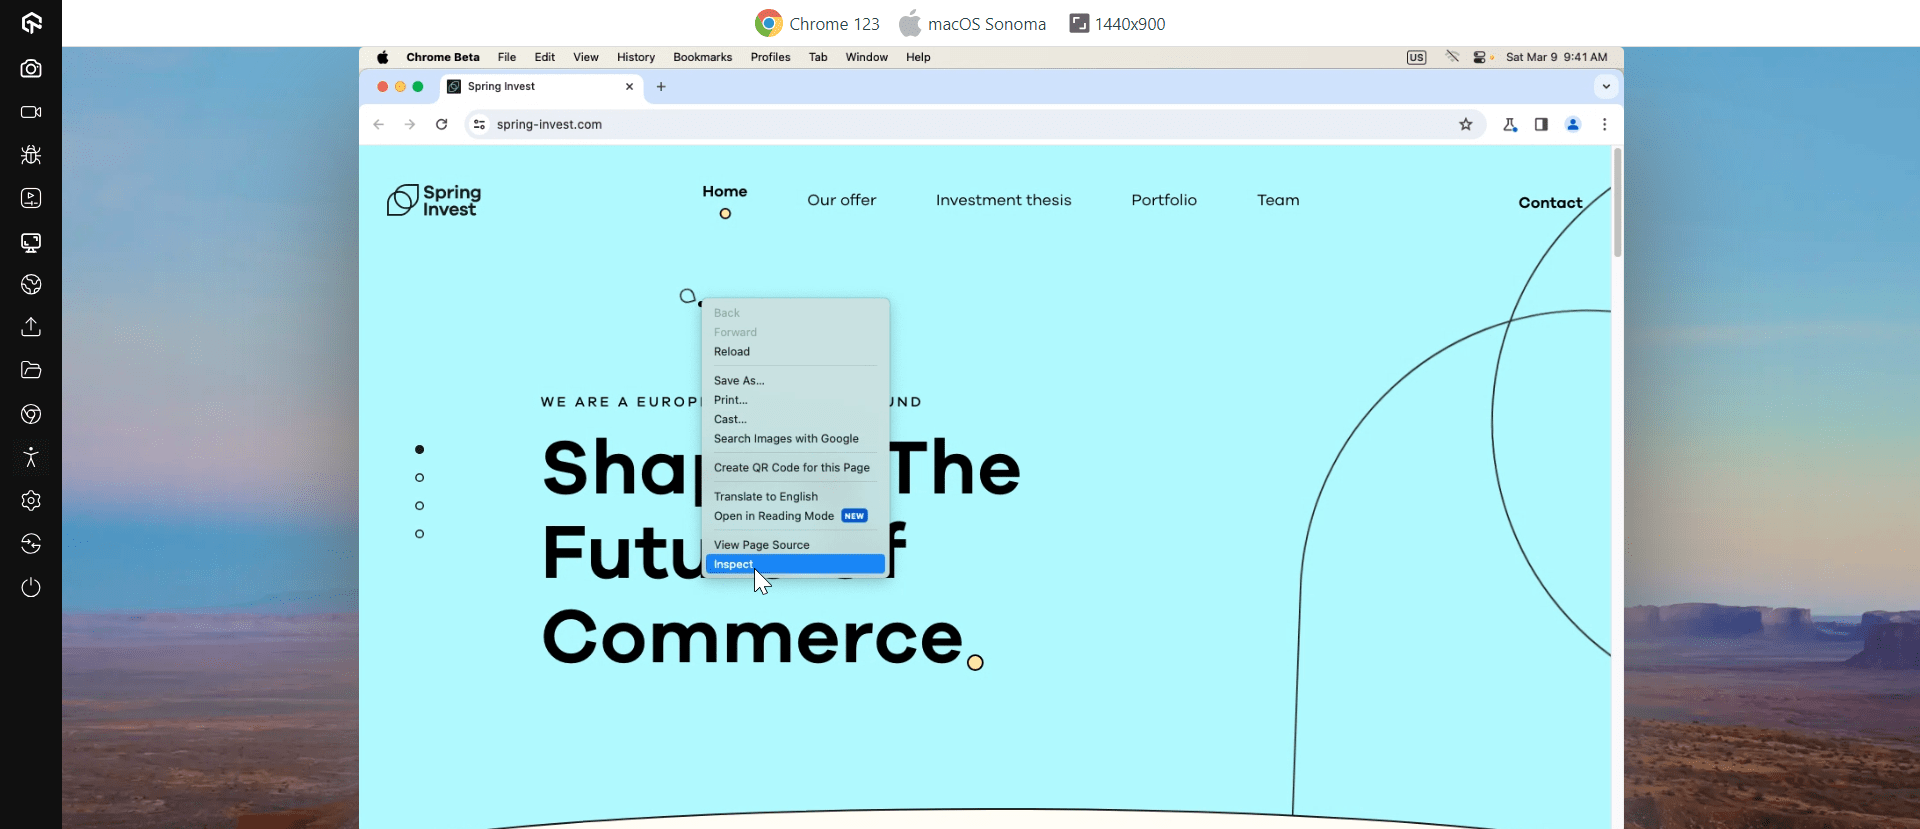
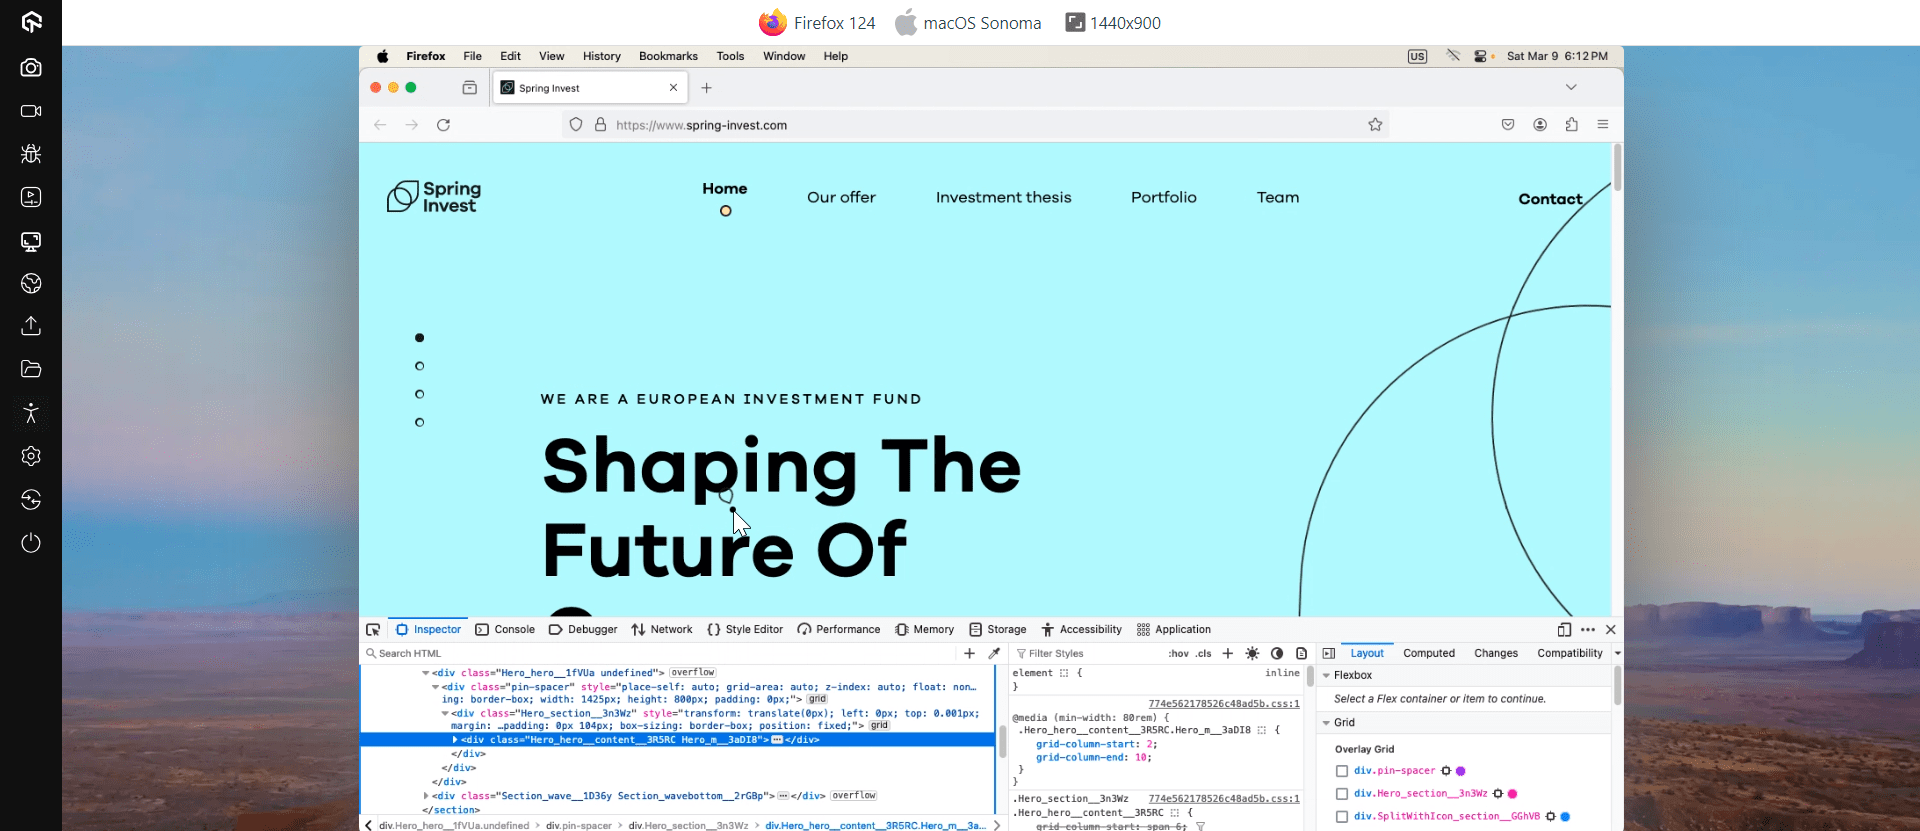
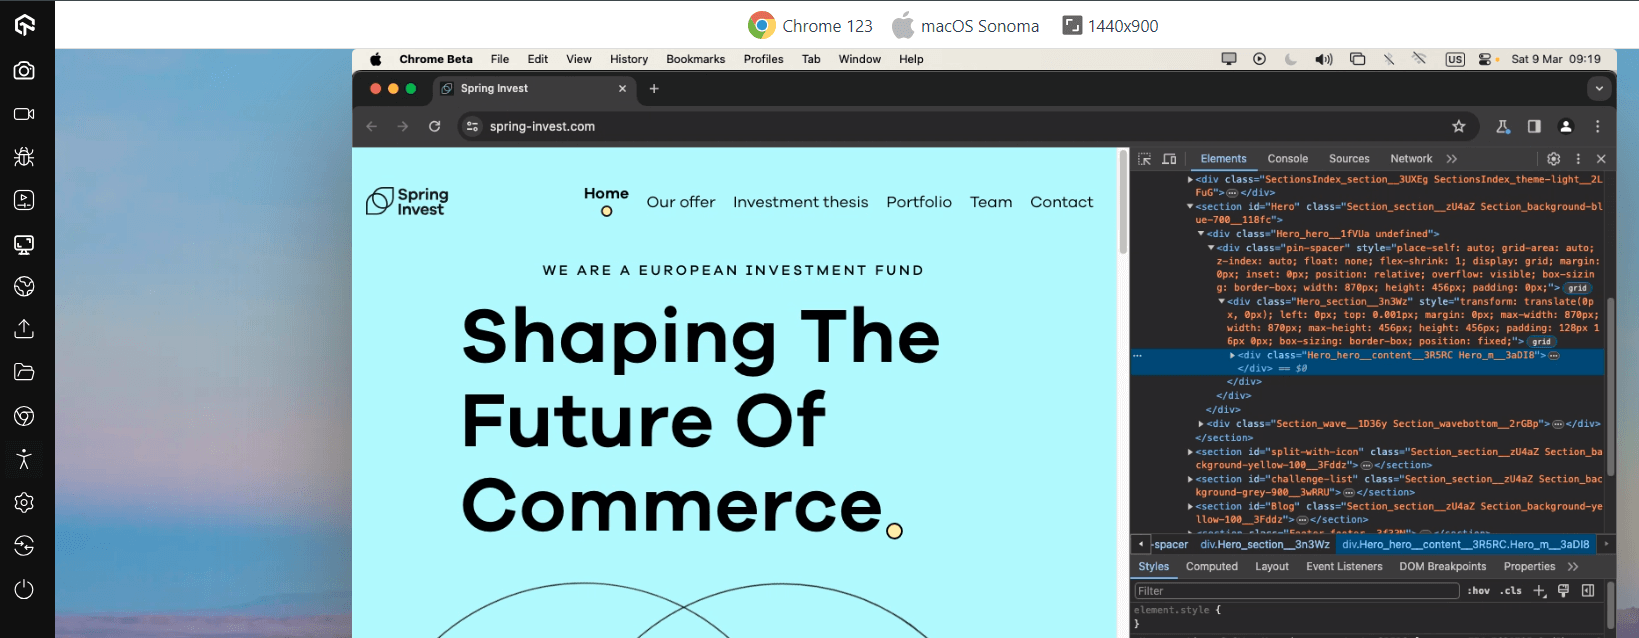
The above screenshot is rendered on LambdaTest, an AI-powered test orchestration platform on-cloud. LambdaTest offers both manual and automated testing on 3000+ real browsers running on real operating systems.
On LambdaTest, you can open the Google Chrome browser of your choice and right-click –> Inspect to open the developer tools panel.
Similarly, you can also leverage Developer tools in other browsers. Here is how you may open developer tools in Mozilla Firefox and Safari.
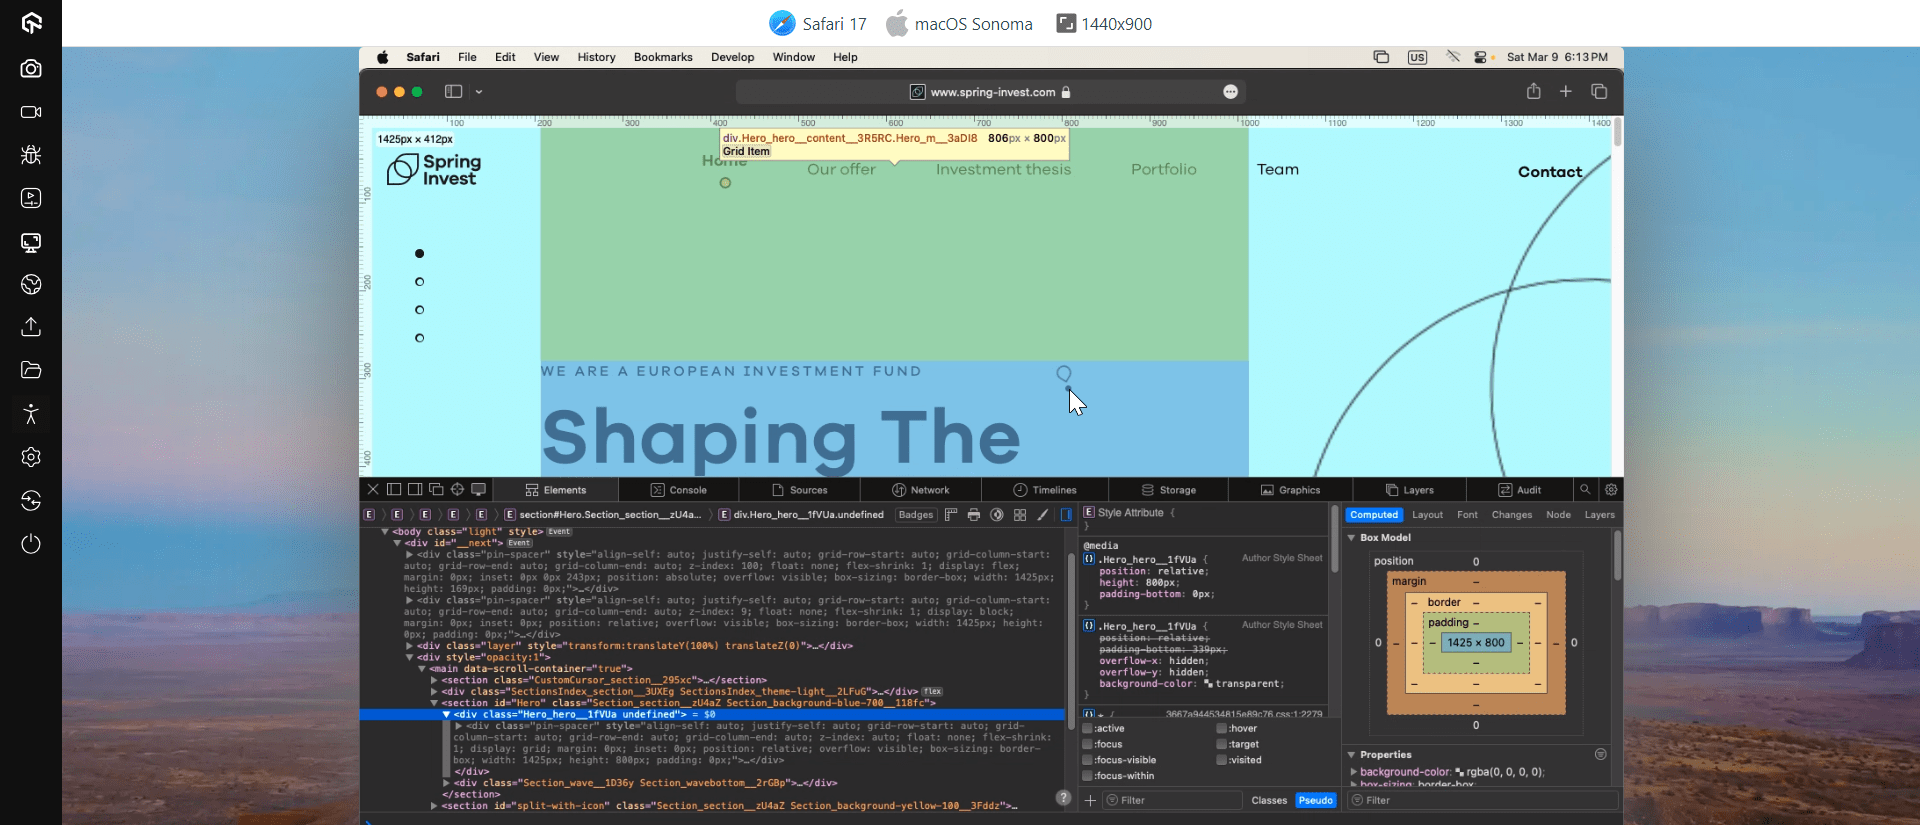
To open Developer tools in Mozilla Firefox, go to the website and right-click on the element you wish to debug. Then select Inspect Element.
Similarly, to open Developer tools in Safari, go to the website and right-click on the element you wish to debug. Then select Inspect Element.
For this post, as I mentioned, we will stick to Google Chrome. Let’s us look into the 16 tips to use Chrome Dev Tools for better cross browser testing.
Tip #1: Finding an Element
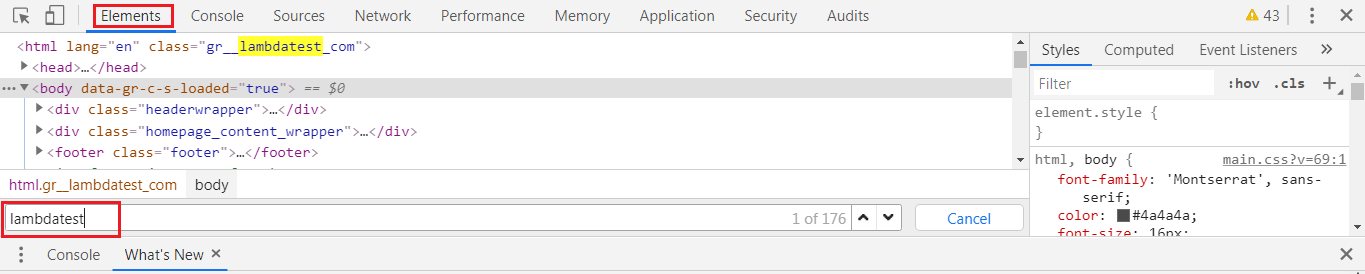
This feature helps the tester/developer find any element on a webpage in the source code. Open your Chrome Dev Tools & visit the “Elements” tab. Once you are in the Elements section, press Ctrl + F (Cmd + F). This will open an input box where you can enter the element you desire to find and the tool will highlight it for you.
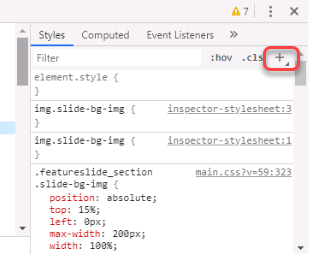
Tip #2: Add and Edit CSS Elements Directly
Chrome Dev Tools let you add the CSS elements into the code. You can even edit these CSS elements directly from the console.
That way, you can make changes to the styling of your web page instantly. These changes would only be applicable on your browser for a particular session. So once you reload the page the changes would be reverted.
Tip #3: Change Position Of Elements
In the Elements tab of the developer tool, you can change the position of the elements by simply dragging and dropping to the required position. This will show you the updated code’s rendered output on the screen.
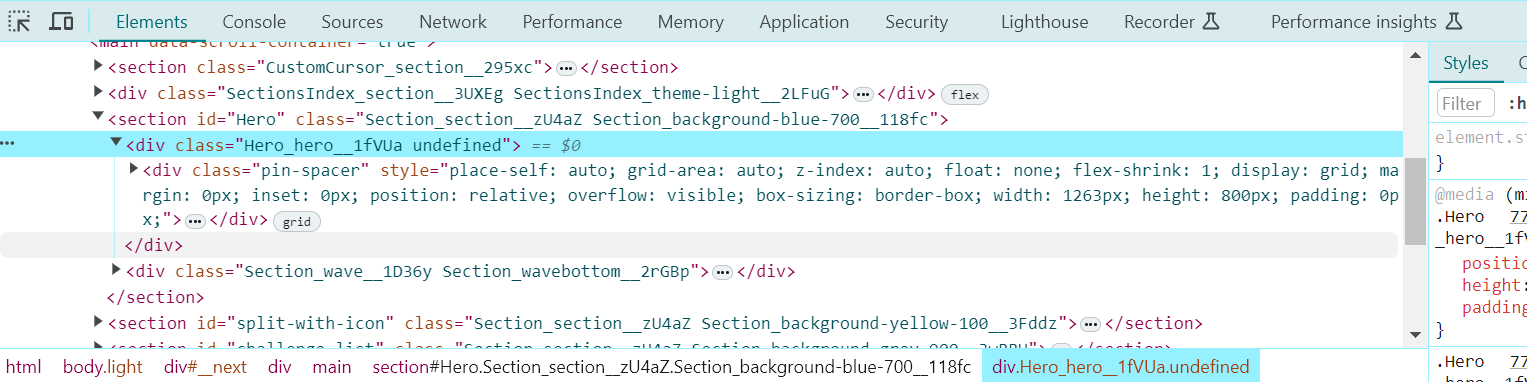
Thay way, you can restructure and experiment with the current webpage to evaluate where your content fits best.
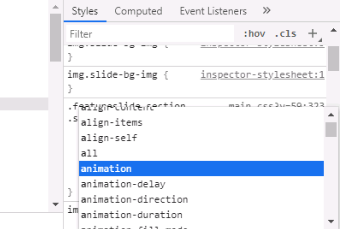
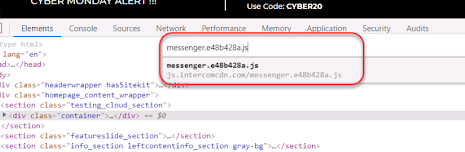
Tip #4: Locate CSS Property In Sources
Many times a tester needs to find a property in Sources which is defined in the Elements to make some changes to it. They can achieve this quickly with Ctrl + Click (Cmd + Click). You can then visit Sources to find the property highlighted.
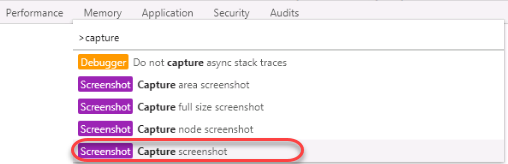
Tip #5: Screenshot An Element
The developer and tester can take a screenshot of an element. To capture a screenshot of an element through Chrome Dev Tools, select the element and then press Ctrl + Shift + P (Cmd + Shift + P). This will open up the command console which accepts various commands. Enter CAPTURE SCREENSHOT as the command to take a screenshot of the element.
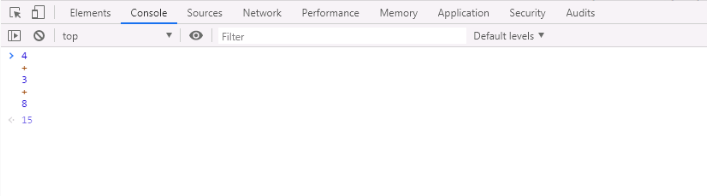
Tip #6: Continue Console Operation
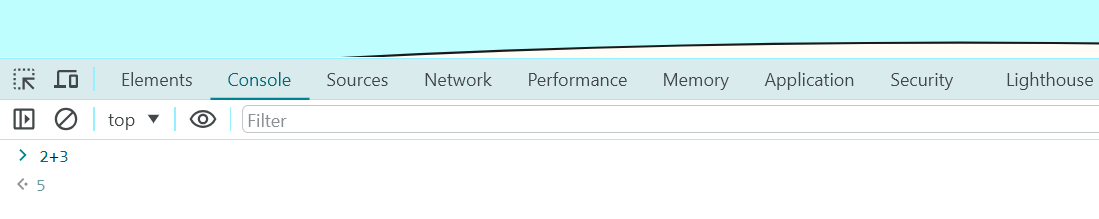
While working on the console, you might have noticed that every new line gives a certain output which depends on the expression you defined in the previous line. With Google Chrome Dev Tools, you can use this output on your next expressions by referring to it as “$_”.
Tip #7: Multi-Lines Scripting Feature in the Console
The console in any software or operating system normally gives an output of the previous expression on every new line. The developer console also works similarly. However, in Chrome Dev Tools Console, a tester can choose to go for multi-line scripting in the console. To enable the multi-line scripting feature, press Shift + Enter.
The console tab is bound to get clustered with various logs. To clear the console, you need to press Ctrl + L (Cmd + K).
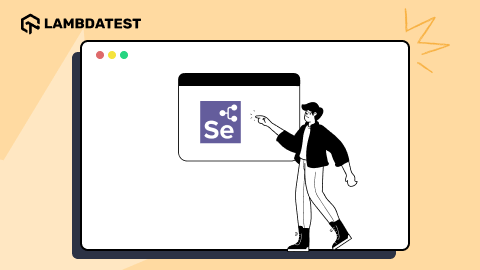
Tip #8: Locators For Selenium Automation Testing
For automation testers, Chrome developer tools have become imperative. While you are performing Selenium automation testing, location elements are crucial to help direct your WebDriver to the correct element. Locators in Selenium helps you to accomplish that. Using Locators, you can locate a specific web element over a web page. Below are the types of locators in Selenium.
- ID
- Name
- Linktext
- Partial Linktext
- Tag Name
- Class Name
- CSS Selector
- Xpath
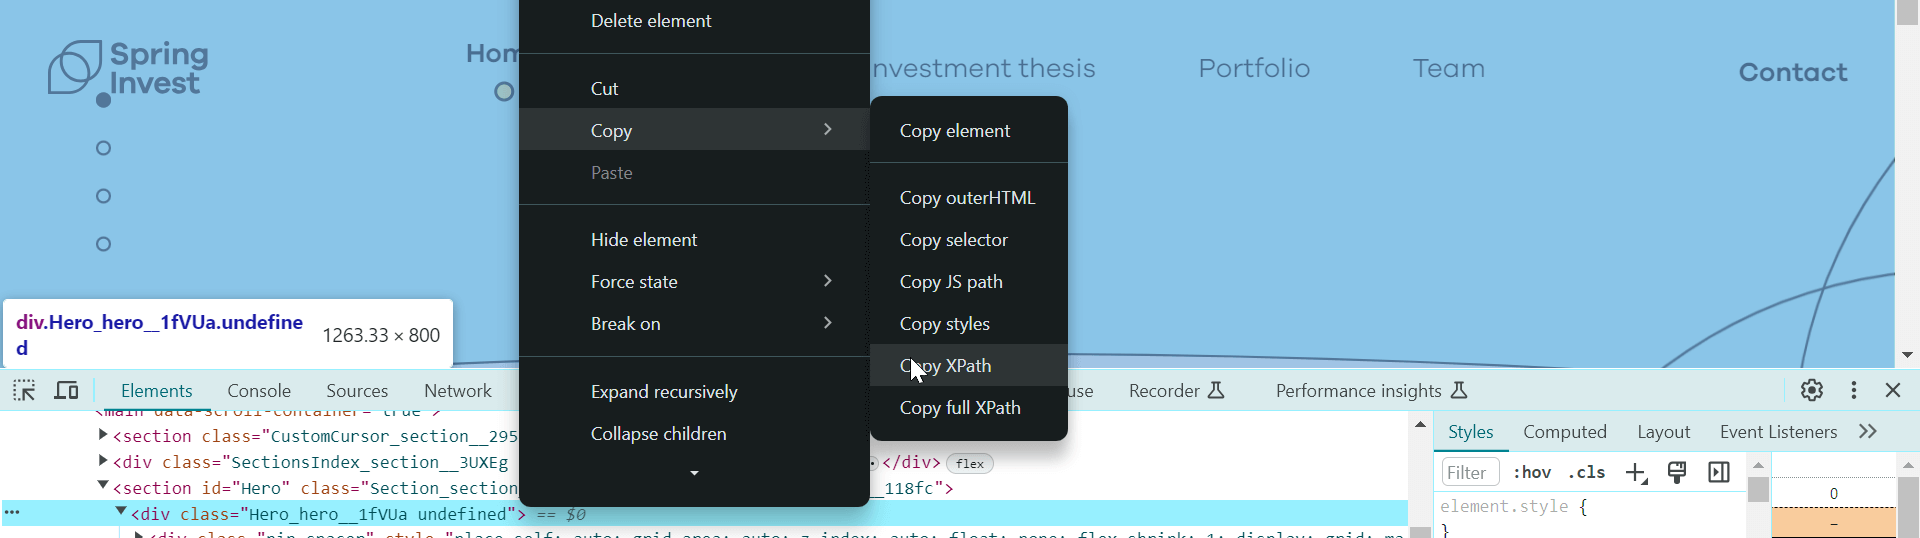
Using Google Chrome developer tools, you can find the necessary input for these locators. For example, if you wish to leverage the XPath of a web element, you can copy it using the developer tools and feed it to your Selenium automation scripts.
Tip #9: Clear Cookies
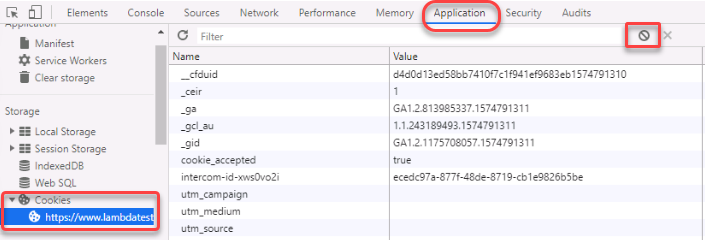
Testing any third party applications creates a lot of cookies while debugging. Since debugging requires executing the script multiple times, cookies can interfere with the actual result. So, these need to be cleared. Although Google Chrome provides an option in the Settings to do this, the tester can save time and quickly clear all the cookies from the developer tool only for that specific website or webpage.
To clear the cookies, go to Applications -> Cookies and clear all the cookies or only specific ones.
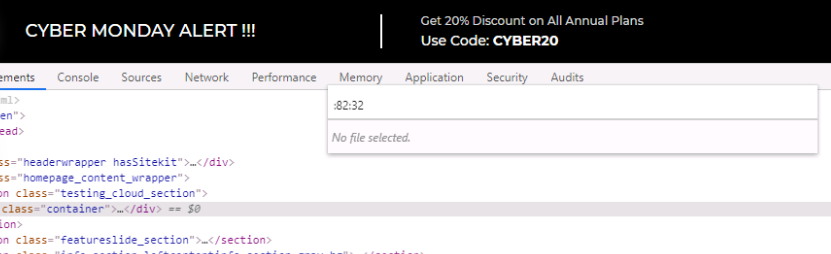
Tip #10: Reach Specific Line and Column Directly
You can reach a specific line and column directly in the Chrome Dev Tools through the panel. You can open the panel to enter the line and column name by pressing Ctrl + O (Cmd + O).
Tip #11: Switch Files Within Project
A web-based project contains many files within. As a web tester or web developer, you may need to switch between these files many times during the integration testing or even unit testing phase. Developer tools provide quick file switching within the project by just typing the name of the file in the panel.
The panel can be opened by pressing Ctrl + P (Cmd + P).
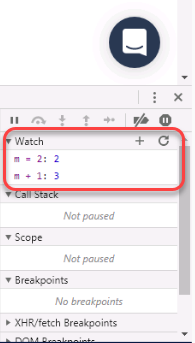
Tip #12: Watch Expression
Chrome Developer Console provides a feature called watch expression. This feature is located in the “Sources” tab in the right column. A tester needs to keep an eye on a variable or expression a lot of times during the debugging phase. Finding, again and again, takes a lot of time. By watch expression feature, the Chrome Dev Tools do that for you. The tester needs to enter the expression or variable in the section and it gets updated every time there is any change.
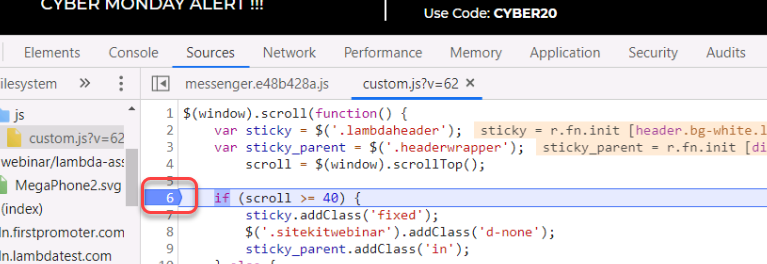
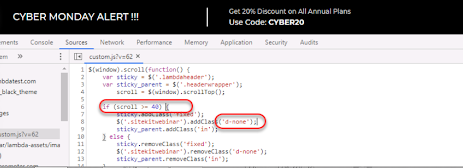
Tip #13: JavaScript Breakpoints
For a typical website, JavaScript codes are long. With so many values changing on a single request, the tester needs to locate and observe them for better testing. For example, an API request using AJAX might run 4 times and provide different status codes. This needs to be checked at every point to test efficiently. For this, developer tools provide a feature called JavaScript Breakpoints. Using JavaScript Breakpoints, you can define the particular line of code where you wish to halt the execution. To apply a JavaScript breakpoint, simply click on the line where you need your JavaScript code execution to stop.
Tip #14: XHR/Fetch Breakpoints
The “Sources” tab contains the XHR/Fetch Breakpoint section below Watch Expression. With this, you can set a breakpoint in the script any time an XHR/Fetch request is sent. The tester is also free to use this feature only on specific XHR/Fetch requests with specific URLs.

Tip #15: Initialize Multiple Cursors
Wouldn’t it be cool to write on different lines simultaneously? Well, Google Chrome Developer Tools allow a tester to achieve that by initializing multiple cursors. Multiple cursors can be initialized by pressing Ctrl + Click (Cmd + Click). Once the cursors are initialized, whatever you write, will be written in all the places.
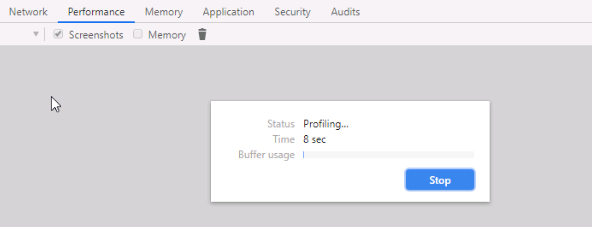
Tip #16: Monitor Performance
Google Developer tool allows the tester to monitor the performance of the website directly from the tool. This helps the tester validate the resources that are being used such as time, activity and source. For monitoring the performance of a webpage, you would need to visit the performance tab in the Chrome Dev Tools and press Ctrl + E (Cmd + E) and then press Ctrl + R (Cmd + R) to reload the page. Hit the stop button to halt the performance monitoring.
How to Access Chrome Dev Tools On LambdaTest?
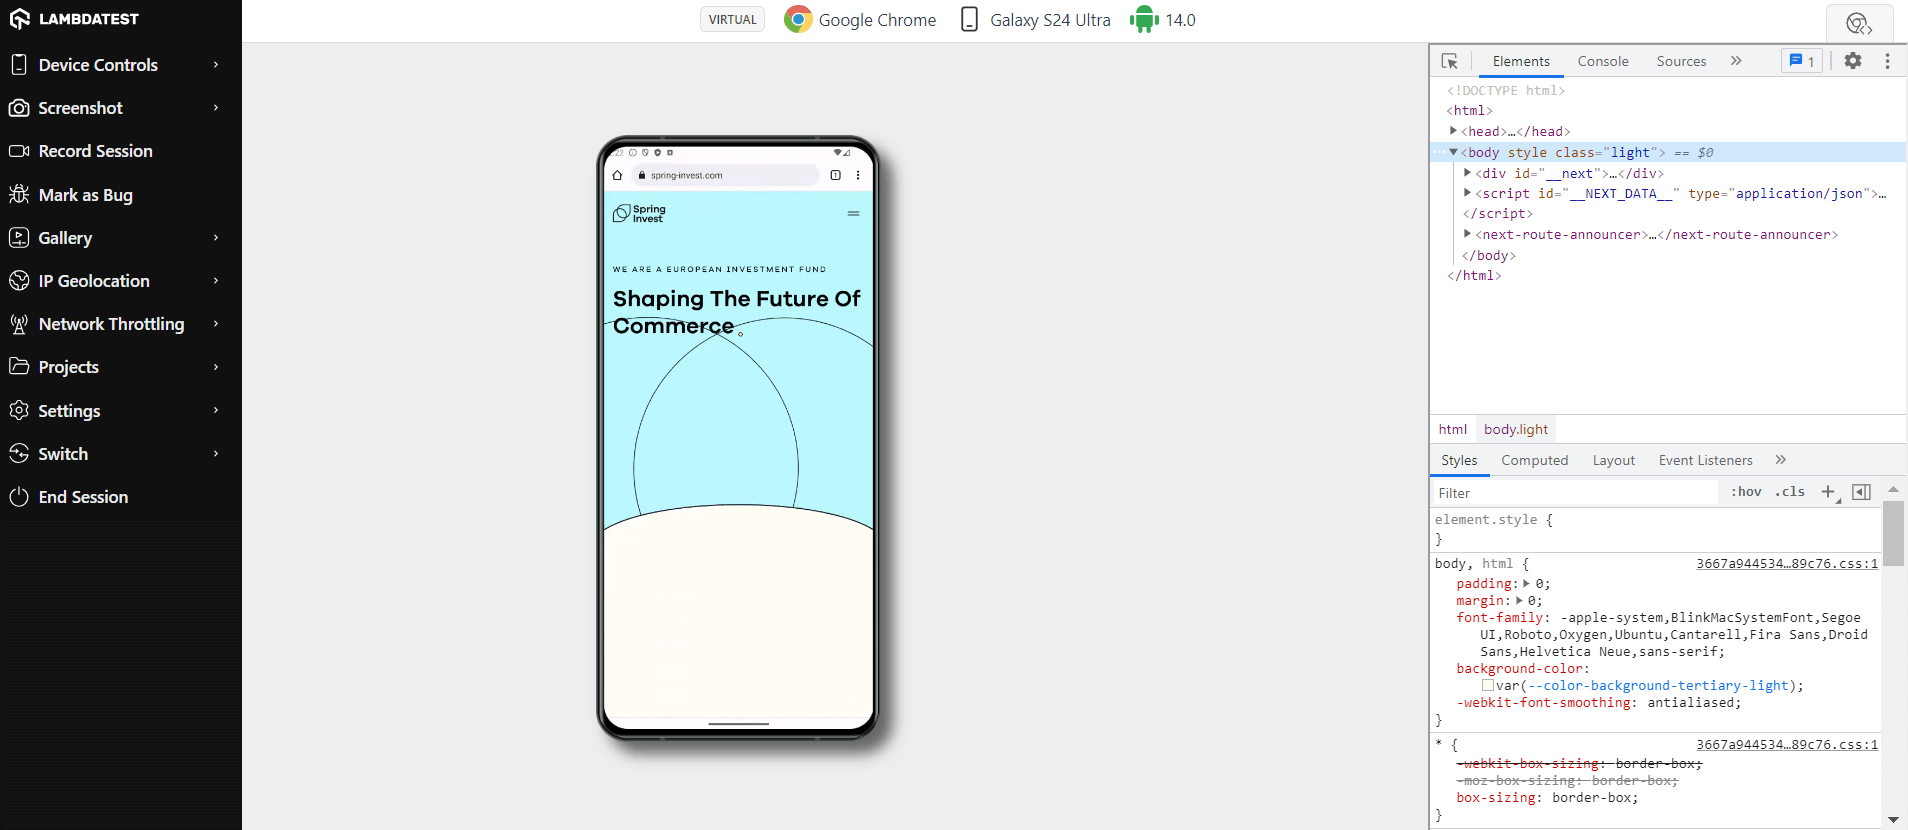
LambdaTest is an AI-powered test orchestration and execution platform that provides an easy and quick way to access the developer tools in Google Chrome, as well as other browsers such as Mozilla Firefox, Opera, Safari, Internet Explorer, Edge, Yandex. You can even open developer tools over Android and iOS browsers while cross browser testing.
For desktop browsers, you can access Developer Tools using the same way as we saw above. Just right-click and inspect. For mobile browsers, you will find an option inside the controller buttons on the left.
Make sure to incorporate Developer Tools a part of your cross browser testing checklist to ensure cross browser compatibility with LambdaTest.
Debug using Chrome Dev Tools across 3000+ desktop and mobile browsers. Try LambdaTest Now!
100+ Free Online Tools From LambdaTest!
LambdaTest has come up with an index of 100+ free online developer tools for developers and testers. From HTML, XML, and JSON formatters to robust data generators, and hash calculators. LambdaTest’s free online tools are built to help engineering teams accelerate and be more productive with their daily activities.
Code Tidy
- JSON Prettify
- JSON Minify
- HTML Prettify
- HTML Minify
- JavaScript Minify
- CSS Minify
- CSS Prettify
- XML Minify
- XML Prettify
Data Format
- IDN Encode
- IDN Decode
- XML to JSON Converter
- JSON to XML Converter
- BCD to Decimal
- HEX to Decimal
- Decimal to BCD
- UTF8 Decode
- UTF8 Encode
- HEX to RGB Converter
- RGB to HEX Converter
- HTML to Markdown Converter
- Markdown to HTML Converter
- Decimal to Gray Code Converter
- Gray Code to Decimal
- URL Decode
- URL Encode
- Base64 Encode
- Base64 Decode
- Text to HTML Entities Converter
- HTML Entities to Text Converter
Random Data
- Random JSON Generator
- Random XML Generator
- Random CSV Generator
- Random YAML Generator
- Placeholder Image Generator
- Random Binary Generator
- Random Character Generator
- Random Color Generator
- Random Date Generator
- Random Decimal Fraction Generator
- Random Decimal Generator
- Random GUID Generator
- Random HEX Generator
- Random Octal Generator
- Random IP Generator
- Random MAC Generator
- Random Number Generator
- Random Paragraph Generator
- Random Password Generator
- Random Time Generator
- Random UUID Generator
- Random Sentence Generator
- Random String Generator
- Random Word Generator
- Random Data from RegEXP
- Test Data Generator
- Lorem Ipsum Generator
- Credit Card Number Generator
- QR Code Generator
- Random Byte Generator
Security Tools
- Hash Calculator
- Hash MAC Generator
- CRC32 Hash Calculator
- CRC32B Hash Calculator
- Ripe MD 128 Hash Calculator
- Ripe MD 160 Hash Calculator
- Ripe MD 256 Hash Calculator
- Ripe MD 320 Hash Calculator
- MD2 Hash Calculator
- MD4 Hash Calculator
- Adler32 Hash Calculator
- Gost Hash Calculator
- Whirlpool Hash Calculator
- MD5 Hash Calculator
- SHA1 Hash Calculator
- SHA256 Hash Calculator
- SHA384 Hash Calculator
- SHA512 Hash Calculator
Utils
- Find and Replace String
- HTML Escape
- HTML Unescape
- Difference Checker
- Shuffle Letters
- Shuffle Text Lines
- Sorting List
- Split Your String
- Text Lowercase
- Text Uppercase
- Text Repeater
- Text Rotator
- Character Count
- Word Count
- Lines Count
- Sentence Count
- URL Parse
- JSON Escape
- JSON Unescape
- Extract Text from HTML
- Extract Text from JSON
- Extract Text from XML
- Strip HTML
- JSON Validator
Frequently Asked Questions (FAQs)
What are Chrome DevTools?
Chrome DevTools is a set of web development and debugging tools built directly into the Google Chrome browser, enabling developers to inspect, debug, and analyze web applications.
Can you open DevTools on mobile Chrome?
Yes, you can open Chrome DevTools on mobile devices by enabling USB debugging in the developer options and using Chrome on your computer to inspect and debug web pages running on your mobile Chrome browser.
What is Chrome DevTools used for?
Chrome DevTools is used for web development and debugging tasks like inspecting and editing code, analyzing performance, debugging JavaScript, simulating devices, and optimizing web pages.
What is the difference between DevTools and WebDriver?
DevTools provides real-time inspection and debugging of web pages, while WebDriver is a library for automated testing and browser control, used for tasks like functional testing and automation.
What is the difference between Chrome and Chrome Dev?
Chrome is the regular web browser, while “Chrome Dev” is a pre-release version for developers to test upcoming features before they’re launched to the stable version.
What is the shortcut to open DevTools?
The shortcut to open DevTools in Chrome is Ctrl + Shift + I (Windows/Linux) or Command + Option + I (Mac).
Is Chrome DevTools good?
Absolutely, Chrome DevTools is highly regarded among developers for its reliable features and user-friendly interface, serving as an essential tool for web development tasks.
Can I debug JavaScript using Chrome DevTools?
Yes, Chrome DevTools provides a powerful JavaScript debugger. You can set breakpoints, step through code, inspect variables, and diagnose and fix issues in your JavaScript code.
What is the “Console” tab used for in Chrome DevTools?
The “Console” tab allows you to execute JavaScript code directly in the browser and view the output. It’s also where you can see errors, log messages, and interact with the page’s JavaScript environment.
Is Chrome DevTools only for Chrome browser?
While Chrome DevTools is optimized for the Chrome browser, it can also be used for debugging and profiling on other browsers like Microsoft Edge and Opera, as they are built on the same underlying engine.


Author’s Profile
Harish Rajora
I am a computer science engineer. I love to keep growing as the technological world grows. I feel there is no powerful tool than a computer to change the world in any way. Apart from my field of study, I like reading books a lot and write sometimes on https://www.themeaninglesslife.com .
Blogs: 88
Got Questions? Drop them on LambdaTest Community. Visit now